Benefits:
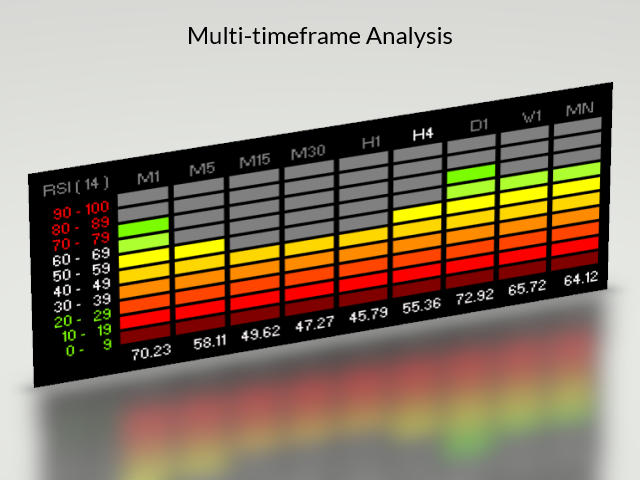
A new and innovative way of looking across multiple timeframes and multiple indicators on any chart.
Provides instant multi-timeframe analysis of any market. i.e. forex currency pairs, cryptocurrency pairs, commodities, etc.
It offers precise indications across multiple timeframes of volatility as measured by RSI, ADX and STOCH within one chart.
Helps you determine high probability trading setups. See example strategy in comments.
Can see bullish/bearish volatility building across multiple timeframes and multiple indicators i.e. trading H1 chart can see RSI and
STOCH gaining support across M1, M5, M15, M30.
Recognize trends as they develop without any need to look at multiple charts using different timeframes for the same trading pair and act
accordingly.
Identify sudden market fluctuations as they happen due to various major events on your trading pairs.
Indicators are being created dynamically and react in real-time to the price action of the market.
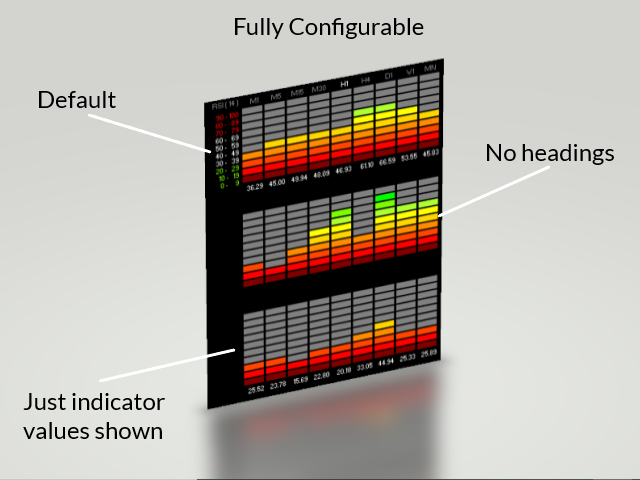
Can configure indicator to suit your trading style.
A must-have trading tool by every trader, whether scalper, swing trader, long-term investor, etc.
Features:
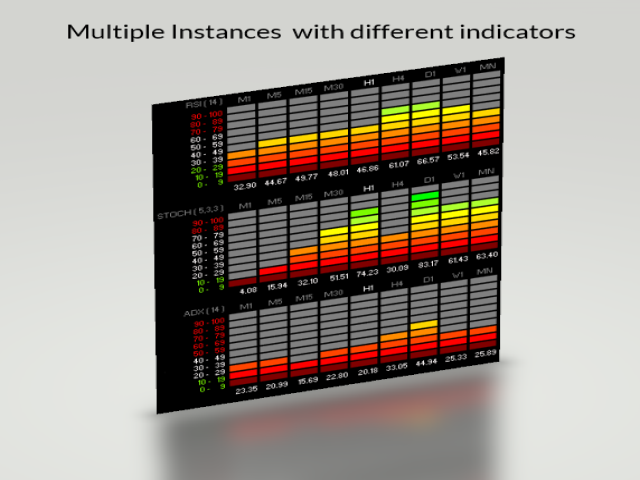
Provides the ability to compare an indicator across multiple timeframes at a glance.
Multi-Instance (requires you give it a Unique Id#).
Multiple indicators are supported, currently RSI, ADX and Stochastics.
Can have multiple instances of the same indicator i.e. RSI(14) and RSI(2).
Can have multiple instances of different indicators i.e. RSI(14), ADX(14), STOCH(5,3,3).
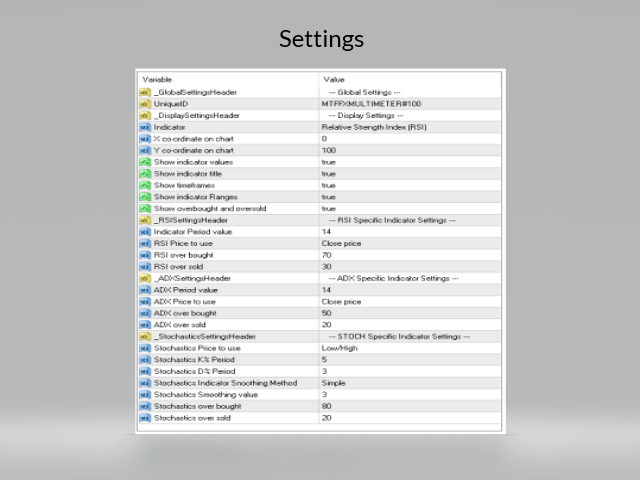
Indicators are configurable via settings dialog for Period length, Smoothing, etc.
Provides support for highlighting Over sold / Over bought ranges.
Supports all common chart timeframes in one indicator i.e. M1, M5, M15, M30, H1, H4, D1, W1, MN.
Current Period is highlighted so you know to look left of that to see momentum building.
All Colors can be modified to suit your own preference via the Colors Tab.
Options exist to turn on or off the display of headings, timeframes, ranges and values. Note: Current Period highlighting won't show if
timeframes are turned off.
Q&A
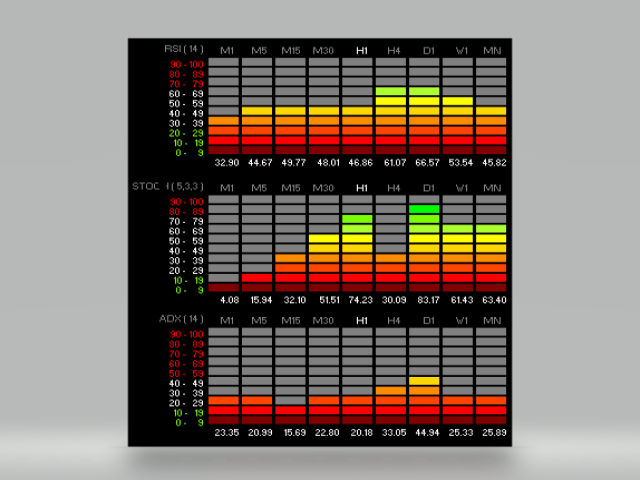
What do you see on the chart?
The first line:
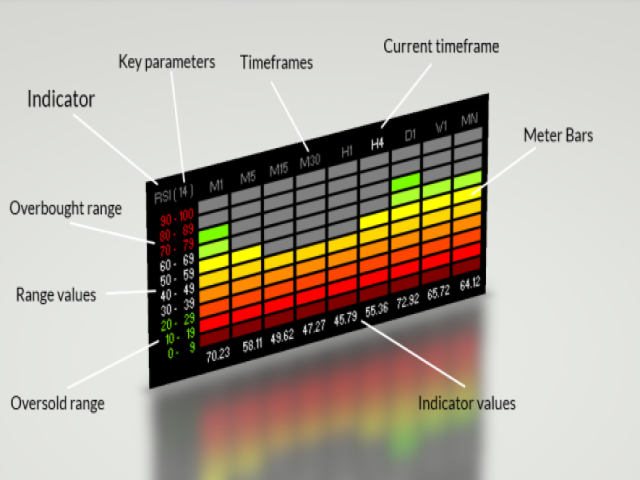
Shows the indicator being used i.e. RSI, ADX and Stochastics are supported right now.
It also shows any key paramters for the indicator i.e. Period Length, Smoothing, etc.
It also shows the timeframes being used. The current chart period will be highlighted by default.
The second line through to the tenth line:
Shows the indicator range being used to compare the current value of the indcator with i.e. 50-59, 60-69, etc.
It then shows the level bars for each timeframe for the indicator in question i.e. based on the RSI values
Grey level bars mean the value didnt reach that level.
Colored level bars are shown going from dark red (low value) through to light green (high value).
The level bars will rise and fall depending upon the current value of the indicator.
It acts just like the graphic equaliser on your stereo does depending on the loudness of the music only we are using the indicator values
instead.
The last line:
Shows the actual values of the indicator being used for each timeframe.
What indicators are currently supported?
Indicators currently implemented are:
Average Directional Index (ADX)
Relative Strength Index (RSI)
Stochastic Oscillator (STOCH)
Do I use this indicator myself?
Of course I do, the screenshots provided are from actual trades. I eat my own dog food as the saying goes.
I believe the ultimate test for a developer of indicators is whether they use the indicators to trade with live themselves.
I use this indicator daily for my own Forex/Cryptocurrency/Commodities trading.
It is useful for my trading so I thought others may find it useful also.
Future updates planned:
Alerts off overbought and oversold signals on multiple instances for current chart period.
Compact mode showing just the M5, M15, M30, H1, H4, D1 bars without any titles or headings.
Support for more indicators. i.e. STOCHRSI, etc.
Other changes will be based on user feedback.
I hope you find the MTF FX MultiMeter indicator of use to you.
If you have any questions just leave a comment and I will answer as soon as I am next online.
I wish you all happy trading with the MTF FX MultiMeter indicator.
Cheers,
Grant Cause