Multi Strategies Single Combined
- 지표
- Mohamed yehia Osman
- 버전: 2.1
- 업데이트됨: 2 1월 2020
- 활성화: 5
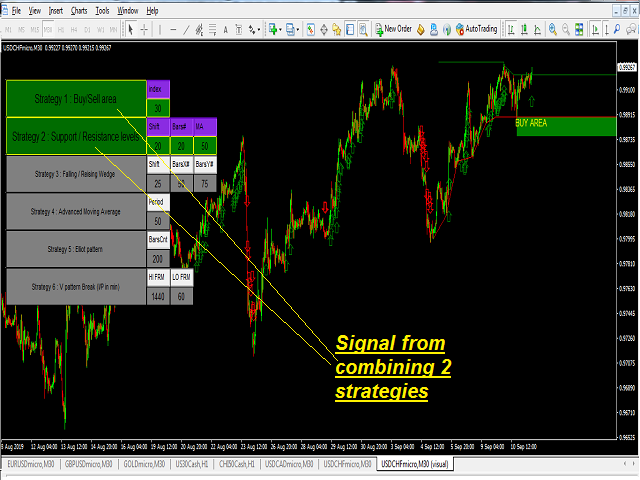
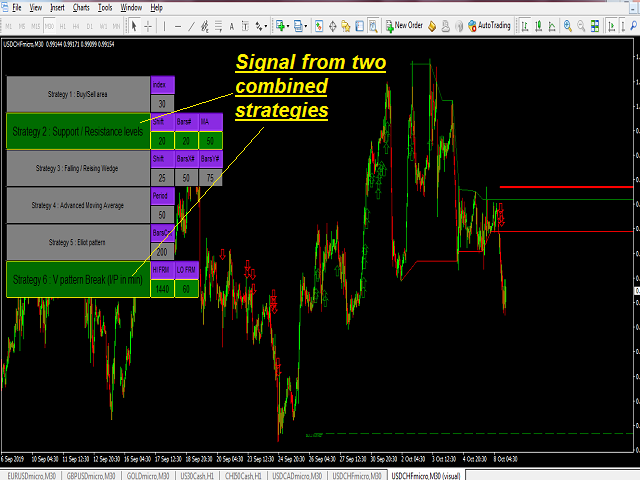
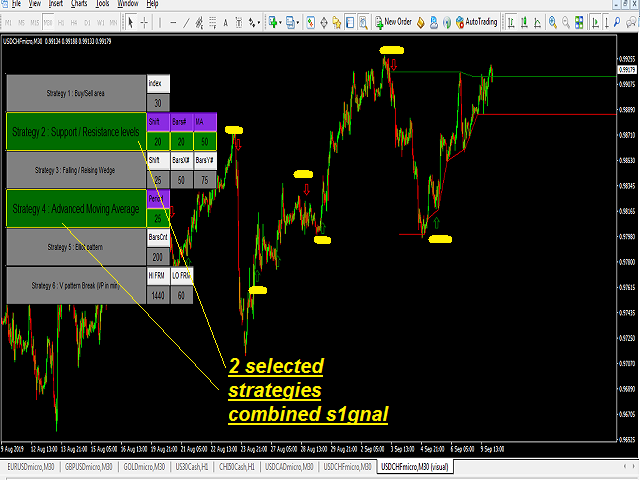
Select from up to 6 Strategies solo or Combine different strategies for signal generation
(Combining more than 2 strategies may LIMIT a lot the number of signals)!
ALL From Chart !!!
Also Inputs editing from Chart !!!
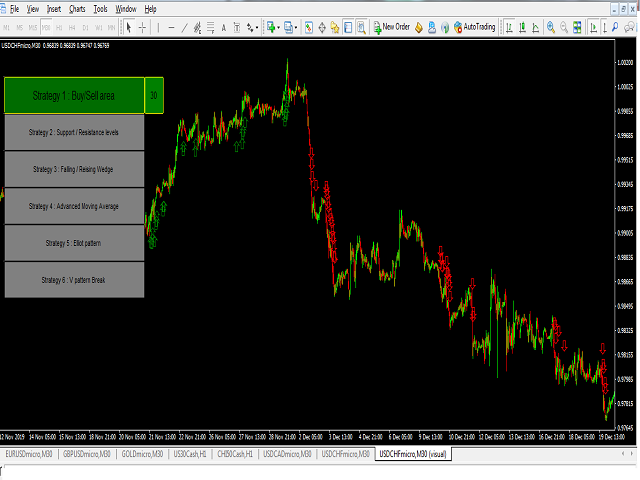
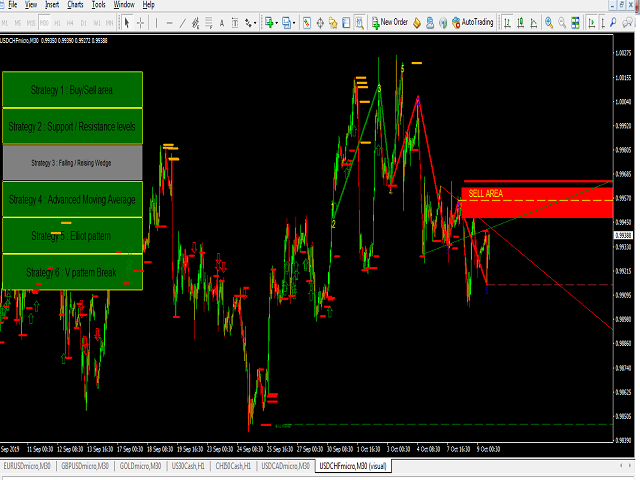
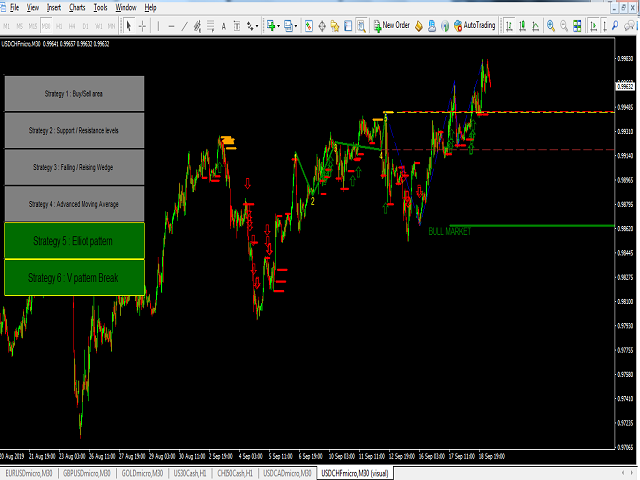
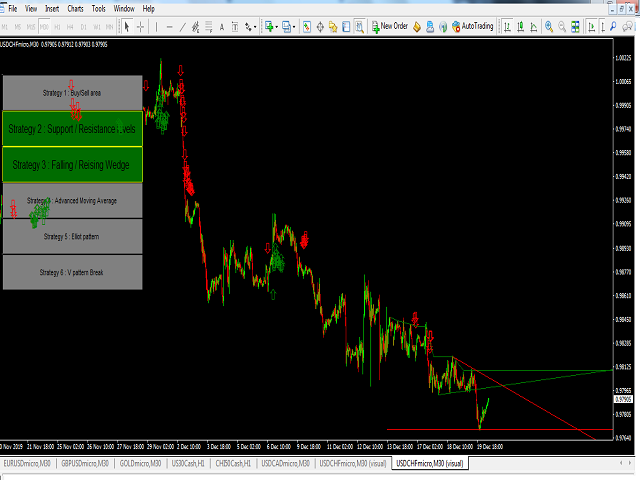
Push your strategy bottom (one strategy) OR Combine signal from as may strategies (up to 6) :
Selected and enabled strategies will be in GREEN !!!
1- BUY SELL areas
2- Support resistance break signal
3- Elliot wave continuation /reversal signal
4- Advanced Moving averages
5- Trend Lives
6- V shape pattern
**graphic user interface for selection of Strategies .
**Alerts for mobile and email
inputs are imputed from the usual indicator properties inputs (untill GUI interface for inputs will be created in ver 2)
You try your parameters for any strategy for any time frame
**the setup reset parameters for all strategies i use it for M30 chart**
Enjoy the Demo tester