• 미리보기
  • 리뷰 (13)
  • 코멘트 (13)
  • 새 소식

MASR Bands

4.64

또는 M oving verage S upport를 R의 esistance 밴드.

MASR 밴드 표시기는 지지 및 저항 수준으로 함께 작동하는 두 밴드로 둘러싸인 이동 평균입니다. 통계적으로 MASR 밴드는 시간의 93%에 가격 캔들을 포함합니다. 단계별로 계산하는 방법은 다음과 같습니다.

1. 첫 번째 단계는 X 기간 동안 최고 고가(HHV)와 최저 저가(LLV)를 계산하는 것입니다.

2. 두 번째 단계는 HHV를 LLV로 나누어 그들 사이의 거리가 얼마나 넓은지 백분율로 구하는 것입니다. 나는 이 단계의 결과를 MASR Filter라고 부른다.

3. MASR 필터 = 합계((HHV / LLV)-1) / 막대 수

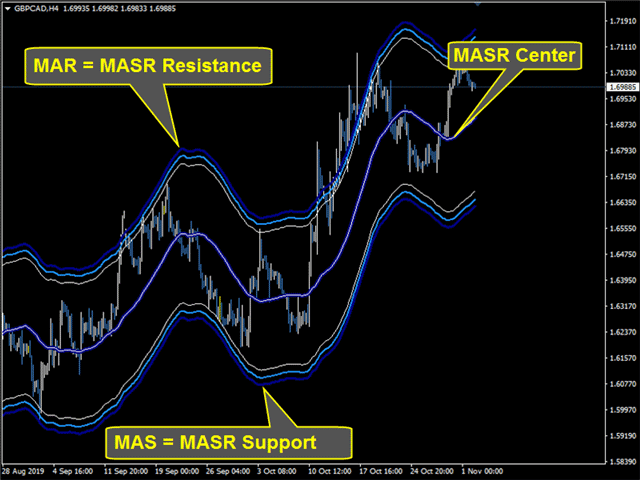
4. 나는 이동 평균 저항의 지름길인 상위 밴드를 MAR이라고 부릅니다. 저는 이동 평균 지원의 지름길인 하단 밴드 MAS라고 부릅니다. 밴드 사이의 이동 평균을 중앙선이라고 합니다.

5. MAR = MASR 센터 + (75% x MASR 필터 x MASR 센터)

6. MASR 센터는 이동 평균입니다.

7. MAS = MASR 센터 - (75% x MASR 필터 x MASR 센터)

중요 링크


MASR Bands를 특별하게 만드는 것은 변동성 지수로, 이는 Average True Range 또는 Standard Deviation 계산과 같이 한 막대에서 다른 막대로 이동하는 것이 아니라 완전한 스윙 움직임의 범위에 따라 계산됩니다.
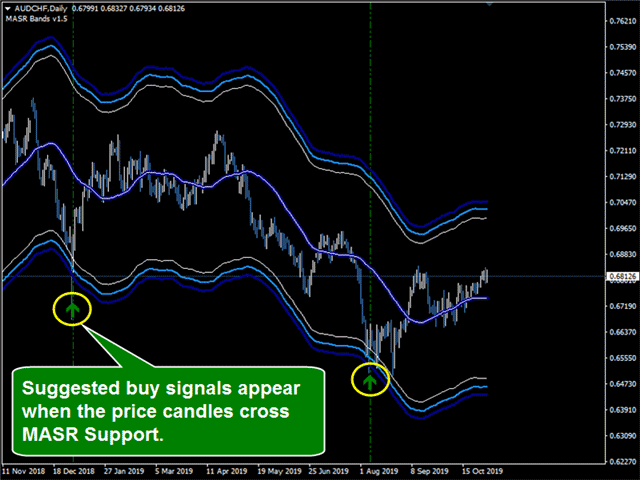
MASR 밴드는 어떻게 사용하나요?

  1. 추천 구매.가격 양초가 MAR를 하방으로 관통할 때.
  2. 판매 제안.가격 캔들이 MAS를 상향 돌파할 때.

MASR 밴드 기능

  • MASR 밴드는 결과를 다시 그리거나 다시 계산하지 않습니다.
  • 사용자가 매개변수를 쉽게 탐색할 수 있도록 잘 설계된 매개변수.
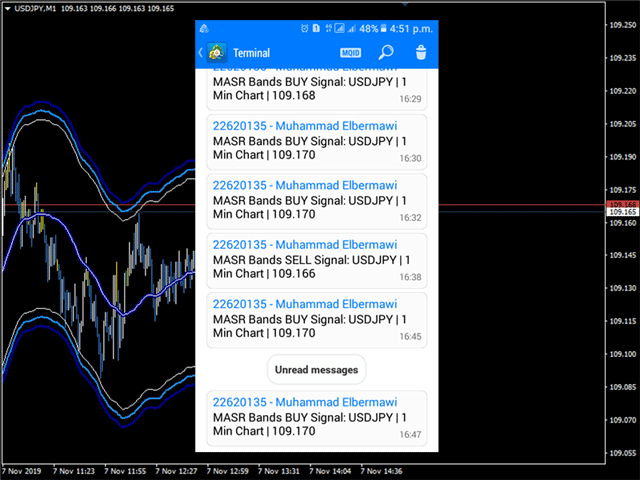
  • 사용자 선택에 따라 소리, 모바일 알림 및 이메일 알림.
  • MASR Bands 코드는 사용자의 PC 메모리를 소모하지 않도록 수정되었습니다.

MASR 대역 입력

1) MASR 입력

  • MASR 양초.계산에 사용된 초의 수입니다. 기본값은 40입니다. 2개 미만인 경우 MASR 밴드가 종료되고 경고 메시지가 화면에 나타납니다.
  • MASR 이동 평균 방법.평균 계산 방법. 기본값은 단순입니다.

2) MASR 경보

  • 화살표 및 수직선표시: 신호 또는 수직선 또는 둘 모두가 나타날 때 화살표를 표시합니다.
  • TDO 화살표 크기:기본값은 1입니다.
  • 소리 경고:기본값은 true입니다.
  • 이메일 보내기:기본값은 false입니다.
  • 알림 보내기:기본값은 false입니다.
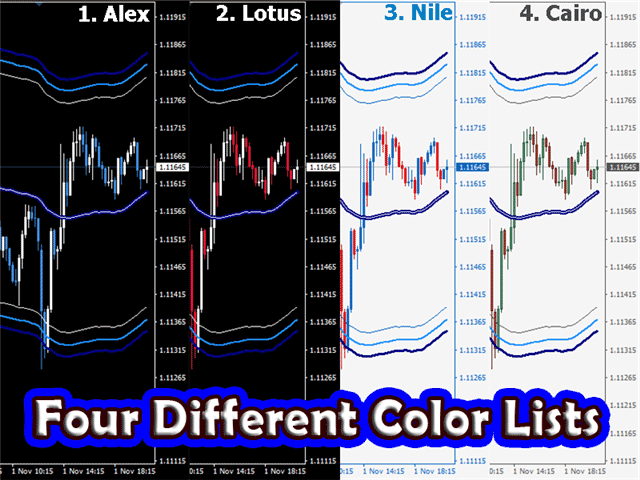
3) MASR 스타일

  • 차트 색상 목록.사용자는 자신의 차트에 대해 4가지 다른 색상 목록 중에서 선택하거나 자신의 목록을 사용하려면 (아무것도 하지 않음)을 선택할 수 있습니다.


질문이 있으시면 비밀 메시지를 통해 저에게 연락하거나 의견 섹션에 작성하십시오.
무하마드 알 버마우이, CMT


리뷰 13
ovno27
109
ovno27 2024.04.07 09:06 
 

Very good Indicator! I use it together with TDO and BD%

Mert Kurt
308
Mert Kurt 2022.06.05 22:28 
 

Useful product , i can follow the market with the alarm easily right now, thanks Muhammed Elbermawi

NIKO TORI
806
NIKO TORI 2022.01.08 20:07 
 

I tried demo version first, which made big impression so i decided to rent it for a month. I tried many bands, channel, etc. indicators, but this is the first ever i bought, so that tells something. Anyway i will give update after a month of trading live.

추천 제품
True Magic Oscillator
Muhammed Emin Ugur
The   True Magic Oscillator   indicator is designed for signal trading. This indicator generates trend signals. It uses many algorithms and indicators to generate this signal. It tries to generate signals from the points with the highest trend potential. This indicator is a complete trading product. This indicator does not need any additional indicators. The indicator is never repainted. The point at which the signal is given does not change.         Features and Recommendations Wor
Real Magic Trend
Muhammed Emin Ugur
This   Real Magic Trend   indicator is designed for signal trading. This indicator generates trend signals. It uses many algorithms and indicators to generate this signal. It tries to generate signals from the points with the highest trend potential. This indicator is a complete trading product. This indicator does not need any additional indicators. The indicator is never repainted. The point at which the signal is given does not change.      Features and Recommendations Time Frame
Trend Flasher
Amarnath K M
Trend Flasher Trend is your friend is the age old saying quote in trading arena, there are though many ways to gauge the trend and its direction, more scientific measure and logically meaningful will be an ATR break outs to identify and spot the trend and its acceleration, so we created this easy to use trend identification panel and optimized super trend based multi time frame panel entry system to aid and help the traders to make their trading decision. Unique Features of Trend Flasher 1
Signal From Level
Yaroslav Varankin
Binary Options Support Resistance Indicator This indicator is designed for binary options trading and effectively shows retracements from support and resistance levels. Signals appear on the current candle. A red arrow pointing downwards indicates a potential selling opportunity, while a blue arrow pointing upwards suggests buying opportunities. All that needs adjustment is the color of the signal arrows. It is recommended to use it on the M1-M5 timeframes as signals are frequent on these timef
Credible Cross System
Muhammed Emin Ugur
Credible Cross System   indicator is designed for signal trading. This indicator generates trend signals. It uses many algorithms and indicators to generate this signal. It tries to generate a signal from the points with the highest trend potential. The indicator works based on instant price movements. This indicator is a complete trading product. This indicator does not need any additional indicators. The indicator certainly does not repaint. The point at which the signal is given does not
FiboZag
Andriy Sydoruk
Indicator FiboZag - transfer the indicator to the chart and the Fibonacci levels will be built automatically on the last ZigZag turn. The main advantage lies in the correct construction of Fibonacci levels and markup of price levels. Simple, visual and effective use. The indicator is not redrawn and does not lag. Works on all currency pairs and on all timeframes.
Crosskalp1
Mikhail Bilan
Добрый День уважаемые трейдеры!  Вашему вниманию индикатор созданный и работающий на базе трендовика ADX,  для торговли на смене направления движения который учитывает коррекцию и даёт возможность на ней заработать.  Применяю этот индикатор для скальпинга. Рекомендую таймфреймы от 15 ти минутного(М15) до часового (Н1) периодов.  Красный кружок сигнал на продажу- Sell) Зелёный кружок  сигнал на покупку Buy) Чем меньше ваш таймфрейм тем меньше пунктов вы зарабатываете.   Важно выставлять стопы! !В
Gvs Undefeated Trend   indicator is designed for trend and signal trading. This indicator generates trend signals.  It uses many algorithms and indicators to generate this signal. It tries to generate a signal from the points with the highest trend potential. This indicator is a complete trading product. This indicator does not need any additional indicators.  You can only trade with this indicator. The generated signals are displayed on the graphical screen.  Thanks to the alert features you ca
Pro Magic Signal   indicator is designed for signal trading. This indicator generates trend signals.  It uses many algorithms and indicators to generate this signal. It tries to generate a signal from the points with the highest trend potential. This indicator is a complete trading product. This indicator does not need any additional indicators.  The indicator certainly does not repaint. The point at which the signal is given does not change.  Thanks to the alert features you can get the signals
Fx Perfect Signal indicator is designed for signal trading. This indicator generates trend signals.  It uses many algorithms and indicators to generate this signal. It tries to generate a signal from the points with the highest trend potential. This indicator is a complete trading product. This indicator does not need any additional indicators.  The indicator certainly does not repaint. The point at which the signal is given does not change.  Thanks to the alert features you can get the signals
Forex scalping indicator that does not redraw its arrows. It works best on M5, M15, M30, H1 timeframes. The default settings are for M5 timeframe. The picture below shows an example of working on the H1 chart with the "period=0.35" parameter value. You can download the demo version and test it yourself. Now we use the signals of this indicator in almost all of our scalping strategies. According to our calculations, the accuracy of its signals is about 95% depending on the timeframe. The indicato
ADX Pointer
Dominik Mandok
ADX Pointer is an indicator which is based on "Average Directional Index" and draws three numbers in chart window depending on the value of ADX. In ADX Pointer you can set "ADX_Period" which is of course period of Average Directional Index and you can also set 3 levels. When ADX value exceed first level ("ADX_Level1") in chart window appears number "1", when ADX exceed second level ("ADX_Level2") appears "2" and when ADX exceed third level ("ADX_Level3") appears "3". Simple. ADX Pointer works on
VR Cub
Vladimir Pastushak
VR Cub 은 고품질 진입점을 얻는 지표입니다. 이 지표는 수학적 계산을 용이하게 하고 포지션 진입점 검색을 단순화하기 위해 개발되었습니다. 지표가 작성된 거래 전략은 수년 동안 그 효율성을 입증해 왔습니다. 거래 전략의 단순성은 초보 거래자라도 성공적으로 거래할 수 있다는 큰 장점입니다. VR Cub은 포지션 개시 지점과 이익 실현 및 손절매 목표 수준을 계산하여 효율성과 사용 편의성을 크게 높입니다. 간단한 거래 규칙을 이해하려면 아래 전략을 사용한 거래 스크린샷을 살펴보세요. 설정, 세트 파일, 데모 버전, 지침, 문제 해결 등은 다음에서 얻을 수 있습니다. [블로그] 다음에서 리뷰를 읽거나 작성할 수 있습니다. [링크] 버전 [MetaTrader 5] 진입점 계산 규칙 포지션 개설 진입점을 계산하려면 VR Cub 도구를 마지막 최고점에서 마지막 최저점까지 늘려야 합니다. 첫 번째 지점이 두 번째 지점보다 빠른 경우, 거래자는 막대가 중간선 위에서 마감될 때까지 기다립
Trend Ray
Andriy Sydoruk
The indicator shows the potential trend direction by cyclical-wave dependence. Thus, all the rays of the intersection will be optimal rays, in the direction of which the price is expected to move, taking into account the indicator period. Rays can be used as a direction for potential market movement. But we must not forget that the approach must be comprehensive, the indicator signals require additional information to enter the market.
Owl smart levels
Sergey Ermolov
4.63 (54)
MT5 버전  |   FAQ Owl Smart Levels Indicator 는   Bill Williams 의 고급 프랙탈, 시장의 올바른 파동 구조를 구축하는 Valable ZigZag, 정확한 진입 수준을 표시하는 피보나치 수준과 같은 인기 있는 시장 분석 도구를 포함하는 하나의 지표 내에서 완전한 거래 시스템입니다. 시장과 이익을 취하는 장소로. 전략에 대한 자세한 설명 표시기 작업에 대한 지침 고문-거래 올빼미 도우미의 조수 개인 사용자 채팅 ->구입 후 나에게 쓰기,나는 개인 채팅에 당신을 추가하고 거기에 모든 보너스를 다운로드 할 수 있습니다 힘은 단순함에 있습니다! Owl Smart Levels   거래 시스템은 사용하기 매우 쉽기 때문에 전문가와 이제 막 시장을 연구하고 스스로 거래 전략을 선택하기 시작한 사람들 모두에게 적합합니다. 전략 및 지표에는 눈에 보이지 않는 비밀 공식 및 계산 방법이 없으며 모든 전략 지표는 공개되어 있습니다. Owl Smart Lev
"Adjustable Fractals" - 프랙탈 표시기의 고급 버전으로 매우 유용한 거래 도구입니다! 우리가 알고 있듯이 표준 프랙탈 mt4 표시기에는 설정이 전혀 없습니다. 이는 거래자에게 매우 불편합니다. 조정 가능한 프랙탈(Adjustable Fractals)이 해당 문제를 해결했습니다. 필요한 모든 설정이 포함되어 있습니다. 조정 가능한 표시 기간(권장 값 - 7 이상) 고점/저점과의 거리 조절 가능 프랙탈 화살표에 따라 조정 가능한 디자인 // 더 훌륭한 전문가 자문 및 지표는 여기에서 확인할 수 있습니다: https://www.mql5.com/en/users/def1380/seller // 또한 수익성 있고 안정적이며 신뢰할 수 있는 신호 https://www.mql5.com/en/signals/1887493에 참여하실 수 있습니다. 본 MQL5 홈페이지에서만 제공되는 오리지널 제품입니다.
Trend Line Chart Pattern Signals  Is a traders Tool for Signals based on Strong  Patterns Formed By a pair of robust trend lines. They FOR WITH DIFFERENT POPULAR PATTERNS ON CHARTS LIKE – TRIANGLES, FLAGS,RANGE , ASCENDING TRIANGLES, DESCENDING PATTERNS, PENNANTS ETC. The TREND LINES  form  dynamically  on running bars. The  sensitivity  of the trend lines can be changed by custom settings. The  Buy and Sell Signals Generate upon Break Of the Trend Line + "Close" of the same bar above the previo
This is a new strategy for SUPPLY DEMAND areas It is based on a calculation using the tick volume to detect the big price action in market for both bear /bull actions this smart volume action candles are used to determine the supply and demand areas prices in between main supply and demand lines indicate sideway market  up arrows will be shown when prices moves above the main supply and the secondary supply lines Down arrows will be shown when prices moves below the main demand and the secondary
The King of Forex Trend Cloud Indicator is a trend following indicator based on moving averages. The Indicator is meant to Capture both the beginning and the end of a trend. This indicator can be used to predict both short and long terms market trends.  The king of Forex Trend Cloud if paired together with the King of Forex Trend Indicator can give a broad picture in market analysis and forecasts. I have attached images for both the  The king of Forex Trend Cloud on its own and  The king of Fore
The indicator detects and displays 3 Drives harmonic pattern (see the screenshot). The pattern is plotted by the extreme values of the ZigZag indicator (included in the resources, no need to install). After detecting the pattern, the indicator notifies of that by a pop-up window, a mobile notification and an email. The indicator highlights the process of the pattern formation and not just the complete pattern. In the former case, it is displayed in the contour triangles. After the pattern is com
Night ghost
Dmitriy Kashevich
Night Ghost - Arrow indicator for binary options. This is a reliable assistant to you in the future! - No redrawing on the chart -Works great on EUR/USD currency pairs! -Indicator accuracy up to 90% (Especially at night) -No long setup required (Perfectly set up for Binary Options) - Not late signals - The appearance of a signal on the current candle -Perfect for M1 period (No More!) - Eye-friendly candle color (Red and Blue) -Installed Alert Working with it: - Blue arrow
FX Flow
Eva Stella Conti
FX Flow   indicator can be used as an anticipator of the next trend, preferably confirmed by Price Action or another oscillator (RSi, Stochastic ..). It takes the money flows of the major currencies USD EUR GBP AUD NZD CAD CHF JPY into account, and processes them. Excellent tool for indices, but also for correlations between currencies. Works on each timeframes.  Blue line: Bull market Yellow line: Bear market Note : if the indicator opens the window, but does not draw lines, load the histo
Free automatic fibonacci
Tonny Obare
4.65 (62)
Free automatic Fibonacci is an indicator that automatically plots a Fibonacci retracement based on the number of bars you select on the BarsToScan setting in the indicator. The Fibonacci is automatically updated in real time as new highest and lowest values appears amongst the selected bars. You can select which level values to be displayed in the indicator settings. You can also select the color of the levels thus enabling the trader to be able to attach the indicator several times with differe
FREE
Veles Moment
Gennady Mazur
Индикатор iVeles_Moment представляет собой  обычный  Momentum, с пересчитанными и приведенными к нулю значениями . В отличии от обычного Momentum, наложены уровни сигнала в виде облака, что заметно расширяет области применения данного индикатора. Очень хорошо показывает разворотные моменты и циклы тенденций, может применяться как основной сигнал для входа в позицию. Параметры: period - период Momentum price - применяемая цена level - уровень облака
Super Oscillator
Harun Celik
5 (1)
Super oscillator indicator is an oscillator designed to calculate trend reversal points. A set of bar calculations and a set of algorithms to calculate trend reversals. Level probing system with high probability trends. All of these features combine to make it easier for investors to find trends. Suggestions and Features There are two levels on the super oscillator indicator. They are at levels of 0.5 and -0.5. The oscillator bar should be below -0.5 to find the upward trend. And a blue color
Trend Scanner
Vladimir Kalendzhyan
4.38 (8)
By purchasing this indicator, you have the right to receive a free copy of one of   my other indicator's or advisor’s!  (All future updates are included. No limits) . To get it , please contact me by  mql5 message ! The Trend Scanner trend line indicator displays the trend direction and its changes. The indicator works on all currency pairs and  timeframes. The indicator simultaneously displays multiple readings on the price chart: the support and resistance lines of the currency pair, the exist
Happy Trend Arrow
Muhammed Emin Ugur
This   Happy Trend Arrow   indicator is designed for signal trading. This indicator generates trend signals. It uses many algorithms and indicators to generate this signal. It tries to generate signals from the points with the highest trend potential. This indicator is a complete trading product. This indicator does not need any additional indicators. The indicator is never repainted. The point at which the signal is given does not change.       Features and Recommendations Time Fra
The Th3Eng PipFinite indicator is based on a very excellent analysis of the right trend direction with perfect custom algorithms. It show the true direction and the best point to start trading. With StopLoss point and Three Take Profit points. Also it show the right pivot of the price and small points to order to replace the dynamic support and resistance channel, Which surrounds the price. And Finally it draws a very helpful Box on the left side on the chart includes (take profits and Stop loss
Rattling Signal Point
Muhammed Emin Ugur
This   Rattling Signal Point   indicator is designed for signal trading. This indicator generates trend signals. It uses many algorithms and indicators to generate this signal. It tries to generate signals from the points with the highest trend potential. This indicator is a complete trading product. This indicator does not need any additional indicators. The indicator is never repainted. The point at which the signal is given does not change. When the signal comes the arrows are put back
Automated Trendlines
Georgios Kalomoiropoulos
5 (17)
추세선은 외환 거래에서 기술적 분석의 가장 필수적인 도구입니다. 불행히도, 대부분의 거래자는 올바르게 그리지 않습니다. 자동 추세선 표시기는 시장의 추세 움직임을 시각화하는 데 도움이 되는 진지한 거래자를 위한 전문 도구입니다. 추세선 강세 추세선과 약세 추세선에는 두 가지 유형이 있습니다. 상승 추세에서 Forex 추세선은 가격 움직임의 가장 낮은 스윙 포인트를 통해 그려집니다. 최소 두 개의 "최저 저점"을 연결하면 추세선이 생성됩니다. 하락 추세에서 추세선은 가격 움직임의 가장 높은 스윙 포인트를 통해 그려집니다. 최소 두 개의 "최고 최고점"을 연결하면 추세선이 생성됩니다. 추세선이 깨질 때? 강세 추세선은 약세 양초가 강세 추세선 아래에서 닫히고 양초의 고점이 추세선 위에 있을 때 깨집니다. 약세 추세선은 강세 양초가 약세 추세선 위로 마감되고 양초 저점이 추세선 아래에 있을 때 깨집니다. 추세선이 삭제되면? 강세 추
이 제품의 구매자들이 또한 구매함
Gann Made Easy
Oleg Rodin
4.92 (77)
Gann Made Easy 는 mr.의 이론을 사용하여 최고의 거래 원칙을 기반으로 하는 전문적이고 사용하기 쉬운 Forex 거래 시스템입니다. W.D. 간. 이 표시기는 Stop Loss 및 Take Profit Levels를 포함하여 정확한 BUY 및 SELL 신호를 제공합니다. PUSH 알림을 사용하여 이동 중에도 거래할 수 있습니다. 구매 후 연락주세요! 내 거래 팁과 훌륭한 보너스 지표를 무료로 공유하겠습니다! 아마도 Gann 거래 방법에 대해 이미 여러 번 들었을 것입니다. 일반적으로 Gann의 이론은 초보자 거래자뿐만 아니라 이미 거래 경험이 있는 사람들에게도 매우 복잡한 것입니다. Gann의 거래 방식은 이론적으로 적용하기 쉽지 않기 때문입니다. 나는 그 지식을 연마하고 Forex 지표에 최고의 원칙을 적용하기 위해 몇 년을 보냈습니다. 표시기는 적용하기가 매우 쉽습니다. 차트에 첨부하고 간단한 거래 권장 사항을 따르기만 하면 됩니다. 지표는 지속적으로 시장 분석 작업
TPSpro RFI Levels
Roman Podpora
4.85 (20)
Reversal First Impulse levels (RFI)    INSTRUCTIONS        RUS       -       ENG              R ecommended to use with an indicator   -   TREND PRO -  Version MT5 A key element in trading is zones or levels from which decisions to buy or sell a trading instrument are made. Despite attempts by major players to conceal their presence in the market, they inevitably leave traces. Our task was to learn how to identify these traces and interpret them correctly. Main functions: Displaying active zones
Enigmera
Ivan Stefanov
5 (3)
에니메라: 시장의 핵심 https://www.enigmera.com 소개 이 지표 및 트레이딩 시스템은 금융 시장에 대한 놀라운 접근 방식입니다. 에니메라는 프랙탈 주기를 사용하여 지지선과 저항선을 정확하게 계산합니다. 진정한 축적 단계를 보여주고 방향과 목표를 제시합니다.  추세에 있든 조정에 있든 작동하는 시스템입니다.  어떻게 작동하나요? 에니메라는 지지선/저항선, 목표선, 편차선의 세 가지 라인으로 구성됩니다. 이 시스템은 과거 데이터를 현재와 미래로 추정하는 일반적인 시장 지표와 달리 현재에 대한 완전한 그림을 제공합니다. 지지선 위에 있으면 실제 지지를 의미하고 저항선 위에 있으면 실제 저항을 의미합니다. 레벨이 깨지면 추세의 변화를 나타냅니다. 다시 그리지 않습니다. 시장이 지속적으로 진화함에 따라 에니메라는 평가 도구를 조정하여 전략을 정기적으로 수정합니다.   이를 통해 모든 시나리오를 철저히 평가할 수 있습니다. 이 시장 지표의 고유성은 분명하며 그 기
TPSproTREND PrO
Roman Podpora
4.78 (18)
TPSpro TRENDPRO  - is a trend indicator that automatically analyzes the market and provides information about the trend and each of its changes, as well as giving signals for entering trades without redrawing! The indicator uses each candle, analyzing them separately. referring to different impulses - up or down impulse. Exact entry points into transactions for currencies, crypto, metals, stocks, indices!  -  Version MT5               DETAILED DESCRIPTION                R ecommended to use with
Atomic Analyst
Issam Kassas
5 (3)
우선적으로 언급할 점은이 거래 지표가 다시 그리지 않고 지연되지 않으며 이를 통해 수동 및 로봇 거래 모두에 이상적이라는 점입니다. 사용자 매뉴얼: 설정, 입력 및 전략. Atomic Analyst는 가격의 강도와 모멘텀을 활용하여 시장에서 더 나은 이점을 찾는 PA Price Action Indicator입니다. 고급 필터를 장착하여 잡음과 거짓 신호를 제거하고 거래 잠재력을 높이는 데 도움이 됩니다. 복잡한 지표의 다중 레이어를 사용하여 Atomic Analyst는 차트를 스캔하고 복잡한 수학적 계산을 간단한 신호와 색상으로 변환하여 초보 트레이더가 이해하고 일관된 거래 결정을 내릴 수 있도록합니다. "Atomic Analyst"는 새로운 및 경험이 풍부한 트레이더를위한 종합적인 거래 솔루션입니다. 프리미엄 지표와 최고 수준의 기능을 하나의 거래 전략에 결합하여 모든 종류의 트레이더에 대한 다재다능한 선택지가되었습니다. 인트라데이 거래 및 스캘핑 전략 : 빠르고 정확한
Trend Punch
Mohamed Hassan
5 (14)
Manual guide:   Click here PROMO of  $65 for THIS WEEK ONLY!  -- Next price is  $120 .  This indicator is unstoppable when combined with our other indicator called  Support & Resistance . After purchase, send us a message and you will get it   for  FREE as a BONUS! I like to use Trend Punch on XAUUSD on the M1 timeframe & higher ones!  Introducing Trend Punch , the revolutionary forex trend indicator that will transform the way you trade! Trend Punch is uniquely designed to provide
Advanced Currency Strength28 Indicator
Bernhard Schweigert
4.91 (665)
현재 26% 할인 초보자 또는 전문가 트레이더를 위한 최고의 솔루션! 이 지표는 우리가 독점 기능과 새로운 공식을 통합했기 때문에 독특하고 고품질이며 저렴한 거래 도구입니다. 단 하나의 차트로 28 Forex 쌍의 통화 강도를 읽을 수 있습니다! 새로운 추세 또는 스캘핑 기회의 정확한 트리거 포인트를 정확히 찾아낼 수 있기 때문에 거래가 어떻게 개선될지 상상해 보십시오. 사용 설명서: 여기를 클릭  https://www.mql5.com/en/blogs/post/697384 그것이 첫 번째, 원본입니다! 쓸모없는 지망생 클론을 사지 마십시오. 더 스페셜  강력한 통화 모멘텀을 보여주는 하위 창의 화살표 GAP가 거래를 안내합니다! 기본 또는 호가 통화가 과매도/과매도 영역(외부 시장 피보나치 수준)에 있을 때 개별 차트의 기본 창에 경고 표시가 나타납니다. 통화 강도가 외부 범위에서 떨어질 때 풀백/반전 경고. 교차 패턴의 특별 경고 추세를 빠르게 볼 수 있는
Scalper Inside PRO
Alexey Minkov
4.74 (58)
An exclusive indicator that utilizes an innovative algorithm to swiftly and accurately determine the market trend. The indicator automatically calculates opening, closing, and profit levels, providing detailed trading statistics. With these features, you can choose the most appropriate trading instrument for the current market conditions. Additionally, you can easily integrate your own arrow indicators into Scalper Inside Pro to quickly evaluate their statistics and profitability. Scalper Inside
Advanced Supply Demand
Bernhard Schweigert
4.92 (313)
현재 33% 할인! 초보자나 전문 트레이더를 위한 최고의 솔루션! 이 보조지표는 우리가 다수의 독창적 기능과 새로운 공식을 통합한 독특하고 고품질이며 저렴한 거래 도구입니다. 이 업데이트를 통해 이중 시간대를 표시할 수 있습니다. 더 높은 TF를 표시할 수 있을 뿐만 아니라 차트 TF와 더 높은 TF 모두를 표시할 수 있습니다: 중첩 영역 표시. 모든 Supply Demand 트레이더들이 좋아할 것입니다. :) 중요한 정보 공개 Advanced Supply Demand의 잠재력을 극대화하려면 다음을 방문하십시오. https://www.mql5.com/ko/blogs/post/720245   진입 또는 목표의 명확한 트리거 포인트를 정확히 찾아냄으로 해서 거래가 어떻게 개선될지 상상해 보십시오. 새로운 알고리즘을 기반으로 매수자와 매도자 간의 잠재적인 불균형을 훨씬 더 쉽게 분간할 수 있습니다. 왜냐하면 가장 강한 공급영역과 가장 강한 수요 영역과 과거에 어떻게 진행 되었는지를(이
현재 20% 할인 ! 초보자 또는 전문가 트레이더를 위한 최고의 솔루션! 이 대시보드 소프트웨어는 28개의 통화 쌍에서 작동합니다. 2가지 주요 지표(Advanced Currency Strength 28 및 Advanced Currency Impulse)를 기반으로 합니다. 전체 Forex 시장에 대한 훌륭한 개요를 제공합니다. 고급 통화 강도 값, 통화 이동 속도 및 모든(9) 시간대의 28 Forex 쌍에 대한 신호를 보여줍니다. 추세 및/또는 스캘핑 기회를 정확히 파악하기 위해 차트의 단일 지표를 사용하여 전체 시장을 볼 수 있을 때 거래가 어떻게 개선될지 상상해 보십시오! 잠재적인 거래를 식별하고 확인하면서 강력한 통화와 약한 통화를 더욱 쉽게 식별할 수 있도록 이 지표에 기능을 내장했습니다. 이 표시기는 통화의 강세 또는 약세가 증가 또는 감소하는지 여부와 모든 시간대에서 수행되는 방식을 그래픽으로 보여줍니다. 추가된 새로운 기능은 현재 시장 조건 변화에 적
M1 Arrow
Oleg Rodin
5 (14)
시장의 두 가지 기본 원칙에 기반한 일중 전략. 알고리즘은 추가 필터를 사용하여 거래량 및 가격 파동 분석을 기반으로 합니다. 지표의 지능형 알고리즘은 두 가지 시장 요인이 하나로 결합될 때만 신호를 제공합니다. 지표는 더 높은 시간 프레임의 데이터를 사용하여 M1 차트에서 특정 범위의 파도를 계산합니다. 그리고 파동을 확인하기 위해 지표는 볼륨 분석을 사용합니다. 이 표시기는 준비된 거래 시스템입니다. 트레이더가 필요로 하는 모든 것은 신호를 따르는 것입니다. 또한 지표는 자신의 거래 시스템의 기초가 될 수 있습니다. 거래는 분 차트에서만 수행됩니다. 지표가 MTF 원리를 사용한다는 사실에도 불구하고 지표 알고리즘은 가능한 한 안정적입니다. 구매 후 반드시 저에게 편지를 보내주세요! 내 거래 설정 및 권장 사항을 공유하겠습니다!
FX Volume
Daniel Stein
4.6 (35)
모닝 브리핑을 통해 세부 정보와 스크린샷으로 매일 시장 업데이트를 받으세요 여기 mql5 및 텔레그램에서 FX 거래량은 브로커의 관점에서 시장 심리에 대한 실제 통찰력을 제공하는 최초이자 유일한 거래량 지표입니다. 브로커와 같은 기관 시장 참여자가 외환 시장에서 어떤 포지션을 취하고 있는지에 대한 훌륭한 통찰력을 COT 보고서보다 훨씬 빠르게 제공합니다. 차트에서 이 정보를 직접 확인하는 것은 트레이딩의 진정한 판도를 바꾸고 획기적인 솔루션입니다. 다음과 같은 고유한 시장 데이터 인사이트의 이점 비율 는 통화의 매수/매도 포지션 비율을 백분율로 표시 비율 변화 는 선택한 기간 내 매수 비율과 비율 변화를 표시 총 거래량 는 해당 통화의 총 거래량(롱 및 숏)을 로트 단위로 보여줍니다 Volumes Long 는 해당 통화의 모든 롱 포지션의 거래량을 보여줍니다 Volumes Short 는 해당 통화의 모든 숏 포지션의 거래량을 보여줍니다 Net Long 는 순 롱 포지션의 거래량
우선적으로, 이 거래 도구는 전문적인 거래에 이상적인 비-다시 그리기 및 지연되지 않는 지표입니다.  온라인 강좌, 사용자 매뉴얼 및 데모. 스마트 가격 액션 컨셉트 인디케이터는 신규 및 경험 많은 트레이더 모두에게 매우 강력한 도구입니다. Inner Circle Trader Analysis 및 Smart Money Concepts Trading Strategies와 같은 고급 거래 아이디어를 결합하여 20가지 이상의 유용한 지표를 하나로 결합합니다. 이 인디케이터는 스마트 머니 컨셉트에 중점을 두어 대형 기관의 거래 방식을 제공하고 이동을 예측하는 데 도움을 줍니다.  특히 유동성 분석에 뛰어나 기관이 어떻게 거래하는지 이해하는 데 도움을 줍니다. 시장 트렌드를 예측하고 가격 변동을 신중하게 분석하는 데 탁월합니다. 귀하의 거래를 기관 전략에 맞추어 시장의 동향에 대해 더 정확한 예측을 할 수 있습니다. 이 인디케이터는 시장 구조를 분석하고 중요한 주문 블록을 식별하고 다양한
Legacy of Gann
Pavel Zamoshnikov
4.83 (12)
The indicator very accurately determines the levels of the possible end of the trend and profit fixing. The method of determining levels is based on the ideas of W.D.Gann, using an algorithm developed by his follower Kirill Borovsky. Extremely high reliability of reaching levels (according to K. Borovsky  - 80-90%) Indispensable for any trading strategy – every trader needs to determine the exit point from the market! Precisely determines targets on any timeframes and any instruments (forex, met
TrendMaestro
Stefano Frisetti
5 (3)
note: this indicator is for METATRADER4, if you want the version for METATRADER5 this is the link:  https://www.mql5.com/it/market/product/108106 TRENDMAESTRO ver 2.4 TRENDMAESTRO recognizes a new TREND in the bud, he never makes mistakes. The certainty of identifying a new TREND is priceless. DESCRIPTION TRENDMAESTRO identifies a new TREND in the bud, this indicator examines the volatility, volumes and momentum to identify the moment in which there is an explosion of one or more of these data a
ON Trade Optuma Astro
Abdullah Alrai
5 (4)
물론입니다. 아래는 제공해주신 텍스트의 한국어 번역입니다: MT4용 천문학 지표 소개: 귀하의 최상급 하늘 트레이딩 동반자 트레이딩 경험을 천체의 높이로 끌어올리기 준비가 되셨나요? MT4용 천문학 지표를 소개합니다. 이 혁신적인 도구는 복잡한 알고리즘의 힘을 활용하여 탁월한 천문학적 통찰과 정밀한 계산을 제공합니다. 정보의 우주를 손에 담다: 천문학적 데이터의 보물함을 드러내는 포괄적인 패널을 살펴보세요. 행성의 지오/헬리오센트릭 좌표, 태양/지구 거리, 크기, 길이, 별자리, 황도 좌표 및 적도 좌표, 심지어 수평 좌표 등 각각이 정밀하게 계산되고 아름답게 제시됩니다. 지표에 의해 생성된 수직선은 시간 값에 해당하여 트레이딩 여정에 우주적인 시각을 부여합니다. 행성 라인과 관계: 수정 가능한 스케일과 각도로 차트를 장식하는 행성 라인의 마법을 경험해보세요. 직관적인 컨트롤 패널을 통해 각 행성의 라인의 가시성을 손쉽게 전환할 수 있습니다. 쥰션이나 섹스타일, 사분각, 삼분각, 트
맞춤형 MT4 지표로 성공적인 외환 거래에 대한 비밀을 발견하십시오! 외환 시장에서 성공을 달성하고 위험을 최소화하면서 일관되게 이익을 얻는 방법을 궁금해 한 적이 있습니까? 여기에 당신이 찾고 있던 답이 있습니다! 거래에 대한 귀하의 접근 방식을 혁신 할 독점적 MT4 지표를 소개 할 수 있습니다. 독특한 다양성 우리의 지표는 Renko 및 Rangebar Candle Formations를 선호하는 사용자를 위해 특별히 설계되었습니다. 우리는 이러한 차트 유형이 많은 숙련 된 거래자들이 선호한다는 것을 이해하기 때문에 우리의 지표가 그들과 완벽하게 통합되어 비교할 수없는 시장 분석을 제공합니다. 명확한 추세 신호 복잡한 분석을 잊어 버리십시오! 우리의 지표는 생생한 색상과 명확한 점 구조를 사용하여 시장 동향을 명확하게 나타냅니다. 빨간색과 파란색 점은 가격 이동 방향에 대해 의심의 여지가 없어 거래에서 빠른 의사 결정을 할 수 있습니다. HH/HL HL/LL
GOLD Impulse with Alert
Bernhard Schweigert
4.56 (9)
이 지표는 Advanced Currency IMPULSE with ALERT  +   Currency Strength Exotics  의 2가지 제품의 슈퍼 조합입니다. 그것은 모든 시간 프레임에 대해 작동하며 8개의 주요 통화와 하나의 기호에 대한 강약의 충동을 그래픽으로 보여줍니다! 이 표시기는 금, 이국적인 쌍, 상품, 지수 또는 선물과 같은 기호에 대한 통화 강도 가속을 표시하는 데 특화되어 있습니다. 금, 은, 오일, DAX, US30, MXN, TRY, CNH 등의 진정한 통화 강도 가속(충동 또는 속도)을 표시하기 위해 9번째 줄에 모든 기호를 추가할 수 있습니다. 새로운 기본 알고리즘을 기반으로 구축되어 잠재적인 거래를 훨씬 더 쉽게 식별하고 확인할 수 있습니다. 이는 통화의 강세 또는 약세가 가속되는지 여부를 그래픽으로 표시하고 가속 속도를 측정하기 때문입니다. 자동차의 속도계처럼 생각하면 됩니다. 가속화할 때 Forex 시장에서 동일한 일이 분명히
Advanced Currency IMPULSE with ALERT
Bernhard Schweigert
4.91 (495)
현재 31% 할인!! 초보자 또는 전문가 트레이더를 위한 최고의 솔루션! 이 지표는 우리가 독점 기능과 비밀 공식을 통합했기 때문에 독특하고 고품질이며 저렴한 거래 도구입니다. 단 하나의 차트로 28개 통화 쌍 모두에 대한 경고를 제공합니다. 새로운 추세 또는 스캘핑 기회의 정확한 트리거 포인트를 정확히 찾아낼 수 있기 때문에 거래가 어떻게 개선될지 상상해 보십시오! 새로운 기본 알고리즘을 기반으로 구축되어 잠재적인 거래를 훨씬 더 쉽게 식별하고 확인할 수 있습니다. 이는 통화의 강세 또는 약세가 가속되는지 여부를 그래픽으로 표시하고 가속 속도를 측정하기 때문입니다. 자동차의 속도계처럼 생각하면 됩니다. 가속화할 때 Forex 시장에서 동일한 일이 분명히 더 빠르게 발생합니다. 즉, 반대 방향으로 가속화되는 통화를 페어링하면 잠재적으로 수익성 있는 거래를 식별한 것입니다. 통화 모멘텀의 수직선과 화살표가 거래를 안내합니다! 역동적인 Market Fibonacci 23
Quantum Trend Sniper Indicator MT4
Bogdan Ion Puscasu
4.6 (40)
소개       Quantum Trend Sniper Indicator는   추세 반전을 식별하고 거래하는 방식을 변화시키는 획기적인 MQL5 지표입니다! 13년 이상의 거래 경험을 가진 숙련된 트레이더 팀이 개발한       Quantum Trend Sniper 표시기       매우 높은 정확도로 추세 반전을 식별하는 혁신적인 방법으로 거래 여정을 새로운 차원으로 끌어올리도록 설계되었습니다. ***Quantum Trend Sniper Indicator를 구입하면 Quantum Breakout Indicator를 무료로 받을 수 있습니다!*** Quantum Trend Sniper Indicator는 추세 반전을 식별하고 세 가지 이익실현 수준을 제안할 때 경고, 신호 화살표를 제공합니다. 초보자 거래자와 전문 거래자 모두에게 적합합니다. Quantum EA 채널:       여기를 클릭하세요 MT5 버전:       여기를 클릭하세요
FX Power MT4 NG
Daniel Stein
5 (11)
모닝 브리핑 여기 mql5 와 텔레그램에서 FX Power MT4 NG 는 오랫동안 인기 있는 통화 강도 측정기인 FX Power의 차세대 버전입니다. 이 차세대 강도 측정기는 무엇을 제공합니까? 기존 FX Power에서 좋아했던 모든 것 PLUS GOLD/XAU 강도 분석 더욱 정밀한 계산 결과 개별 구성 가능한 분석 기간 더 나은 성능을 위한 사용자 정의 가능한 계산 한도 특별 멀티더 많은 것을보고 싶은 사람들을위한 특별한 다중 인스턴스 설정 모든 차트에서 좋아하는 색상을위한 끝없는 그래픽 설정 수많은 알림 옵션, 중요한 것을 다시는 놓치지 않도록 Windows 11 및 macOS 스타일의 둥근 모서리가 있는 새로운 디자인 마법처럼 움직이는 인디케이터 패널 FX 파워 키 특징 모든 주요 통화의 완전한 강세 이력 모든 시간대에 걸친 통화 강세 이력 모든 브로커 및 차트에서 고유 계산 결과 100% 신뢰할 수있는 실시간100 % 신뢰할 수있는 실시간 계산-> 다시 칠하지 않음
PRO Renko System
Oleg Rodin
5 (25)
PRO Renko System 은 RENKO 차트 거래를 위해 특별히 고안된 매우 정확한 거래 시스템입니다. 이것은 다양한 거래 상품에 적용될 수있는 보편적 인 시스템입니다. 체계는 효과적으로 당신에게 정확한 반전 신호에 접근을 주는 소위 시장 소음을 중화합니다. 이 표시기는 사용하기가 매우 쉽고 신호 생성을 담당하는 매개 변수가 하나만 있습니다. 당신은 쉽게 당신의 선택의 어떤 무역 계기에 공구를 적응시킬 수 있고 renko 막대기의 크기. 나는 항상 당신이 내 소프트웨어로 수익성있게 거래 할 수 있도록 추가 지원을 제공 할 준비가되어 있습니다! 나는 당신에게 행복하고 수익성있는 거래를 기원합니다! 구매 후 저에게 연락하십시오! 내 렌코 차트 생성기를 보내드립니다. 또한 내 개인 권장 사항 및 시스템의 다른 모듈을 무료로 공유 할 것입니다!
Currency Strength Wizard
Oleg Rodin
4.91 (45)
통화 강도 마법사는 성공적인 거래를 위한 올인원 솔루션을 제공하는 매우 강력한 지표입니다. 표시기는 여러 시간 프레임의 모든 통화 데이터를 사용하여 이 또는 해당 외환 쌍의 힘을 계산합니다. 이 데이터는 특정 통화의 힘을 확인하는 데 사용할 수 있는 사용하기 쉬운 통화 지수 및 통화 전력선의 형태로 표시됩니다. 필요한 것은 거래하려는 차트에 표시기를 부착하는 것뿐입니다. 표시기는 거래하는 통화의 실제 강세를 보여줍니다. 지표는 또한 추세와 거래할 때 유리하게 사용할 수 있는 구매 및 판매 거래량 압력의 극한값을 보여줍니다. 지표는 또한 피보나치에 기반한 가능한 대상을 보여줍니다. 표시기는 PUSH 알림을 포함한 모든 유형의 알림을 제공합니다. 구매 후 연락주세요. 나는 당신과 거래 팁을 공유하고 당신에게 무료로 훌륭한 보너스 지표를 줄 것입니다! 나는 당신에게 행복하고 유익한 거래를 기원합니다!
Currency Strength Exotics
Bernhard Schweigert
4.88 (33)
현재 20% 할인! 초보자 또는 전문가 트레이더를 위한 최고의 솔루션! 이 표시기는 Exotic Pairs Commodities, Indexes 또는 Futures와 같은 기호에 대한 통화 강도를 표시하는 데 특화되어 있습니다. 금, 은, 석유, DAX, US30, MXN, TRY, CNH 등의 진정한 통화 강도를 보여주기 위해 9번째 줄에 모든 기호를 추가할 수 있습니다. 이것은 독특하고 고품질이며 저렴한 거래 도구입니다. 우리는 많은 독점 기능과 새로운 공식을 통합했습니다. 새로운 추세 또는 스캘핑 기회의 정확한 트리거 포인트를 정확히 찾아낼 수 있기 때문에 거래가 어떻게 개선될지 상상해 보십시오. 사용 설명서: 여기를 클릭 https://www.mql5.com/en/blogs/post/708876 모든 시간대에 작동합니다. TREND를 빠르게 확인할 수 있습니다! 새로운 기본 알고리즘을 기반으로 설계되어 잠재적인 거래를 더욱 쉽게 식별하고 확인할 수 있습니다.
The indicator " ZigZag on Trend " is an assistant in determining the direction of price movement, as well as a calculator of bars and points. It consists of a trend indicator, which follows the price direction by the trend line presented in the form of a zigzag and a counter calculating the number of bars traversed in the direction of the trend and the number of points on the vertical scale. (calculations are carried out by the opening of the bar) The indicator does not redraw. For convenience,
Scalper Vault
Oleg Rodin
5 (29)
Scalper Vault 는 성공적인 스캘핑에 필요한 모든 것을 제공하는 전문 스캘핑 시스템입니다. 이 표시기는 외환 및 바이너리 옵션 거래자가 사용할 수 있는 완전한 거래 시스템입니다. 권장 시간 프레임은 M5입니다. 시스템은 추세 방향으로 정확한 화살표 신호를 제공합니다. 또한 상단 및 하단 신호와 Gann 시장 수준을 제공합니다.  이 시스템은 사용하기가 매우 쉽습니다. 원하는 시장 지역의 화살표만 따라가면 됩니다. 엑시트는 가격이 적정 수준에 도달하거나 시장의 고점 또는 저점 신호가 나타날 때 수행됩니다.  표시기는 PUSH 알림을 포함한 모든 유형의 경고를 제공합니다. 인디케이터 구매 후 연락주세요. 내 개인 거래 권장 사항과 훌륭한 보너스 지표를 무료로 공유합니다! 나는 당신에게 행복하고 유익한 거래를 기원합니다!
ICT, SMC, SMART MONEY CONCEPTS, SMART MONEY, Smart Money Concept, Support and Resistance, Trend Analysis, Price Action, Market Structure, Order Blocks, BOS/CHoCH,   Breaker Blocks ,  Momentum Shift,   Supply&Demand Zone/Order Blocks , Strong Imbalance, HH/LL/HL/LH,    Fair Value Gap, FVG,  Premium  &   Discount   Zones, Fibonacci Retracement, OTE, Buy Side Liquidity, Sell Side Liquidity, BSL/SSL Taken, Equal Highs & Lows, MTF Dashboard, Multiple Time Frame, BigBar, HTF OB, HTF Market Structure, 
TakePropips Donchian Trend Pro
Eric John Pajarillaga Aldana
4.82 (17)
TakePropips Donchian Trend Pro   (MT4)는 Donchian 채널을 사용하여 추세의 방향을 자동으로 감지하고 진입 및 퇴장 거래 신호를 제공하는 강력하고 효과적인 도구입니다! 이 다기능 지표에는 추세 스캐너, 거래 신호, 통계 패널, 스크리너, 거래 세션 및 경고 내역 대시보드가 포함됩니다. 거래 신호를 제공하고 차트 분석 시간을 절약하도록 설계되었습니다! 다음 블로그 게시물에서 사용자 설명서 및 설치 가이드를 다운로드할 수 있습니다.   https://www.mql5.com/en/blogs/post/751368 오늘 50% 할인을 받으세요! 가격이 $98에서 $49로 인하되었습니다! 전략 테스터에서 이 지표를 테스트할 수 있습니다(비주얼 모드 활성화).  자세한 내용은 설명 아래에 비디오 자습서도 제공됩니다. 질문이 있거나 도움이 필요하면 저에게 연락하십시오. TakePropips Donchian Trend Pro 지표는 모든 Forex 쌍, 금속
How to use Pair Trading Station Pair Trading Station is recommended for H1 time frame and you can use it for any currency pairs. To generate buy and sell signal, follow few steps below to apply Pair Trading Station to your MetaTrader terminal. When you load Pair Trading Station on your chart, Pair Trading station will assess available historical data in your MetaTrader platforms for each currency pair. On your chart, the amount of historical data available will be displayed for each currency pai
ECM Channel MT4
Paulo Rocha
5 (1)
ECM Elite Channel is a volatility-based indicator, developed with a specific time algorithm, which consists of finding possible corrections in the market. This indicator shows two outer lines, an inner line (retracement line) and an arrow sign, where the channel theory is to help identify overbought and oversold conditions in the market. The market price will generally fall between the boundaries of the channel. If prices touch or move outside the channel, it's a trading opportunity. The
제작자의 제품 더 보기
True Direction Oscillator
Muhammad Elbermawi
4.89 (493)
또는 (TDO) "순수 모멘텀 "의 원리를 사용하여 가격 변화율을 측정하는 지수입니다. 유가 증권 가격이 10에서 15로 상승하면 가격 변동률은 150%이지만 15에서 10으로 다시 하락하면 가격 변동률은 33.3%에 불과합니다. 이것이 "가격 변화율"(ROC) 또는 "모멘텀"과 같은 기술적 분석 지표가 내림차순에 제공된 것보다 상승하는 가격 움직임에 대해 더 높은 수치를 제공하는 이유입니다. TDO는 트레이더가 모멘텀을 올바르게 읽을 수 있도록 이 문제를 수정합니다. 중요한 정보 TDO 사용자 매뉴얼: https://www.mql5.com/en/blogs/post/717970 TDO FAQ : https://www.mql5.com/en/blogs/post/722015 TDO 비디오 라이브러리: https://www.mql5.com/en/blogs/post/722018 TDO 전문가 고문 예: https://www.mql5.com/en/blogs/post/731141
Bermaui Pin Bars
Muhammad Elbermawi
5 (22)
버마우이 핀 바 또는 (BPB)는 차트에서 핀 바 가격 행동 패턴을 찾는 지표입니다. Pin Bars는 Hammer, Inverted-Hammer, Hanging Man, 슈팅 스타, Dragon Fly Doji 또는 Grave Stone Doji와 같이 높이가 높거나 낮은 그림자와 매우 작은 몸체를 가진 일본 촛대의 대안인 고전적인 바 패턴인 "Pinocchio Bars"의 지름길입니다. . Bermaui Pin Bars 표시기는 다음 단계에서 설명할 수 있는 공식에 따라 이 패턴을 찾습니다. 처음에 BPB는 양초 몸체의 중심을 계산합니다( = [Open + Close] / 2). 그런 다음 BPB는 몸체 중심과 촛불 사이의 거리를 낮게 찾습니다. 마지막 단계는 2단계 결과를 양초 범위로 나누는 것입니다. 양초 본체 중심이 양초의 고점 또는 저점에 너무 가까우면 BPB가 핀 막대 패턴을 감지하고 사용자에게 경고합니다. 버마우이 핀 바 공식 : https://www.mql5.
Bermaui Bands
Muhammad Elbermawi
4.94 (89)
Bermaui Bands(BB)는 범위 및 추세 가격 움직임 사이를 필터링하는 데 도움이 되는 기술 분석 도구입니다. 이 지표의 이면에 있는 아이디어는 다음 단계에서 설명할 수 있습니다. 표준 편차를 0과 100 사이에서 이동하는 오실레이터로 계산합니다. 나는 그것을 Bermaui Deviation 퍼센트(BD %)라고 명명하겠습니다. "BD %"가 0에 가까우면 변동성이 극심합니다. 또한 "BD %"가 100에 가까우면 변동성이 매우 낮습니다. 높은 변동성은 추세 시장에 대한 큰 가능성을 의미하고 낮은 변동성은 횡보 또는 범위 시장을 의미합니다. 중간선은 표준편차가 SMA에 따라 계산되기 때문에 단순 이동 평균(SMA)입니다. Upper Bermaui Band를 얻으려면 계산에서 동일한 수의 막대를 사용하여 단순 이동 평균에 "BD %"를 추가하십시오. The Lower Bermaui Bands를 얻으려면 계산에서 동일한 수의 막대가 있는 단순 이동 평균에서 "BD %"를 빼십시오
BACD Cloud
Muhammad Elbermawi
4.57 (7)
또는 백분율의 방송 추세 방향 및 강도를 측정하는 발진기이며 B ermaui verage C D onvergence ivergence 구름. BACD 클라우드 계산은 다음과 같습니다. 1- 두 개의 지수 이동 평균을 계산합니다. 그들 중 하나는 다른 것보다 빠릅니다. 나는 첫 번째(빠르게)와 두 번째(느림)라고 부를게 2- 그들 사이의 중심을 찾으십시오. 여기서 Center MA = (빠른 + 느린) / 2 3- 다음과 같이 BACD 선을 계산합니다. BACD = 100 * (빠른 / 중앙 MA) 4- BACD의 지수 이동 평균인 BACD 신호선을 계산합니다. 공식은 다음과 같습니다. BACD 신호 = EMA(BACD) 5- 차트에서 BACD 신호 라인을 숨깁니다. 6- BACD 라인과 신호 라인 간의 차이인 BACD 히스토그램 라인을 계산합니다. (참고: BACD 히스토그램은 차트에 히스토그램이 아닌 선으로 그려집니다.) 7- (BACD 선 > BA
Moving Average Cloud
Muhammad Elbermawi
4.93 (14)
또는 "맥". 이것은 추세를 포착하고 거래하는 데 도움이 되도록 설계된 지표입니다. 이 지표의 이면에 있는 아이디어는 다음 단계에서 설명할 수 있습니다. 빠르게 움직이는 평균 봉투를 그립니다. 느리게 움직이는 평균 봉투를 그립니다. MAC Upper Band는 두 Envelopes의 high 사이의 가장 높은 값입니다. MAC Lower Band는 두 Envelope의 낮은 값 사이의 가장 낮은 값입니다. MAC 히스토그램 클라우드는 방향 변화를 보여주기 위해 두 밴드 사이의 거리를 채웁니다. Blue Cloud는 상승 추세를 나타내고 Red Cloud는 하락 추세를 나타냅니다. MAC 버퍼를 사용하여 자신의 EA 또는 스캐너를 구축하는 방법을 보려면 다음 블로그를 읽으십시오. https://www.mql5.com/en/blogs/post/734293 MAC 사용 방법 MAC 클라우드를 필터로 사용하여 추세 방향을 식별하는 데 도움이 됩니다. 가능한 한 잘못된
Bermaui Deviation Percent
Muhammad Elbermawi
4.94 (129)
또는 ( BD% )는 변동성을 포인트가 아닌 백분율로 측정하는 변동성 지수입니다. BD%의 개념은 0에서 100% 사이에서 움직이는 고전 표준 편차(CSD)에 따라 인덱스를 만드는 것입니다. BD%를 사용하여 다른 기간 또는 다른 기간의 동일한 증권에 대한 변동성을 비교할 수 있습니다. 또한 BD%를 사용하여 포인트가 아닌 백분율로 서로 다른 시장의 서로 다른 증권 간의 변동성을 비교할 수 있습니다. "BD%" 사용 방법 BD%가 90% 미만에서 이 수준을 상향 돌파하면 가격이 범위 내에서 움직일 수 있다는 신호입니다. BD%가 90%를 넘어 이 수준을 하향 돌파하고 가격이 이미 단순 이동 평균 위에 있다면 이는 새로운 상승 추세의 시작을 알리는 신호입니다. BD%가 하락세로 갈수록 변동성과 추세 강도가 증가하고 있습니다. BD%가 0%이면 변동성이 가장 높은 값에 있음을 의미합니다. BD%가 90%를 넘어 이 수준을 하향 돌파하고 가격이 이미 단순 이동 평균 아래
Bermaui Channel
Muhammad Elbermawi
5 (27)
This is a price channel that shows five important price levels on the chart. Those levels are: 1. The Highest High (HH) of the previous x bars. 2. The Highest Low (HL) of the previous x bars. 3. The Center Line. 4. The Lowest High (LH) of the previous x bars. 5. The Lowest Low (LL) of the previous x bars. How does Bermaui Channels Captures Overbought  area Think of the distance between HH and HL levels as an overbought area. When the price candles or bars crosses the HL to the upside this
Bermaui Manual EA
Muhammad Elbermawi
5 (10)
그리드 시스템을 거래하는 반자동 전문 고문입니다. 아이디어는 시장에서 점차적으로 다른 포지션을 취한 다음 손익분기점 수준을 계산하는 것입니다. 가격이 미리 결정된 거리만큼 이 손익분기점을 지나면 모든 열린 주문이 마감됩니다. 중요한 정보 다음은 사용자 가이드입니다.   https://www.mql5.com/en/blogs/post/730567 내 다른 제품과 함께 이 EA를 사용해 볼 수 있습니다. https://www.mql5.com/en/users/bermaui314/seller 중요한 기능 EA는 예상치 못한 결과로부터 거래된 자본을 보호하기 위한 손절매 메커니즘을 가지고 있습니다. EURUSD - XAUUSD - 석유 - 비트코인과 같은 모든 MT4 기호를 거래할 수 있습니다. 모든 MT4 기간을 거래할 수 있습니다. VPS에서 EA를 실행하는 것이 좋습니다. 매개변수 및 기본 설정 1) 자금 관리 설정 시작 로트. 레버리지가 1:400 이상인 경
Classic Keltner Channel
Muhammad Elbermawi
4.9 (40)
또는 CKC. 이 지표는 Chester W. Keltner(1909–1998)가 설명한 고전적인 10일 이동 평균 규칙에 따라 작동합니다. 모든 매개변수는 기본적으로 Keltner 시스템의 클래식 버전으로 설정되며 사용자가 원하는 경우 변경할 수 있습니다. 중요한 정보 CKC 매뉴얼 읽기: https://www.mql5.com/en/blogs/post/736577 CKC 전문가 고문 예: https://www.mql5.com/en/blogs/post/734150 Keltner 채널 공식 정보 1. 표준가(= (고가 + 저가 + 종가) / 3)에서 단순 이동 평균으로 중심선을 계산합니다. 2. 고가와 저가의 평균 차이인 ADR(Average Daily Range)을 중심선에 대해 동일한 기간 및 계산 방법으로 계산합니다. 3. Keltner 매수 라인 = 센터 라인 + ADR. 4. Keltner 판매 라인 = 센터 라인 – ADR. Keltner 10일 이동 평균
Dual Bermaui Deviation Percent
Muhammad Elbermawi
5 (13)
Or DBD%. The indicator consists of colored tape that shows trading signals depending on two Bermaui Deviation Oscillator (BD%) and two moving averages. Bermaui Deviation Percent is a volatility index that measures volatility in percent rather than points. The idea of BD% is to make an index depending on Classic Standard Deviation (CSD) that moves between 0 and 100 percent. Important Information DBD% expert advisor example:  https://www.mql5.com/en/blogs/post/731145 If you want to know mor
Bermaui RSI Candles
Muhammad Elbermawi
5 (7)
이 지표의 아이디어는 매수 및 매도 신호를 생성하기 위해 가격 차트와 비교할 수 있는 양초 형태로 RSI를 그리는 것입니다. 지표는 내 발명품이 아닙니다. 나는 몇 년 전에 인터넷에서 그것을 설립했습니다. 코드를 업데이트하고 경고 기능을 추가했으며 Bermaui Utilities 도구 그룹을 추가했습니다. 표시기는 촛대를 그리는 데 사용되는 모든 가격의 RSI(시가, 고가, 저가 및 종가의 RSI)를 계산합니다. RSI 양초 높은 심지를 그리기 위해 가장 높은 값을 사용하고 RSI 양초 낮은 심지를 그리는 데 가장 낮은 값을 사용합니다. RSI 양초의 몸체는 고점과 저점 사이에 있습니다. 시가의 RSI가 종가의 RSI보다 낮으면 RSI 양초가 강세로 간주됩니다. 시가의 RSI가 종가의 RSI보다 높으면 RSI 캔들은 약세로 간주됩니다. 사용 방법 RSI 양초 지표에서 추세선 브레이크아웃을 거래할 수 있으며, 이는 모멘텀이 가격을 앞서기 때문에 가격 차트의 추세를 이끌 것입니다.
Horus EA
Muhammad Elbermawi
3.67 (3)
MT4용 호루스 EA 수천 년 전 고대 이집트인들은 토지를 측정하고 상품의 무게를 재는 데 사용하는 계수 시스템을 발명했습니다. 이 시스템은 " 호루스의 눈 "으로 알려졌습니다. 호루스의 눈은 오시리스 신의 신화와 관련이 있으며 파라오의 신성한 상징 중 하나가 되었습니다. 저는 피보나치 수열과 함께 Eye of Horus의 수학 방정식을 사용하여 유명한 "Martingale System"보다 89% 안전한 네거티브 진행 자금 관리 시스템을 구축했습니다. EA의 기술적인 부분은 이동 평균 클라우드(MAC) 및 스토캐스틱 오실레이터에 의존합니다. MAC 확률론적 기술적 분석 시스템은 어떻게 작동합니까? 1- 이동 평균 구름(MAC)이 강세라면 EA는 스토캐스틱 오실레이터가 아래에서 과매도 수준을 넘을 때 매수 주문을 받습니다. 2- 이동 평균 클라우드(MAC)가 약세라면 스토캐스틱 오실레이터가 위에서부터 과매수 수준을 넘어설 때 EA는 매도 주문을 받습니다. EA 중
필터:
greatgalib18
93
greatgalib18 2024.06.12 22:17 
 

Complete trash. Please refund my money. Thanks.

Muhammad Elbermawi
52299
개발자의 답변 Muhammad Elbermawi 2024.06.17 23:25
You can cancel your purchase from your payments.
ovno27
109
ovno27 2024.04.07 09:06 
 

Very good Indicator! I use it together with TDO and BD%

Sean Lim
86
Sean Lim 2023.01.12 16:08 
 

I just tested with TDO indicator, this indicator make a decision for entry.

Muhammad Elbermawi
52299
개발자의 답변 Muhammad Elbermawi 2023.01.12 16:20
First review in 2023 ... Thanks 🙏💚
Mert Kurt
308
Mert Kurt 2022.06.05 22:28 
 

Useful product , i can follow the market with the alarm easily right now, thanks Muhammed Elbermawi

Muhammad Elbermawi
52299
개발자의 답변 Muhammad Elbermawi 2022.06.06 08:03
Thanks for the great review and stars, Ismet 🙏💚
NIKO TORI
806
NIKO TORI 2022.01.08 20:07 
 

I tried demo version first, which made big impression so i decided to rent it for a month. I tried many bands, channel, etc. indicators, but this is the first ever i bought, so that tells something. Anyway i will give update after a month of trading live.

jabautista
3050
jabautista 2021.12.23 18:29 
 

The best bands indicator I have used.

Muhammad Elbermawi
52299
개발자의 답변 Muhammad Elbermawi 2021.12.23 18:38
Thanks for the great review and stars 🙏💚
宏安 顏
75
宏安 顏 2021.07.30 12:02 
 

very nice

Muhammad Elbermawi
52299
개발자의 답변 Muhammad Elbermawi 2021.08.06 21:48
Thanks for the great review and stars 🙏💚
You can join my telegram group from here:
https://t.me/BermauiChannel
Adil
455
Adil 2021.07.09 11:03 
 

사용자가 평가에 대한 코멘트를 남기지 않았습니다

TheFXChamp
366
TheFXChamp 2021.04.18 09:14 
 

Awesome indicator it helps identify ranging low volatile markets Oversold/overbought when price hit the bands pullbacks in trending markets works well with the deviation channel too plus it don't use alot of my computer's processing power. Great job

Deepan Kalaiselvan
231
Deepan Kalaiselvan 2021.04.13 04:29 
 

Nice indicator and can be used for reversal trades from SR LEVELS

RayGold
61
RayGold 2020.10.24 13:54 
 

It's a new way to trade. Will be testing this promising indicator.

Malcolm David Parker
475
Malcolm David Parker 2020.08.01 17:48 
 

very nice

James Wioos
412
James Wioos 2020.06.21 23:33 
 

Thanks to Muhammad the Author of the MASR Bands indicator, I am using it and it provides accurate data. I definitely recommend the indicator for any Trader that uses Support and Resistance strategy, the indicator also provides a buy or sell Arrow Alert, very useful for the new traders or experienced traders.

리뷰 답변
버전 2.0 2020.03.17
Added a buffer for Signals to make it easy for developers to use the indicator in building expert advisors.

The new buffer is no. [ 11 ]. It is called "Arrows".

It works Like this:

1) If Arrows = +1 then buy
2) If Arrows = -1 then Sell

------------------------------------------
Enhanced the alert messages.

------------------------------------------
Enhanced the arrows code.

------------------------------------------
Note:
I didn't make any changes to the basic formula. It is still the same.
버전 1.1 2019.11.17
I fixed a small error in the arrow tooltip object property.