• 미리보기
  • 리뷰
  • 코멘트

ClearArrows MT5

For any trader, the result of market analysis is the correct determination of entry and exit points from the market. The ClearArrows indicator does not display any unnecessary information that may distract or mislead the trader, but only the most important thing. The 
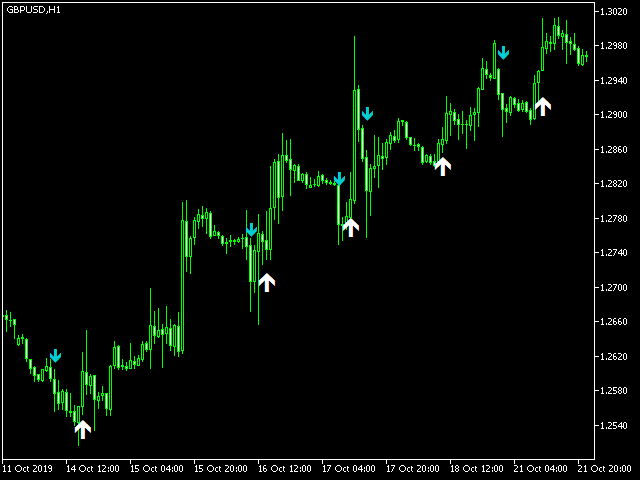
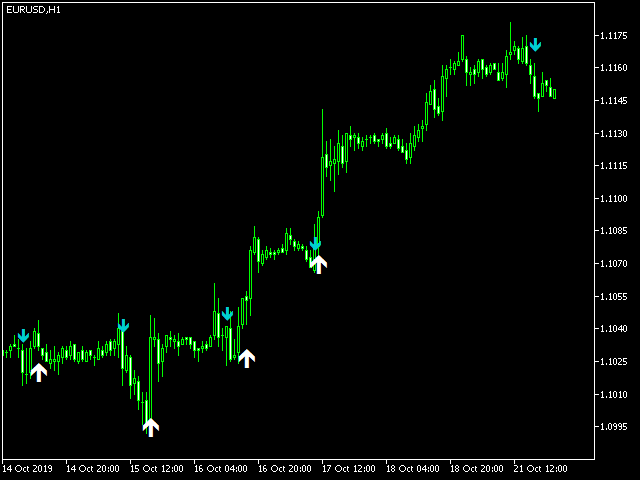
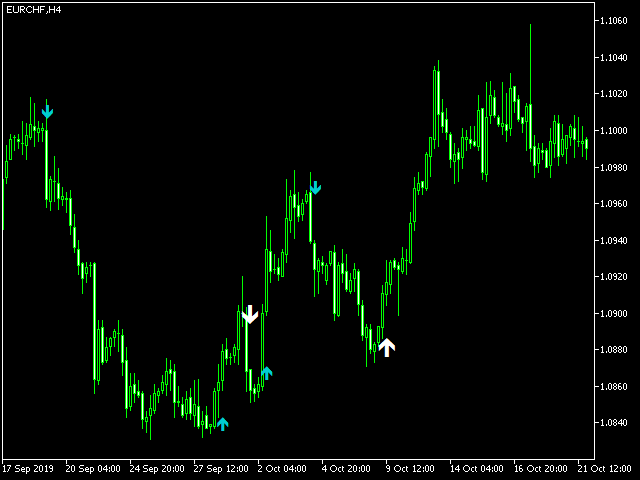
indicator is very easy to use, when a down arrow appears, you need to open a SELL deal, when an up arrow appears you need to open a BUY deal.

The ClearArrows indicator, despite its outward simplicity, has a large analytical algorithm, thanks to which it performs its work most efficiently.

The indicator gives 2 types of signals - confirmed and not confirmed. A confirmed signal is a big arrow in white - a signal that goes in accordance with the global trend, not confirmed - a small arrow - a signal that goes against the global trend. Each user can choose for themselves a trading mode - use all indicator signals or only those that go in accordance with the global trend.

This indicator does not redraw, it gives signals on the current bar. If the arrow appeared, then it will not disappear anywhere, regardless of the development of the market situation.

The indicator can be used for scalping and for binary options, you need to select the FilterPeriod parameter according to your strategy.

Indicator Inputs:

  • period - indicator sensitivity (the higher, the less signals)
  • UseFilter - whether to use a signal filter to match the global trend
  • FilterPeriod - global filter parameter (indicates how much to filter signals) (with UseFilter = true)
  • EnableAlerts - Enable / disable the sound alert when a signal appears
  • EmailAlert - Enable / disable email notification when a signal appears
  • MobileAlert - Enable / disable push notification when a signal appears


추천 제품
EA Thomas MT5
Vitali Vasilenka
4.32 (19)
거래자 주목 - 구매 후 선물을 받으시려면 개인 메시지를 보내주세요! 구매 후 받게 되는 것: 지시자 트레이딩 패널 VIP 채팅에 액세스 신호를 사용하여 채널에 한 달 동안 액세스합니다. 독특한 설정 EA Thomas 는 5명의 트레이딩 어드바이저와의 동시 작업을 포함하여 포괄적인 접근 방식으로 시장에서 두각을 나타내는 독특한 트레이딩 알고리즘입니다. 다중 자문가: EA Thomas는 각기 다른 시장 상황에 최적화된 5개의 트레이딩 자문가를 통합합니다. 이를 통해 알고리즘은 다양한 추세와 변동성에 더욱 유연하고 적응할 수 있습니다. 전략의 다각화: 5명의 자문가는 각각 추세, 역추세, 이동 평균 등과 같은 고유한 거래 전략을 사용합니다. 전략을 다양화하면 위험을 줄이고 다양한 시장 시나리오에서 성공적인 거래 가능성을 높일 수 있습니다. 매개변수 최적화: 알고리즘에는 각 권고자에 대한 매개변수를 최적화하기 위한 메커니즘이 포함되어 있습니다. 이를 통해 현재 시장 상황에 따라 매개변수
- This is an indicator of directional movement that allows you to determine the trend at the time of its inception and set the levels of a protective stop. Trailing can be carried out both from below, when the stop level is below the current price and is pulled up behind the price if it increases, and above, when stop levels are above the current price. Unlike trailing with a constant distance, the stop level is set at the lower boundary of the quadratic regression channel (in the case of t
Trade Area
Jinsong Zhang
Most time the market is in a small oscillation amplitude. The Trade Area indicator helps users to recognize that time. There are 5 lines in this indicator: Area_high, Area_middle, Area_Low, SL_high and SL_low. Recommendations: When price is between Area_high and Area_Low, it's time to trade. Buy at Area_Low level and sell at Area_high level. The SL_high and SL_low lines are the levels for Stop Loss. Change the Deviations parameter to adjust SL_high and SL_low.
RSImaxmin
Carlos Andrés Moya Erazo
4.5 (10)
The indicator shows when there are overprice and divergences on the RSI. In addition, it has configurable alerts, dynamic overprice levels and a special “RSI cleaner” function. The indicator that automatically calculates the premium rates! RSImaxmin is an indicator based on the Relative Strength Index (RSI) oscillator that effectively identifies changes in price trends as it reflects the relative strength of bullish movements compared to bearish movements. It is widely used by traders to measur
Breakeven Line V2
Hoai Phuong Tran
Breakeven Line v2 Indicator   is a MetaTrader indicator that calculates breakeven level based on all open positions and displays it on your chart as a horizontal line. Additionally, it will calculate the total number trades, the total number of lots, and the distance to the breakeven line in points and profit/loss. The indicator is available for both MT5. Why use Breakeven Line Indicator? When you have multiple trades opened on a single symbol, it can be difficult to tell where your average ent
ADAM for FTMO 5
Vyacheslav Izvarin
5 (1)
ADAM EA Special Version for FTMO Please find new Version here  https://www.mql5.com/en/market/product/113326 Our 1st EA created using ChatGPT technology Trade only GOOD and checked PROP FIRMS  Default parameters for Challenge $100,000 Tested on EURUSD and GBPUSD only  Use 15MIN Time Frame Close all deals and Auto-trading  before Weekend at 12:00 GMT+3  Friday For Prop Firms MUST use special Protector  https://www.mql5.com/en/market/product/94362 ------------------------------------------------
IVolX 2 DPOC mt5
Denis Chebatarev
Vol 2 DPOC volume vol 2 DOC-dynamic horizontal volume indicator for any time periods Main settings of the indicator: Volume Source -selecting data for volumes (tick or real) DPOCOn -enabling / disabling the indicator DPOCFrom -calculation start date DPOCTo -settlement end date The indicator allows you to manually select areas on the chart to analyze changes in the maximum volume over time. You can do this by using vertical lines and moving them along the chart. Or by setting specific dates
News Clock
Victor Klenov
The professional browser of News and Trading Sessions is now available in MetaTrader 5. Now all the most important market information is collected on one dial! News located on the Time scale. Planning your working time has never been so easy and convenient ... The news scale can be switched a day, two, a week, a month forward or backward (see the details in the short video). All news updates in real time. Thanks to the built-in filters, you can configure the display of news by importance,
Sync In Many Ways MT5
Sa No Tsuyoshi Kokorozashi
Description This is a Utility tool for MT5 which will make our chart analysis task quite more efficient and save large amount of time. As for chart analysis, some are watching out several symbol simultaneously with single timeframe and others are trading only one single pair with   multi timeframe analysis. For both, a common troublesome issue is “scroll chart to look back” or “draw chart objects” in multi charts at the same time.  Especially for those who are trading with multi timeframe soluti
Channel Scanner MT5
Reza Aghajanpour
5 (1)
**   All Symbols   x   All Timeframes   scan just by pressing scanner button ** *** Contact me  to send you instruction and add you in "Channel Scanner group" for sharing or seeing experiences with other users. Introduction: The Channel pattern is described as the area located between two trend lines. This area is used for a measure of a trading range. In this case, the upper trend line connects price highs while the lower trend line connects price lows. Also when it comes to breakout points, it
The Beta index, also known as the Beta indicator, is one of the key reference indicators for hedging institutions. It allows you to measure the relative risk of individual assets, such as currencies and commodities, in comparison to market portfolios, cross-currency pairs, the U.S. dollar index, and stock indices. By understanding how your assets perform in relation to market benchmarks, you will have a clearer understanding of your investment risk. Key Features: Accurate Risk Assessment: The Be
Big Players Last Fight
Flavio Javier Jarabeck
5 (2)
A very useful Price Action point is the previous day Closing VWAP. We call it Big Players Last Fight . This indicator will draw a line showing on your chart what was the last VWAP price of the previous trading session. Simple and effective. As an additional bonus, this indicator saves the VWAP value on the Public Terminal Variables, so you EA could read easily its value! Just for the "Prefix + Symbol name" on the variables list and you will see! SETTINGS How many past days back do you want to
FREE
RSIScalperPro
PATRICK WENNING
RSIScalperPro를 소개합니다 - 메타트레이더 5용 RSI 기반의 혁신적인 인디케이터로, 1분 차트에서의 스캘핑에 최적화되어 있습니다! RSIScalperPro를 사용하면 정확한 진입 및 청산 신호를 제공하는 강력한 도구를 손에 넣을 수 있습니다. RSIScalperPro는 서로 다른 두 가지 RSI 지표를 사용하여 과매수 및 과매도 레벨에 대한 명확한 신호를 제공합니다. 2개의 RSI의 시간 프레임 및 제한 값을 원하는 대로 조정하여 트레이딩 전략에 최적화된 결과를 얻을 수 있습니다. 차트 상의 개별 화살표는 거래 진입 및 청산 타이밍을 쉽게 파악하는 데 도움이 됩니다. 또한 RSIScalperPro의 특징 중 하나는 사용자 정의 가능한 3개의 이동 평균선입니다. 이를 통해 트렌드의 방향을 판단하고 강력한 거래 신호를 확인하는 데 도움이 됩니다. 이를 통해 조기에 트렌드를 감지하고 수익성 높은 거래에 참여할 수 있습니다. 뿐만 아니라 RSIScalperPro는 새로운 거래
Topos Fundos
Edson Cavalca Junior
The robot opens positions from Tops and Bottoms Perform trend reversal operations. It has 3 levels of top and bottom measurement. Trader can open and close position on 3 strength signals. The expert also allows you to configure the maximum loss to move along with the price (moving stop). Know our products    Edson Cavalca Junior Systems Analyst WARNINGS The buyer declares himself capable of: We do not provide any trading or risk management advice, ideal configurat
This Indicator adding power to traditional zigzag indicator. With High-Low numbers in vision it will be easier to estimate change of trend by knowing the depth of each wave. Information including points, pips, percentage%, and #bars can be displayed based on configuration. All information is real-time update. This indicator is especially useful in sideway market to buy low sell high.
XFlow
Maxim Kuznetsov
XFlow shows an expanding price channel that helps determine the trend and the moments of its reversal. It is also used when accompanying transactions to set take profit/stop loss and averages. It has practically no parameters and is very easy to use - just specify an important moment in the history for you and the indicator will calculate the price channel. DISPLAYED LINES ROTATE - a thick solid line. The center of the general price rotation. The price makes wide cyclical movements around the
Elevate Your Trading Experience with the famous UT Bot Alert Indicator! Summary: The UT Bot Alert Indicator by Quant Nomad has a proven track record and is your gateway to a more profitable trading journey. It's a meticulously crafted tool designed to provide precision, real-time insights, and a user-friendly experience.  Key Features: 1. Precision Analysis: Powered by advanced algorithms for accurate trend identification, pinpointing critical support and resistance levels. 2. Real-time Ale
NakaSideBot
Ricardo De Andrade Nakano
NakaSideBot을 소개합니다 - 당신의 최종 측면 시장 챔피언! 시장이 방향을 바꿀 때 수익을 놓치는 것에 지쳤나요? NakaSideBot을 만나보세요. 당신의 최종 측면 시장 챔피언! 이 첨단 로봇은 변화무쌍한 시장 조건에서 번성하기 위해 설계되었으며, 트렌드와 측면 시장에 모두 적합합니다. 시장이 이동하거나 안정화될 때, NakaSideBot은 다른 사람들이 놓칠 수 있는 기회를 포착합니다. 첨단 알고리즘을 통해 조기에 트렌드 변화를 감지하고 신속하게 적응하여 항상 선배일 수 있도록합니다. 시장이 상승, 하락 또는 안정적인 상태일지라도, NakaSideBot은 모든 시장 환경에서 수익을 극대화하기 위한 비밀 무기입니다. 하지만 그것만으로 충분하지 않습니다. NakaSideBot은 위험 관리 동맹입니다. 당신의 자본을 보호하는 것의 중요성을 이해하기 때문에 NakaSideBot은 자신감을 가지고 거래할 수 있도록 지능적인 위험 관리 기능을 통합합니다. Naka
One Direction Pro is a combination of hedging, Grid averaging, pyramiding, lot martingale - anti martingale strategies, which aims to enter and exit the market as quickly as possible so as not to be trapped by unexpected market changes. Bot Explanation & Setfile |  MT4 version   Expert parameters: 1. Manage Open Positions Trade Buy: allow buy Trade Sell: allow sell Select Entry Method Period in bars for indicators : Average period Distance from High & Low Bands & Envelopes(in pips) : Distan
OrderHelper script is super easy and trader friendly to use. It would boost your trading experience. Because it is designed to open one to multiple orders quickly with just one click. Besides using the OrderHelper script, traders can define various parameters for open orders such as the symbol, order type, lot size, stoploss, takeprofit and more. Basically, with this script traders can manage their open orders more efficiently and save their trading time. OrderHelper manages: Open the number o
The third indicator from the set for market analysis. The first one is here:  https://www.mql5.com/ru/market/product/65258 The second one is here: https://www.mql5.com/ru/market/product/65347 The indicator builds a channel of maximum price fluctuations for a specified period. Additionally, the middle of the channel is drawn. All color settings, line types are customizable. The indicator allows you to see the picture of price movement from a slightly different angle. You can use several in
Scroll Manager 5
Mohammad Badere
Hello ! If you scroll in one chart, all charts will be scrolled If you change the time frame in one chart, it will change in all charts Of course, you can turn this feature on or off All the charts in which you want changes to be applied are specified through ID in the indicator settings You can scroll the charts of different time frames in two ways at the same time 1: Coordinated based on time That is, 1 hour candle is 60 candles one minute back 2: scroll in the form of number of candles That i
LAUNCHING PROMOTION:: Only a few copies left at the current price! CURRENT PRICE: $70 MONTH Join our Telegram community to share ready-made setup files Come use our EA that uses the Fimathe Strategy in an automated way . Based on support and resistance zones, our EA was designed to provide you with a new experience. The EA uses a calculation to track 2 possible breakout points. When it locates it, it immediately takes this channel to the starting point and waits for the trade to take place.
CandelTimer MT5
Kambiz Shahriarynasab
300 downloads without review ? !!!! If continued. I will not share any product for free. :( Small and very simple timer next to the current price to show the end time of the current candle Very useful and important for scalpers and those who work on price action.   We assure you that we welcome any suggestions to improve this indicator and make the necessary changes to improve this indicator. You can contact us via Instagram, Telegram, WhatsApp, email or here. We are ready to answer you.
Kyle Lambdas
Roberto Spadim
In Kyle’s model, the variable captures price impact. Illiquidity increases with uncertainty about v and decreases with the amount of noise Kyle argues that the market maker must find an equilibrium between profit maximization and market efficiency. This indicator is based on Advances in Financial Machine Learning 2018 - Marcos Lopez de Prado book, Page 288.
VolumeDeltaWaves
Stanislav Korotky
This indicator is an extended implementation of Weis waves. It builds Weis waves on absolute volumes (which is the classical approach) or delta of volumes (unique feature) using different methods of wave formation and visualization. It works with real volumes, if available, or with tick volumes otherwise, but also provides an option to use so called "true volume surrogates", as an artificial substitution for missing real volumes (for example, for Forex symbols), which was introduced in correspo
Horizontal volume bars, Cluster analysis, Volume profile Volume in Range gets information about the accumulated volume in a specified vertical range and period in bars. The received data is then plotted on the chart as rectangular boxes with the volume quantity inside. Usage:- The tool acts as a support resistance levels but most importantly it should be used to check in which direction the price breaks out of the significant levels formed by this indicator and then actions to be taken on correc
DLMACD
Roman Sukhorukov
DLMACD - Divergence Local (Wave) MACD . The indicator displays divergences by changing the color of the MACD histogram. The indicator is easy to use and configure. It was created as an addition to the previously published DWMACD . For the calculation, a signal line or the values ​​of the standard MACD histogram can be used. You can change the calculation using the UsedLine parameter. It is advisable to use a signal line for calculation if the histogram often changes directions and has small val
FREE
Trending Investor
Ali Waqas Ahmad
Best helping tool for Professional and Experienced traders. A best Tool To find the trend.  Instruction Manual: First Select your desired Symbol. Then attach this tool and wait till it identify the trend for you. Then it will be more feasible to trade. Once again best tool to trade. Demo version is available you can fully test its functionality. More importantly there are always trend breaks Once Trend break is observed un-attach this tool and then re-attach to get the fresh trend. Precautions
HebroN
Karthik Gopalakirshnan
5 (2)
COMBINE OUR EA LIKE NEW ERA,GOLDEN ERA,ONEPLUS, MARKET TREND,HEBRON TO GET ABOVE 1,00,000 PIP PROFIT PER MONTH BACKTEST WITH 100% HISTORY DATA (THIS EA WORKS WITH FAILED BREAKOUT STRATEGY) HEBRON Expert Advisor . Designed for the discerning trader, HEBRON brings a cutting-edge approach to navigating the dynamic and often unpredictable financial markets. HEBRON is optimized for the XAUUSD pair on a 15-minute timeframe , but its versatility extends far beyond. It seamlessly adapts to various
이 제품의 구매자들이 또한 구매함
TPSpro RFI Levels MT5
Roman Podpora
4.75 (12)
지침         러시아   -        영어       표시기와 함께 사용하는 것이 좋습니다   .       -       TPSpro   트렌드 프로 -   MT4 버전         거래에서 핵심 요소는 거래 상품을 매수 또는 매도하기로 결정하는 구역 또는 수준입니다. 주요 업체가 시장에서 자신의 존재를 숨기려는 시도에도 불구하고, 그들은 필연적으로 흔적을 남깁니다. 우리의 과제는 이러한 흔적을 식별하고 올바르게 해석하는 방법을 배우는 것이었습니다. 주요 기능:: 판매자와 구매자를 위한 활성 영역을 표시합니다! 이 지표는 매수 및 매도를 위한 모든 올바른 초기 임펄스 레벨/존을 보여줍니다. 진입점 검색이 시작되는 이러한 레벨/존이 활성화되면 레벨의 색상이 바뀌고 특정 음영으로 채워집니다. 또한 상황을 보다 직관적으로 이해하기 위해 화살표가 나타납니다. 더 높은 시간대의 레벨/존 표시(MTF 모드) 더 높은 시간 간격을 사용하여 레벨/존을 표시하는 기능을 추가했습니다.
TPSproTREND PrO MT5
Roman Podpora
4.89 (9)
TPSpro TREND PRO  - is a trend indicator that automatically analyzes the market and provides information about the trend and each of its changes, as well as giving signals for entering trades without redrawing! The indicator uses each candle, analyzing them separately. referring to different impulses - up or down impulse. Exact entry points into transactions for currencies, crypto, metals, stocks, indices!  Version MT4               DETAILED DESCRIPTION               R ecommended to use with an
Trend Screener Pro MT5
STE S.S.COMPANY
4.87 (63)
트렌드 표시기, 트렌드 트레이딩 및 필터링을 위한 획기적인 고유 솔루션, 하나의 도구 안에 내장된 모든 중요한 트렌드 기능! Forex, 상품, 암호 화폐, 지수 및 주식과 같은 모든 기호/도구에 사용할 수 있는 100% 다시 칠하지 않는 다중 시간 프레임 및 다중 통화 표시기입니다. Trend Screener는 차트에 점이 있는 화살표 추세 신호를 제공하는 효율적인 지표 추세 추종 지표입니다. 추세 분석기 표시기에서 사용할 수 있는 기능: 1. 트렌드 스캐너. 2. 최대 이익 분석이 있는 추세선. 3. 추세 통화 강도 측정기. 4. 경고가 있는 추세 반전 점. 5. 경고가 있는 강력한 추세 점. 6. 추세 화살표 Trend Screener Indicator가 있는 일일 분석 예, 일일 신호 성능...등은 여기에서 찾을 수 있습니다. 여기를 클릭하십시오. LIMITED TIME OFFER : Trend Screener Indicator는 50$ 및 평생 동안만 사용할 수 있습니다
우선 이 거래 시스템이 리페인팅, 리드로잉 및 레이그 인디케이터가 아니라는 점을 강조하는 것이 중요합니다. 이는 수동 및 로봇 거래 모두에 이상적인 것으로 만듭니다. 온라인 강좌, 설명서 및 프리셋 다운로드. "스마트 트렌드 트레이딩 시스템 MT5"은 새로운 및 경험이 풍부한 트레이더를 위해 맞춤형으로 제작된 종합적인 거래 솔루션입니다. 10개 이상의 프리미엄 인디케이터를 결합하고 7개 이상의 견고한 거래 전략을 특징으로 하여 다양한 시장 조건에 대한 다목적 선택이 가능합니다. 트렌드 추종 전략: 효과적인 트렌드 추이를 타기 위한 정확한 진입 및 손절 관리를 제공합니다. 반전 전략: 잠재적인 트렌드 반전을 식별하여 트레이더가 범위 시장을 활용할 수 있게 합니다. 스캘핑 전략: 빠르고 정확한 데이 트레이딩 및 단기 거래를 위해 설계되었습니다. 안정성: 모든 인디케이터가 리페인팅, 리드로잉 및 레이그가 아니므로 신뢰할 수 있는 신호를 보장합니다. 맞춤화: 개별 거래 선호도를 고려한 맞춤
Atomic Analyst MT5
Issam Kassas
4.32 (19)
우선적으로 언급할 점은이 거래 지표가 다시 그리지 않고 지연되지 않으며 이를 통해 수동 및 로봇 거래 모두에 이상적이라는 점입니다. 사용자 매뉴얼: 설정, 입력 및 전략. Atomic Analyst는 가격의 강도와 모멘텀을 활용하여 시장에서 더 나은 이점을 찾는 PA Price Action Indicator입니다. 고급 필터를 장착하여 잡음과 거짓 신호를 제거하고 거래 잠재력을 높이는 데 도움이 됩니다. 복잡한 지표의 다중 레이어를 사용하여 Atomic Analyst는 차트를 스캔하고 복잡한 수학적 계산을 간단한 신호와 색상으로 변환하여 초보 트레이더가 이해하고 일관된 거래 결정을 내릴 수 있도록합니다. "Atomic Analyst"는 새로운 및 경험이 풍부한 트레이더를위한 종합적인 거래 솔루션입니다. 프리미엄 지표와 최고 수준의 기능을 하나의 거래 전략에 결합하여 모든 종류의 트레이더에 대한 다재다능한 선택지가되었습니다. 인트라데이 거래 및 스캘핑 전략 : 빠르고 정확한
Quantum TrendPulse
Bogdan Ion Puscasu
5 (1)
SuperTrend   ,   RSI   ,   Stochastic   의 힘을 하나의 포괄적인 지표로 결합하여 트레이딩 잠재력을 극대화하는 궁극의 트레이딩 도구   인 Quantum TrendPulse를   소개합니다. 정밀성과 효율성을 추구하는 트레이더를 위해 설계된 이 지표는 시장 추세, 모멘텀 변화, 최적의 진입 및 종료 지점을 자신 있게 식별하는 데 도움이 됩니다. 주요 특징: SuperTrend 통합:   주요 시장 추세를 쉽게 따라가고 수익성의 물결을 타세요. RSI 정밀도:   매수 과다 및 매도 과다 수준을 감지하여 시장 반전 시점을 파악하는 데 적합하며 SuperTrend 필터로 사용 가능 확률적 정확도:   변동성이 큰 시장에서 숨겨진 기회를 찾기 위해 확률적 진동   을 활용하고 SuperTrend의 필터로 사용 다중 시간대 분석:   M5부터 H1 또는 H4까지 다양한 시간대에 걸쳐 시장을 최신 상태로 유지하세요. 맞춤형 알림:   맞춤형 거래 조건이 충족되면
FX Volume MT5
Daniel Stein
4.93 (14)
모닝 브리핑을 통해 세부 정보와 스크린샷으로 매일 시장 업데이트를 받으세요 여기 mql5 및 텔레그램에서 FX 거래량은 브로커의 관점에서 시장 심리에 대한 실제 통찰력을 제공하는 최초이자 유일한 거래량 지표입니다. 브로커와 같은 기관 시장 참여자가 외환 시장에서 어떤 포지션을 취하고 있는지에 대한 훌륭한 통찰력을 COT 보고서보다 훨씬 빠르게 제공합니다. 차트에서 이 정보를 직접 확인하는 것은 트레이딩의 진정한 판도를 바꾸고 획기적인 솔루션입니다. 다음과 같은 고유한 시장 데이터 인사이트의 이점 비율 는 통화의 매수/매도 포지션 비율을 백분율로 표시 비율 변화 는 선택한 기간 내 매수 비율과 비율 변화를 표시 총 거래량 는 해당 통화의 총 거래량(롱 및 숏)을 로트 단위로 보여줍니다 Volumes Long 는 해당 통화의 모든 롱 포지션의 거래량을 보여줍니다 Volumes Short 는 해당 통화의 모든 숏 포지션의 거래량을 보여줍니다 Net Long 는 순 롱 포지션의 거래량
FX Power MT5 NG
Daniel Stein
5 (6)
모닝 브리핑 여기 mql5 와 텔레그램에서 FX Power MT5 NG 는 오랫동안 인기 있는 통화 강도 측정기인 FX Power의 차세대 버전입니다. 이 차세대 강도 측정기는 무엇을 제공합니까? 기존 FX Power에서 좋아했던 모든 것 PLUS GOLD/XAU 강도 분석 더욱 정밀한 계산 결과 개별 구성 가능한 분석 기간 더 나은 성능을 위한 사용자 정의 가능한 계산 한도 특별 멀티더 많은 것을보고 싶은 사람들을위한 특별한 다중 인스턴스 설정 모든 차트에서 좋아하는 색상을위한 끝없는 그래픽 설정 수많은 알림 옵션, 중요한 것을 다시는 놓치지 않도록 Windows 11 및 macOS 스타일의 둥근 모서리가 있는 새로운 디자인 마법처럼 움직이는 인디케이터 패널 FX 파워 키 특징 모든 주요 통화의 완전한 강세 이력 모든 시간대에 걸친 통화 강세 이력 모든 브로커 및 차트에서 고유 계산 결과 100% 신뢰할 수있는 실시간100 % 신뢰할 수있는 실시간 계산-> 다시 칠하지 않음
Gold Stuff mt5
Vasiliy Strukov
4.92 (169)
Gold Stuff mt5는 금을 위해 특별히 설계된 추세 지표이며 모든 금융 상품에서도 사용할 수 있습니다. 표시기가 다시 그려지지 않고 지연되지 않습니다. 권장 기간 H1. 설정 및 개인 보너스를 받으려면 구매 후 즉시 저에게 연락하십시오!     강력한 지원 및 트렌드 스캐너 표시기의 무료 사본을 받으실 수 있습니다. 메시지를 보내주세요. 나!   설정 화살표 그리기 - 켜기 끄기. 차트에 화살표 그리기. 경고 - 가청 경고를 끕니다. 이메일 알림 - 켜기 끄기. 이메일 알림. Puch-notification - 켜기 끄기. 푸시 알림. 다음으로 색 영역을 조정합니다. Gold Stuff mt5는 금을 위해 특별히 설계된 추세 지표이며 모든 금융 상품에서도 사용할 수 있습니다. 표시기가 다시 그려지지 않고 지연되지 않습니다. 권장 기간 H1. 설정 및 개인 보너스를 받으려면 구매 후 즉시 저에게 연락하십시오!   설정 화살표 그리기 - 켜기 끄기. 차트에
이 대시보드는 선택한 심볼에 대해 사용 가능한 최신 고조파 패턴을 표시하므로 시간을 절약하고 더 효율적으로 사용할 수 있습니다 /   MT4 버전 . 무료 인디케이터:   Basic Harmonic Pattern 인디케이터 열 Symbol :   선택한 심볼이 나타납니다 Trend :   강세 또는 약세 Pattern :   패턴 유형(가틀리, 나비, 박쥐, 게, 상어, 사이퍼 또는 ABCD) Entry :   진입 가격 SL:   스톱로스 가격 TP1:   1차 테이크프로핏 가격 TP2:   2차 테이크프로핏 가격 TP3:   3차 테이크프로핏 가격 Current price:   현재 가격 Age (in bars):   마지막으로 그려진 패턴의 나이 주요 입력 Symbols :   "28개 주요 통화쌍" 또는 "선택한 심볼" 중에서 선택합니다. Selected Symbols :   쉼표로 구분하여 모니터링하려는 원하는 심볼("EURUSD,GBPUSD,XAUUSD")
소개       Quantum Breakout PRO   , 브레이크아웃 존 거래 방식을 변화시키는 획기적인 MQL5 지표! 13년 이상의 거래 경험을 가진 숙련된 트레이더 팀이 개발한       퀀텀 브레이크아웃 PRO       혁신적이고 역동적인 브레이크아웃 존 전략으로 거래 여정을 새로운 차원으로 끌어올리도록 설계되었습니다. Quantum Breakout Indicator는 5개의 이익 목표 영역이 있는 브레이크아웃 영역의 신호 화살표와 브레이크아웃 상자를 기반으로 한 손절 제안을 제공합니다. 초보자 거래자와 전문 거래자 모두에게 적합합니다. Quantum EA 채널:       여기를 클릭하세요 중요한! 구매 후 설치 매뉴얼을 받으려면 개인 메시지를 보내주십시오. 추천: 기간: M15 통화쌍: GBPJPY, EURJPY, USDJPY,NZDUSD, XAUUSD 계정 유형: 스프레드가 매우 낮은 ECN, Raw 또는 Razor 브로커 시간: GM
Entry Points Pro for MT5
Yury Orlov
4.46 (124)
다시 색을 칠하지 않고 거래에 진입할 수 있는 정확한 신호를 제공하는 MT5용 지표입니다. 외환, 암호화폐, 금속, 주식, 지수 등 모든 금융 자산에 적용할 수 있습니다. 매우 정확한 추정값을 제공하고 매수와 매도의 가장 좋은 시점을 알려줍니다. 하나의 시그널로 수익을 내는 지표의 예와 함께 비디오 (6:22)시청하십시오! 대부분의 거래자는 Entry Points Pro 지표의 도움으로 첫 거래 주 동안 트레이딩 결과를 개선합니다. 저희의   Telegram Group 을 구독하세요! Entry Points Pro 지표의 좋은점. 재도색이 없는 진입 신호 신호가 나타나고 확인되면(시그널 캔들이 완성된 경우) 신호는 더 이상 사라지지 않습니다. 여타 보조지표의 경우 신호를 표시한 다음 제거되기 때문에 큰 재정적 손실로 이어집니다. 오류 없는 거래 게시 알고리즘을 통해 트레이드(진입 또는 청산)를 할 이상적인 순간을 찾을 수 있으며, 이를 통해 이를 사용하는 모든 거래자의
우선적으로, 이 거래 도구는 전문적인 거래에 이상적인 비-다시 그리기 및 지연되지 않는 지표입니다.  온라인 강좌, 사용자 매뉴얼 및 데모. 스마트 가격 액션 컨셉트 인디케이터는 신규 및 경험 많은 트레이더 모두에게 매우 강력한 도구입니다. Inner Circle Trader Analysis 및 Smart Money Concepts Trading Strategies와 같은 고급 거래 아이디어를 결합하여 20가지 이상의 유용한 지표를 하나로 결합합니다. 이 인디케이터는 스마트 머니 컨셉트에 중점을 두어 대형 기관의 거래 방식을 제공하고 이동을 예측하는 데 도움을 줍니다.  특히 유동성 분석에 뛰어나 기관이 어떻게 거래하는지 이해하는 데 도움을 줍니다. 시장 트렌드를 예측하고 가격 변동을 신중하게 분석하는 데 탁월합니다. 귀하의 거래를 기관 전략에 맞추어 시장의 동향에 대해 더 정확한 예측을 할 수 있습니다. 이 인디케이터는 시장 구조를 분석하고 중요한 주문 블록을 식별하
Blahtech Supply Demand MT5
Blahtech Limited
4.54 (13)
Was: $299  Now: $99   Supply Demand uses previous price action to identify potential imbalances between buyers and sellers. The key is to identify the better odds zones, not just the untouched ones. Blahtech Supply Demand indicator delivers functionality previously unavailable on any trading platform. This 4-in-1 indicator not only highlights the higher probability zones using a multi-criteria strength engine, but also combines it with multi-timeframe trend analysis, previously confirmed swings
ON Trade Gann Squares MT5
Abdullah Alrai
5 (1)
간 스퀘어 지표는 W.D. 간이 쓴 "시장 예측을 위한 수학적 공식" 기사에 기반한 강력한 시장 분석 도구입니다. 이 도구는 수학적 개념과 간 이론을 사용하여 정확한 시장 분석을 수행합니다. 144, 90, 52의 제곱과 9의 제곱을 사용합니다. 또한 의 9의 제곱근 및 해당 제곱의 채널 및 스타 패턴과의 관련성을 통합합니다. 사용자 메뉴얼 및 적용: 이 지표를 사용하기 전에 사용자 메뉴얼을 읽고 질문이 있을 경우 문의하시기 바랍니다. 전체 메뉴얼은 웹사이트에서 제공됩니다. MT5의 전체 버전을 구매하거나 MT4의 무료 버전을 테스트할 수 있습니다. 두 버전 모두 링크에서 확인하실 수 있습니다. 주요 기능 및 기능: 간 스퀘어 지표는 정확한 결정을 위해 기하학적 개념과 간 이론을 활용하는 시장 분석을 위한 포괄적인 도구 집합을 제공합니다. 주요 기능은 다음과 같습니다. 9의 제곱 분석:   이 지표는 9의 제곱에 대한 수평 선, 스타 패턴, 그리드 및 간 팬을 그릴 수 있습니다. 간
TPA True Price Action indicator reveals the true price action of the market makers through 100% non-repainting signals strictly at the close of a candle! TPA shows entries and re-entries, every time the bulls are definitely stronger than the bears and vice versa. Not to confuse with red/green candles. The shift of power gets confirmed at the earliest stage and is ONE exit strategy of several. There are available now two free parts of the TPA User Guide for our customers. The first "The Basics"
Matrix Arrow Indicator MT5
Juvenille Emperor Limited
5 (13)
매트릭스 화살표 표시기 MT5 는 외환, 상품, 암호 화폐, 지수, 주식과 같은 모든 기호/도구에 사용할 수 있는 100% 다시 칠하지 않는 다중 기간 표시기를 따르는 고유한 10 in 1 추세입니다.  Matrix Arrow Indicator MT5 는 다음과 같은 최대 10개의 표준 지표에서 정보와 데이터를 수집하여 초기 단계에서 현재 추세를 결정합니다. 평균 방향 이동 지수(ADX) 상품 채널 지수(CCI) 클래식 하이켄 아시 캔들 이동 평균 이동 평균 수렴 발산(MACD) 상대 활력 지수(RVI) 상대 강도 지수(RSI) 포물선 SAR 스토캐스틱 오실레이터 윌리엄스의 백분율 범위 모든 지표가 유효한 매수 또는 매도 신호를 제공하면 강력한 상승/하락 추세를 나타내는 다음 캔들/막대가 시작될 때 해당 화살표가 차트에 인쇄됩니다. 사용자는 사용할 표시기를 선택하고 각 표시기의 매개변수를 개별적으로 조정할 수 있습니다. 매트릭스 화살표 표시기 MT5는 선택한 표시기에서만 정보를 수
Quantum Trend Sniper
Bogdan Ion Puscasu
4.8 (49)
소개       Quantum Trend Sniper Indicator는   추세 반전을 식별하고 거래하는 방식을 변화시키는 획기적인 MQL5 지표입니다! 13년 이상의 거래 경험을 가진 숙련된 트레이더 팀이 개발한       Quantum Trend Sniper 표시기       매우 높은 정확도로 추세 반전을 식별하는 혁신적인 방법으로 거래 여정을 새로운 차원으로 끌어올리도록 설계되었습니다. ***Quantum Trend Sniper Indicator를 구입하면 Quantum Breakout Indicator를 무료로 받을 수 있습니다!*** Quantum Trend Sniper Indicator는 추세 반전을 식별하고 세 가지 이익실현 수준을 제안할 때 경고, 신호 화살표를 제공합니다. 초보자 거래자와 전문 거래자 모두에게 적합합니다. Quantum EA 채널:       여기를 클릭하세요 MT4 버전:       여기를 클릭하세요
Auto Order Block with break of structure based on ICT and Smart Money Concepts (SMC) Futures Break of Structure ( BoS )             Order block ( OB )            Higher time frame Order block / Point of Interest ( POI )    shown on current chart           Fair value Gap ( FVG ) / Imbalance   -  MTF      ( Multi Time Frame )    HH/LL/HL/LH  -  MTF      ( Multi Time Frame )  Choch  MTF      ( Multi Time Frame )  Volume Imbalance     ,  MTF          vIMB Gap’s Power of 3 Equal High
RelicusRoad Pro MT5
Relicus LLC
5 (17)
이제 $ 147 (몇 가지 업데이트 후 $ 499 증가) - 무제한 계정 (PCS 또는 MACS) RelicusRoad 사용 설명서 + 교육 비디오 + 비공개 Discord 그룹 액세스 + VIP 상태 시장을 보는 새로운 방법 RelicusRoad는 외환, 선물, 암호화폐, 주식 및 지수에 대한 세계에서 가장 강력한 거래 지표로서 거래자에게 수익성을 유지하는 데 필요한 모든 정보와 도구를 제공합니다. 우리는 초보자부터 고급까지 모든 거래자가 성공할 수 있도록 기술적 분석 및 거래 계획을 제공합니다. 미래 시장을 예측할 수 있는 충분한 정보를 제공하는 핵심 거래 지표입니다. 우리는 차트에서 말이 안 되는 여러 지표 대신 완전한 솔루션을 믿습니다. 타의 추종을 불허하는 매우 정확한 신호, 화살표 + 가격 조치 정보를 표시하는 올인원 표시기입니다. 강력한 AI를 기반으로 하는 RelicusRoad는 누락된 정보와 도구를 제공하여 교육하고 성공적인 트레이더인 트레이딩 전문
PTS Divergence Buy Finder MT5
PrecisionTradingSystems
PTS - Precision Trading Systems의 Divergence Buy Finder Precision Divergence Finder는 시장 바닥을 핀포인트 정확도로 찾아내도록 설계되었으며 이를 자주 수행합니다. 기술적 분석에서 바닥을 고르는 기술은 일반적으로 정상을 선택하는 것보다 훨씬 쉽습니다. 이 항목은 정확히 이 작업을 위해 설계되었습니다. 상승 Divergence가 식별되면 구매하기 전에 트렌드가 반등할 때 기다리는 것이 현명합니다. 10 또는 20 바 높음을 사용하거나 이전 바의 이동 평균 15-30이 상승하는 것을 식별하기 위해 사용할 수 있습니다. 복잡한 알고리즘은 실시간 바 단위로 활성 Demand Index(DI) Divergence 수를 찾아내고 계산합니다. 모델은 시장 가격이 새로운 최저점을 기록하고 Demand Index가 새로운 최저점을 기록하지 않을 때 Divergence를 발생시키는 것을 관찰합니다. 이 지표는 두 가지
GannRS Trend Scalper   GannRS is an advanced trading tool based on Gann Law and Supports and Resistances. designed to have an   active trading at any time not lagging Indications are given at the beginning of a new candle Please watch the full tutorial video. How to use GannRS Very easy to set up... Put it on your chart Adjust inputs Inputs Show Resistance and support : [bool]  true = Shows R/S on chart false = does not show Show Levels :[bool]  true = Shows levels on the chart false = doe
Advanced Supply Demand MT5
Bernhard Schweigert
4.5 (14)
현재 33% 할인! 초보자나 전문 트레이더를 위한 최고의 솔루션! 이 보조지표는 우리가 다수의 독창적 기능과 새로운 공식을 통합한 독특하고 고품질이며 저렴한 거래 도구입니다. 이 업데이트를 통해 이중 시간대를 표시할 수 있습니다. 더 높은 TF를 표시할 수 있을 뿐만 아니라 차트 TF와 더 높은 TF 모두를 표시할 수 있습니다: 중첩 영역 표시. 모든 Supply Demand 트레이더들이 좋아할 것입니다. :) 중요한 정보 공개 Advanced Supply Demand의 잠재력을 극대화하려면 다음을 방문하십시오. https://www.mql5.com/ko/blogs/post/720245   진입 또는 목표의 명확한 트리거 포인트를 정확히 찾아냄으로 해서 거래가 어떻게 개선될지 상상해 보십시오. 새로운 알고리즘을 기반으로 매수자와 매도자 간의 잠재적인 불균형을 훨씬 더 쉽게 분간할 수 있습니다. 왜냐하면 가장 강한 공급영역과 가장 강한 수요 영역과 과거에 어떻게 진행 되었는지를(이
Contact me for instruction, any questions! Related Product:  Gold Trade Expert MT5 Introduction The breakout and retest strategy is traded support and resistance levels. it involves price breaking through a previous level.  The break and retest strategy is designed to help traders do two main things, the first is to avoid false breakouts. Many false breakouts start with a candlestick that breaks out of a level but ends with an immediate candlestick that brings the price back into the level. T
Beast Super Signal MT5
Dustin Vlok
2.71 (7)
수익성 있는 거래 기회를 쉽게 식별하는 데 도움이 되는 강력한 외환 거래 지표를 찾고 계십니까? Beast Super Signal보다 더 이상 보지 마십시오. 사용하기 쉬운 이 추세 기반 지표는 시장 상황을 지속적으로 모니터링하여 새로운 개발 추세를 찾거나 기존 추세에 뛰어들 수 있습니다. Beast Super Signal은 모든 내부 전략이 정렬되고 서로 100% 합류할 때 매수 또는 매도 신호를 제공하므로 추가 확인이 필요하지 않습니다. 신호 화살표 알림을 받으면 구매 또는 판매하기만 하면 됩니다. 구매 후 비공개 VIP 그룹에 추가되도록 저에게 메시지를 보내주세요! (전체 제품 구매만 해당). 최신 최적화된 세트 파일을 구입한 후 저에게 메시지를 보내주세요. MT4 버전은   여기에서 사용할 수 있습니다. 여기에서   Beast Super Signal EA를 받으세요. 최신 결과를 보려면 댓글 섹션을 확인하세요! Beast Super Signal은
Blahtech Market Profile MT5
Blahtech Limited
5 (9)
Was: $249  Now: $99   Market Profile defines a number of day types that can help the trader to determine market behaviour. A key feature is the Value Area, representing the range of price action where 70% of trading took place. Understanding the Value Area can give traders valuable insight into market direction and establish the higher odds trade. It is an excellent addition to any system you may be using. Inspired by Jim Dalton’s book “Mind Over Markets”, this indicator is designed to suit the
FxaccurateLS
Shiv Raj Kumawat
WHY IS OUR FXACCCURATE LS MT5 THE PROFITABLE ? PROTECT YOUR CAPITAL WITH RISK MANAGEMENT Gives entry, stop and target levels from time to time. It finds Trading opportunities by analyzing what the price is doing during established trends. POWERFUL INDICATOR FOR A RELIABLE STRATEGIES We have made these indicators with a lot of years of hard work. It is made at a very advanced level. Established trends provide dozens of trading opportunities, but most trend indicators completely ignore them!
ICT, SMC, SMART MONEY CONCEPTS, SMART MONEY, Smart Money Concept, Support and Resistance, Trend Analysis, Price Action, Market Structure, Order Blocks, BOS/CHoCH,   Breaker Blocks ,  Momentum Shift,   Supply&Demand Zone/Order Blocks , Strong Imbalance,   HH/LL/HL/LH,    Fair Value Gap, FVG,  Premium  &   Discount   Zones, Fibonacci Retracement, OTE, Buy Side Liquidity, Sell Side Liquidity, BSL/SSL Taken, Equal Highs & Lows, MTF Dashboard, Multiple Time Frame, BigBar, HTF OB, HTF Market Structure
[ MT4 Version ] Only the next 10 units at current price! Final price: $299 Are you tired of spending months on demo or live accounts to test your trading strategies? The Backtesting Simulator is the ultimate tool designed to elevate your backtesting experience to new heights. Utilizing Metatrader historical symbol information, it offers an unparalleled simulation of real market conditions. Take control of your testing speed, test ideas quickly or at a slower pace, and witness remarkable improve
Trend Line Map Pro MT5
STE S.S.COMPANY
4.09 (11)
트렌드 라인 맵 표시기는 트렌드 스크리너 표시기의 애드온입니다. Trend screener(Trend Line Signals)에 의해 생성된 모든 신호에 대한 스캐너로 작동합니다. Trend Screener Indicator 기반의 Trend Line Scanner입니다. Trend Screener Pro 표시기가 없으면 Trend Line Map Pro가 작동하지 않습니다. It's a Trend Line Scanner based on Trend Screener Indicator. If you don't have Trend Screener Pro Indicator,     the Trend Line Map Pro will not work . MQL5 블로그에 액세스하여 추세선 지도 표시기의 무료 버전을 다운로드할 수 있습니다. Metatrader Tester 제한 없이 구매하기 전에 사용해 보십시오. : 여기를 클릭하세요 1. 쉽게 얻을 수 있는 이점 통화 및
제작자의 제품 더 보기
MasterArrow
Pavel Krysanov
5 (1)
Correct market entries and exits are essential for any Forex trader. MasterArrow indicator addresses this issue. It has no redundant elements and draws only buy/sell arrows. The up arrow is a BUY signal, while the down arrow is a SELL one. The indicator is simple to configure. Change the Strength parameter to configure the signals frequency. The product is based on standard indicators (MA, RSI, ATR, etc.). But it also features the custom algorithm allowing to combine them into a single tool and
ExactArrows
Pavel Krysanov
3.71 (7)
The main aim of this indicator lies in determining entry and exit points, that is why the ExactArrow indicator does not draw nothing but arrows which show entry and exit points. In spite of apparent simplicity of the indicator, it has complicated analytic algorithms which determine entry and exit points. The indicator generates exact and timely entry and exit signals which appear on the current candle. The indicator generates an average of 1-2 candles before its analogues do. The indicator is ve
SignalArrow
Pavel Krysanov
The main objective of this indicator is to determine entry and exit points, that is why ExactArrow draws nothing but arrows showing entry and exit points. In spite of apparent simplicity of the indicator, it has complicated analytic algorithms which determine entry and exit points. The indicator generates exact and timely entry and exit signals which appear on the current candle. The indicator generates an average of 1-2 candles before its analogues do. The indicator is very easy to use. Open Bu
RightTrend
Pavel Krysanov
5 (3)
The RightTrend indicator shows the direction of trend and reversal points (market entry and exit points). It is very easy to use: open BUY deal when the up arrow appears and open SELL deal when the down arrow appears. The indicator generates accurate and timely signals for entering and exiting the market, which appear on the current candle while it is forming. In spite of apparent simplicity of the indicator, it has complex analytic algorithms which determine trend reversal points. Inputs stre
CorrectTrend
Pavel Krysanov
This indicator is designed to help traders in determining the market entry and exit points. It is very easy to use: open s BUY deal when the up arrow appears and open s SELL deal when the down arrow appears. The indicator is based on the basic indicators (MA, MACD, RSI) as well as original algorithms. The indicator does not redraw, arrows appear when a new candle opens. Input Parameters: strength - indicator period EnableAlerts - enable/disable alerts EmailAlert - send notifications to email w
TraderHelp
Pavel Krysanov
5 (3)
The main goal of the indicator is to determine the most optimal points of entry and exit from a trade. The indicator consists of three parts. The first one is arrows displaying the most efficient market entry/exit points. The up arrow is a buy signal, the down arrow is a sell one. The indicator contains an analytical analysis algorithm that includes a set of standard indicator readings, as well as a custom algorithm. The second part is data in the upper right corner (works on М1-D1 timeframes) o
Analytic Trade
Pavel Krysanov
The Analytic Trade indicator is a complete trading system. It consists of 4 parts: The first part is the arrows showing the most optimal points for opening and closing orders. The up arrow is a buy signal, the down arrow is a sell one. The second part is the information panel in the upper right corner. The current price is shown in a larger font, above it are: the daily High, distance from the current price to the daily High, and the difference between the High and Low (in points). Below it are:
Smart Help
Pavel Krysanov
5 (2)
The 'Smart Help' indicator is an excellent assistant for beginners and experienced traders. It consists of 3 parts: The first part provides entry and exit signals in the form of arrows. The up arrow is a signal of an uptrend, the down arrow indicates a downward trend. The second part shows the direction and strength of the current trend. The third part provides information on the currency pair state. The current price is indicated at the top. Below it are: the daily Low and High, the point dista
Analytic System
Pavel Krysanov
Индикатор Analytic System - это полноценная торговая система. Он состоит из 2 частей: Первая - это стрелочки, показывающие наиболее оптимальные точки открытия и закрытия сделок. Стрелка вверх - сигнал на покупку,стрелка вниз - на продажу. Индикатор использует сложные аналитические алгоритмы, при помощи которых система определяет моменты входов и выходов. Вторая - это информационная панель в правом верхнем углу. Крупным шрифтом обозначена цена, справа от неё показано текущее направление тренда (в
DriverFx
Pavel Krysanov
Данный индикатор рисует на графике стрелки, которые являются сигнала на вход и выход из сделки, а также в качестве фильтра индикатор окрашивает каждую свечу в синий и красный цвет. Дополнительно ко всему в левом верхнем окне показывается сила тренда и его направление по основным парам. У индикатора новая логика, которая существенно отличает его от множества аналогов. Он дает ранние сигналы на вход и на выход, свои значения не перерисовывает — то есть, если индикатор дал сигнал на вход в сделку,
Trading Strategy
Pavel Krysanov
Индикатор Trading Strategy призван помочь трейдерам в поиске оптимальных входов в сделку и выходов из неё. В его основе лежат показания технических индикаторов (MA, RSI, ATR и др.), а также авторский алгоритм, связывающий их сигналы в единое целое. Индикатор даёт сигналы на покупку и продажу в виде стрелочек: стрелочка вверх — сигнал на покупку, вниз — на продажу.   В правом верхнем углу показаны сигналы индикатора на 6 таймфреймах (M1, M5, M15, M30, H1, H4) данной валютной пары.  Индикатор с
Trend Predictor
Pavel Krysanov
This indicator is designed to identify trend reversal points. Its main difference from others is that it does not use moving indicators such as MA and built on its basis, namely, it does not show a trend reversal after the fact of a reversal, but tries to predict a trend reversal even BEFORE the reversal begins. The indicator is based on many different author's developments that allow you to minimize the number of false signals. The Trend Predictor indicator will be a very good helper in your
SmartStrategy
Pavel Krysanov
The Smart Strategy Indicator is a trading system that allows you to analyze the market in terms of several aspects of technical analysis. The first of them is a price channel, which is built automatically and allows the trader to see the main direction of price movement. It also makes it possible to analyze the market using a channel strategy (breakout and rebound from channel lines). Block 2 is the SAR system, which gives general information about the micro-movements in the market and this i
TrendCheck
Pavel Krysanov
The indicator has a new logic, which significantly distinguishes it from many analogues. It gives early entry and exit signals, does not redraw its values - that is, if the indicator gave a signal to enter a trade, then this signal will not disappear and will not move - it will remain where it appeared, and it also gives signals to opening a candle, which gives the trader a significant advantage in trading. The indicator is very easy to use. When a red line appears under the candles, you need
SmartArrows
Pavel Krysanov
5 (1)
For any trader, the result of market analysis is the correct identification of the market entry and exit points. The more correctly they are selected, the more profitable the trading. The SmartArrows indicator does not display any excessive information that may distract or confuse the trader, but only the mot important things. The indicator is very simple to use. When a down arrow appears, open a SELL trade, with an up arrow open BUY. Despite its seeming simplicity, the SmartArrows indicator con
TrendStar
Pavel Krysanov
This indicator is designed to help traders find the market entry and exit points. The indicator generates signals in the form of arrows, which is a simple and intuitive for use in trading. In spite of apparent simplicity of the indicator, it has complicated analytic algorithms which determine entry and exit points. Its operation is based on moving averages, RSI, candlestick patterns, as well as certain original developments. Open a Buy position when an upward arrow appears, and a Sell position w
Основная цель индикатора заключается в определении наиболее оптимальных точек входа в сделку и выхода из нее. Индикатор состоит из трех частей. Первая – это стрелки, показывающие оптимальные точки входа в сделку и выхода из нее. Стрелка вверх – сигнал на покупку, стрелка вниз – на продажу. В индикаторе заложен алгоритм аналитического анализа, который включает в себя множество показаний стандартных индикаторов, а также авторский алгоритм. Вторая часть – это информация в правом верхнем углу (работ
AnalyticTrade
Pavel Krysanov
Индикатор Analytic Trade - это полноценная торговая система. Он состоит из 4 частей: Первая - это стрелочки, показывающие наиболее оптимальные точки открытия и закрытия ордеров. Стрелка вверх - сигнал на покупку, вниз - на продажу. Вторая - это информационная панель в правом верхнем углу. Крупным шрифтом обозначена текущая цена, над ней показаны: максимум дня, расстояние от текущей цены до него и разность максимума и минимума (в пунктах). Под ней расположены: минимум дня, расстояние до минимума,
Индикатор Trading Strategy призван помочь трейдерам в поиске оптимальных входов в сделку и выходов из неё. В его основе лежат показания технических индикаторов (MA, RSI, ATR и др.), а также авторский алгоритм, связывающий их сигналы в единое целое. Индикатор даёт сигналы на покупку и продажу в виде стрелочек: стрелочка вверх — сигнал на покупку, вниз — на продажу. В правом верхнем углу показаны сигналы индикатора на 6 таймфреймах (M1, M5, M15, M30, H1, H4) данной валютной пары. Индикатор свои з
필터:
리뷰 없음
리뷰 답변