Three CCI and BandSqueeze for MT5
- 지표
- Norio Takahashi
- 버전: 1.1
- 활성화: 5
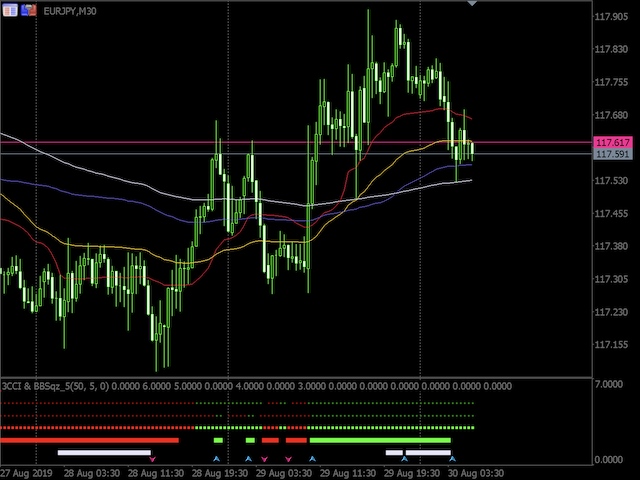
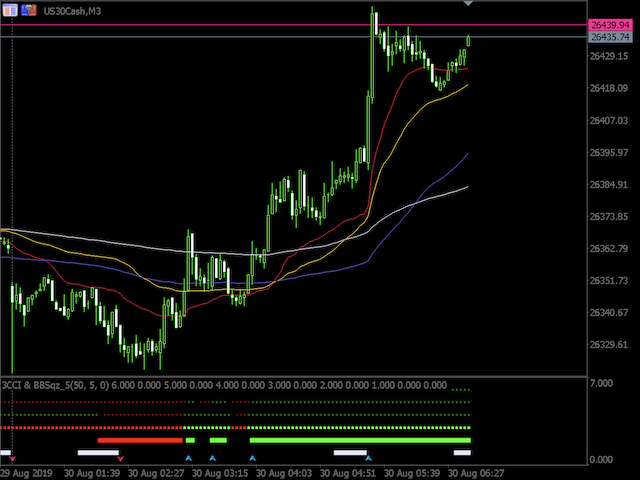
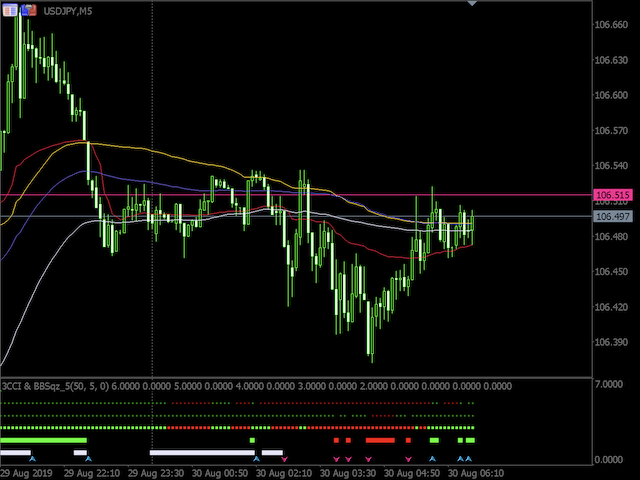
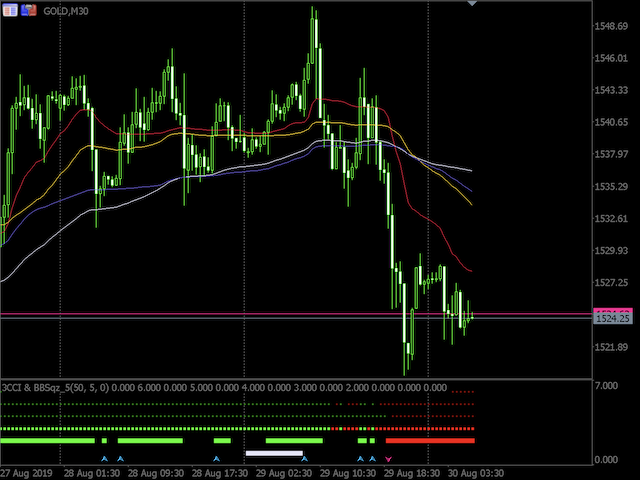
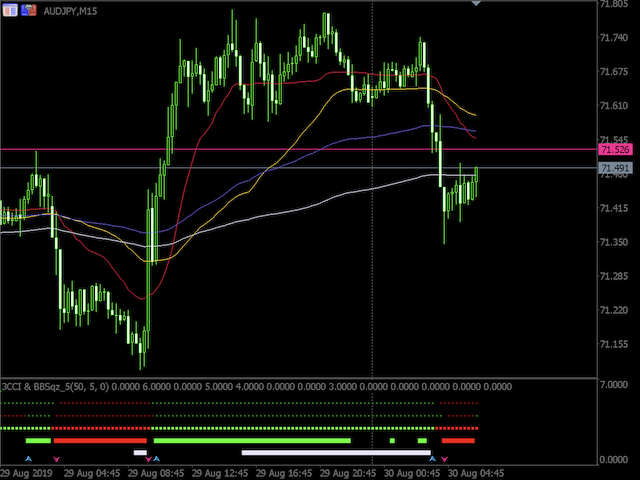
The current Rise and Fall is judged from the Commodity Channel Index (CCI) of the three cycles and displayed in a panel by color coding.
The
second and third of the three cycles are changed according to the correction factor multiplied by the first cycle (minimum cycle).
In addition, each CCI is displayed with ATR (Average True Range) corrected for variation.
When two of the three
CCI are complete, Trend_1 is displayed.
When all three are complete, Trend_2 is displayed.
// ---
Squeeze is displayed when the width of Bollinger Bands
becomes extremely narrow.
By adjusting the Bands period and BandsDeviation (deviation), and the allowable deviations in the past maximum and minimum of
bandwidth,
You can change the display of Squeeze intensity.
// ---
Up arrow and Down arrow are not displayed when
Squeeze is occurring.
They are displayed according to the Trend_1 status at the end of Squeeze and Trend_2 status .