Heikin Ashi
- 지표
- Bruno Cabral
- 버전: 1.0
- 활성화: 5
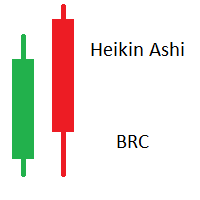
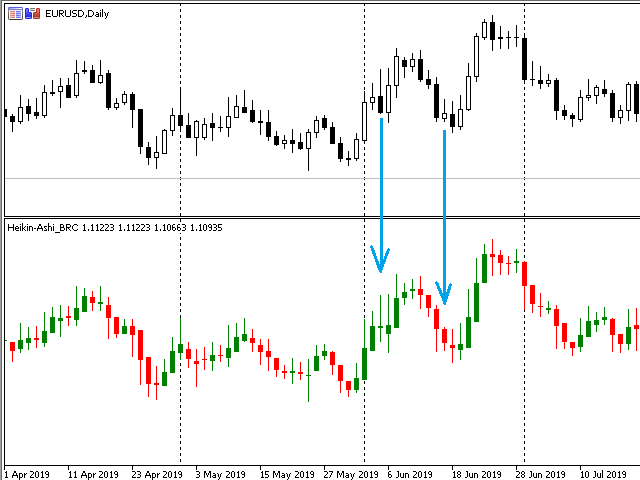
Heikin Ashi (HA) is a type of candlestick chart originated in Japan. The difference from traditional candlesticks is that HA bars are averaged,
creating a smoother appearence.
HA doesn't show the exact open and close price, they should be used as Technical Indicator and not as exact market prices.
Calculation:
HA Open = (Open of previous bar + Close of previous bar) / 2
HA Close = (Open + High + Low + Close) / 4
HA High = Highest of High, HA Open, or HA Close
HA Low = Lowest of Low, HA Open, or HA Close
It is not suitable for Day trading as it doesn't represent the exact market price. But for long term traders it has advantages, as they don't
flip-flop as much as the price bars, thus they can be seen as confirmation of trends.
It can be used to detect some patterns, like Doji candles, triangles, etc.


