• 미리보기
  • 리뷰 (2)
  • 코멘트 (1)
  • 새 소식

Display Multipair

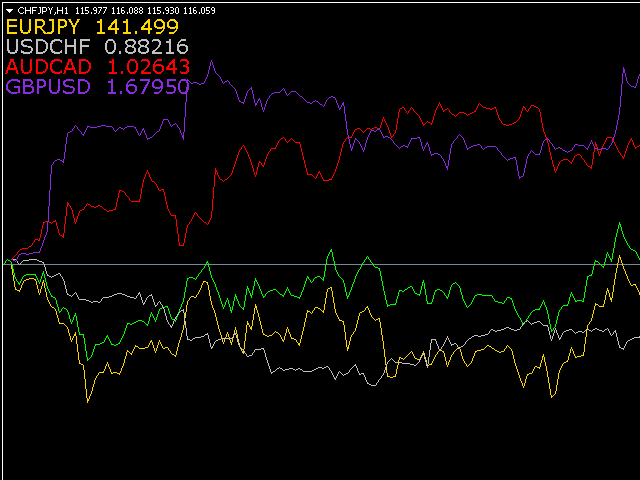
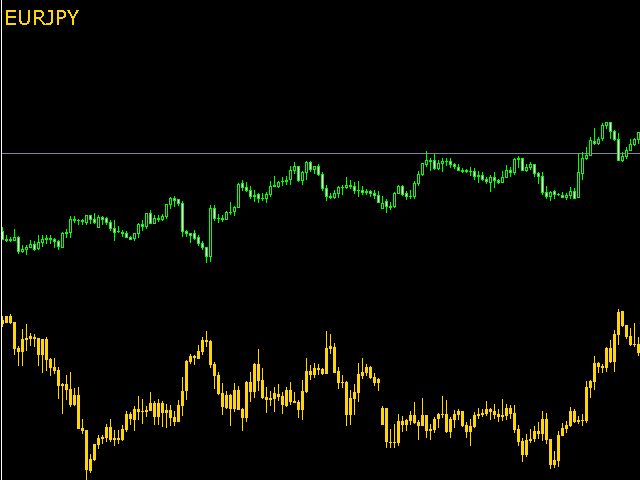
This is an indicator that allows displaying three currency pairs in one window.

Input Parameters:

  • Symbol1 - first currency pair.
  • symbol1mirrior - mirror display of the first currency pair.
  • s1color - color of the first currency pair.
  • Symbol2 - second currency pair.
  • symbol2mirrior - mirror display of the second currency pair.
  • Symbol3  - third currency pair.
  • symbol3mirrior -  mirror display of the third currency pair.
  • Symbo4  - fourth currency pair.
  • symbol4mirrior - mirror display of the fourth currency pair.
추천 제품
KopierMaschine - локальный копировщик сделок между различными счетами MetaTrader 4 и MetaTrader 5 в любом направлении расположенных на одном компьютере с интуитивно понятным интерфейсом. Направления копирования: MT4 --> MT5 MT4 --> MT4 MT5 --> MT5 MT5 --> MT4 для копирования между терминалами MetaTrader 4 и MetaTrader   5 необходимо приобрести версию продукта KopierMaschine  для  MetaTrader   5 Особенности Программа работает в двух режимах Master и Slave На один подчиненный счет можно копирова
This panel is a part of the SupDem-Pro trading system and is used to search for the best opportunities for any available instruments. Which can be selected manually in the Market Watch (open it with CTRL + M). Using this trading panel in combination with ShvedSupDem-Pro_Zone allows to analyze multiple currency pairs with a single click. The panel allows to load any instruments from the Market Watch, from 6 major currency pairs up to all instruments (480). The indicator parameters Button Width
TWO PAIRS SQUARE HEDGE METER INDICATOR Try this brilliant 2 pairs square indicator It draws a square wave of the relation between your two inputs symbols when square wave indicates -1 then it is very great opportunity to SELL pair1 and BUY Pair2 when square wave indicates +1 then it is very great opportunity to BUY pair1 and SELL Pair2 the inputs are : 2 pairs of symbols         then index value : i use 20 for M30 charts ( you can try other values : 40/50 for M15 , : 30 for M30 , : 10 for H1 ,
Noize Absorption Index MT4
Ekaterina Saltykova
5 (1)
Noize Absorption Index - is the manual trading system that measures the difference of pressure between bears forces and bulls forces. Green line - is a noize free index that showing curent situation. Zero value of index shows totally choppy/flat market.Values above zero level shows how powerfull bullish wave is and values below zero measures bearish forces.Up arrow appears on bearish market when it's ready to reverse, dn arrow appears on weak bullish market, as a result of reverse expectation. S
캔들의 종가를 예측하는 지표입니다. 지표는 주로 D1 차트에서 사용하기 위한 것이. 이 지표는 전통적인 외환 거래와 바이너리 옵션 거래 모두에 적합합니다. 지표는 독립형 거래 시스템으로 사용하거나 기존 거래 시스템에 추가로 사용할 수 있습니다. 이 표시기는 현재 양초를 분석하여 양초 본체 내부의 특정 강도 요인과 이전 양초의 매개변수를 계산합니다. 따라서 지표는 시장 움직임의 추가 방향과 현재 양초의 종가를 예측합니다. 이 방법 덕분에 지표는 단기 및 중장기 거래 모두에 적합합니다. 지표를 사용하면 시장 상황을 분석하는 동안 지표가 생성할 잠재적 신호의 수를 설정할 수 있습니다. 표시기 설정에는 이를 위한 특별한 매개변수가 있습니다. 또한 인디케이터는 새로운 신호에 대해 차트의 메시지 형태, 이메일 및 PUSH 알림 형태로 알릴 수 있습니다. 구매 후 저에게 꼭 써주세요! 나는 당신에게 지표와 거래에 대한 나의 추천을 줄 것입니다! 또한 보너스를 받으세요!
Blahtech Market Profile
Blahtech Limited
4.56 (16)
Was: $249  Now: $99   Market Profile defines a number of day types that can help the trader to determine market behaviour. A key feature is the Value Area, representing the range of price action where 70% of trading took place. Understanding the Value Area can give traders valuable insight into market direction and establish the higher odds trade. It is an excellent addition to any system you may be using. Blahtech Limited presents their Market Profile indicator for the MetaTrader community. Ins
History Pattern Search
Yevhenii Levchenko
표시기는 현재 시세를 작성하여 과거 시세와 비교할 수 있으며 이를 바탕으로 가격 변동을 예측합니다. 표시기에는 원하는 날짜로 빠르게 이동할 수 있는 텍스트 필드가 있습니다. 옵션: 기호 - 표시기가 표시할 기호 선택. SymbolPeriod - 지표가 데이터를 가져올 기간 선택. IndicatorColor - 표시기 색상. HorisontalShift - 지시자가 그린 따옴표를 지정된 막대 수만큼 이동합니다. Inverse - true는 인용 부호를 반대로, false - 원래 보기를 반전합니다. ChartVerticalShiftStep - 차트를 수직으로 이동합니다(키보드의 위/아래 화살표). 다음은 날짜를 입력할 수 있는 텍스트 필드의 설정으로, '엔터'를 누르면 즉시 이동할 수 있습니다.
The Best One Scalping Trade Panel functional manual trade panel with risk reward, auto SL by candle ( original solution), lot size calculation, one-click trading, scale in and out of trades (partial close),  Works with all symbols not just currency pairs, perfect works on DAX, NASDAQ, GOLD, ...... I earn every day during live stream on ZakopiecFX - join Me Risk by lot Risk by percent SL by points SL by Candle, Renko, RangeBar ( original solution) TP by point TP by Risk/Reward Auto Trailing b
Market Viewer
Matimu Romeo Ngoveni
Market Viewer This utility seeks to assist the trader in identifying potential areas of interest on the price chart. Different components integral to decision making have been automated, allowing the user to engage with perfectly calculated levels. Some components include the weeks initial balance, session Min and Max areas and a round number indicator altogether forming templates providing confidence to the trader. Have a look at the screenshots for a sneak peak into the components. The utility
Trade with Gann on your side!! MASTER CIRCLE 360 CIRCLE CHART, originally created by Gann admitted that this is “The Mother of all charts”. It is one of the last studies that this great trader left for us. The numeric tab le is apparently quite simple like all the tables and is based on square numbers, the SQUARE OF 12 and is by evolution, one of the most important square numbers. Here we can find CYCLE, PRICE AND TIME thanks to angles and grades, to show past and future support and resistance.
We present you the indicator "Candle closing counter", which will become your indispensable assistant in the world of trading. That’s why knowing when the candle will close can help: If you like to trade using candle patterns, you will know when the candle will be closed. This indicator will allow you to check if a known pattern has formed and if there is a possibility of trading. The indicator will help you to prepare for market opening and market closure. You can set a timer to create a p
Pipsurfer Trade Manager
Clinton Keenan Obinna Butler
The Pipsurfer Trade Manager Is A high level software that will automatically analysis each trading asset and calculate its optimal take profit and stop loss levels for Each trade it is managing. Complete with an easy to use management panel that allows you to manage your risk parameters for each individual trade that you place on each pair. You will have access to trailing stops, break even, partial take profits and account risk percentage features as well
Description: Please tick "Show object descriptions" in chart properties to enable hrays views That utility converts a trendline into a horizontal ray known as tool for drawing supply and demand zones. Simply create a trendline on a chart and once selected, it will get converted. Ray remains horizontal while dragging.  Quick ray plot: press "R" key to create horizontal ray. It will be snapped to the nearest OHLC value Further versions will be improved. For feature request please post new c
Meta Sniper
Samir Tabarcia
Requirements Optimized to work with   EURUSD-EURCHF-USDJPY, AUDUSD-CADJPY-AUDNZD, CHFJPY-NZDJPY-NZDUSD For timeframe 4H. *(Minimum recommended deposit is $300 for each Pair) for initial lot set to 0.10, My favorite Pair are (CHFJPY-NZDJPY-EURUSD-AUDNZD-USDJPY) Warning it will be SALE only 5 Copys at 60$ Then it will be update up to 200$  You can use it the way it is, For new Set Files will be add on (Comments) ECN broker with low spread is recommended to get better results. Setup is
VN Trade Panel II
Vyacheslav Nekipelov
4 (1)
The new version of the trading panel, which now has the ability to separately close Buy and Sell orders, display targets for all orders on the chart, as well as the ability to use the panel to trade with brokers working on the FIFO rule. Also, the new version adds option buttons for separate management of open orders. It has a convenient visualized interface and intuitive control without a lot of additional tabs to which traders have to be distracted and switch their attention. Thanks to this
자동 주문 및 위험 관리를 위한 유틸리티입니다. 이익을 최대한 활용하고 손실을 제한할 수 있습니다. 트레이더를 위한 실무 트레이더가 만들었습니다. 유틸리티는 사용하기 쉽고 거래자가 수동으로 또는 고문의 도움을 받아 열린 시장 주문과 함께 작동합니다. 매직 넘버로 거래를 필터링할 수 있습니다. 유틸리티는 동시에 원하는 수의 주문을 처리할 수 있습니다. 다음과 같은 기능이 있습니다. 1. 손절매 및 이익 수준 설정 2. 후행 정지 수준으로 거래를 마감합니다. 3. 손익분기점 설정. 유틸리티는 다음을 수행할 수 있습니다. 1. 각 주문에 대해 개별적으로 작업(각 주문에 대해 수준이 별도로 설정됨) 2. 단방향 주문 바스켓으로 작업(레벨은 모든 주문에 대해 공통으로 설정되며 별도로 구매 및 판매) 3. 다방향 주문 바구니로 작업(레벨은 모든 주문에 대해 공통으로 설정되며 BUY 및 SELL 함께) 옵션: STOPLOSS - =-1이
Title : Market Bias Indicator - Oscillator-Based Trading Tool Introduction : Discover the potential of the "Market Bias Indicator," a revolutionary oscillator-based trading tool designed for precise market analysis. If you're in search of a robust alternative to traditional bias indicators, your quest ends here. Market Bias Indicator offers unparalleled accuracy in identifying market sentiment and is your gateway to confident trading decisions. Recommended Trading Pairs : Market Bias Indicator i
This trade panel is designed for opening market orders with predefined values of Magic, TakeProfit and StopLoss. The panel displays the following data: Ask - current Ask price; Bid - current Bid price; Spread - spread equal to (Ask-Bid)*0.0001 for 4- and 5-digit quotes, and (Ask-Bid)*0.01 for 3- and 2-digit quotes; Buy - button for sending a request to open a Buy order; Sell - button for sending a request to open a Sell order; TakeProfit - set TakeProfit: pips - in pips (0.00001) for 4- and 5-di
Master scalping M1
Nataliia Marchuk
Master Scalping M1 is an innovative indicator that uses an algorithm to quickly and accurately determine the trend.The indicator calculates the time of opening and closing positions, the indicator's algorithms allow you to find the ideal moments to enter a deal (buy or sell an asset), which increase the success of transactions for most traders. Benefits of the indicator: Easy to assemble, does not overload the chart with unnecessary information. Can be used as a filter for any strategy. Works on
Auto Trade Copier
Vu Trung Kien
4.74 (89)
Auto Trade Copier is designed to copy trades to multiple MT4, MT5 and cTrader accounts/terminals with 100% accuracy. The provider and receiver accounts must be on the same PC/VPS. With this tool, you can copy trades to receiver accounts on the same PC/VPS. All trading actions will be copied from provider to receiver perfectly. This version can be used on MT4 accounts only. For MT5 accounts, you must use Auto Trade Copier for MT5 . Reference: - For MT4 receiver, please download Trade Receiver Fre
The Chaikin Oscillator is a technical indicator developed by Marc Chaikin that combines price and volume data to measure the accumulation and distribution of a financial instrument. It aims to identify potential buying and selling opportunities in the market. The Chaikin Oscillator is calculated by subtracting a 10-day exponential moving average of the Accumulation Distribution Line (ADL) from a 3-day exponential moving average of the ADL. Here's how to use the Chaikin Oscillator indicator in tr
Owl smart levels
Sergey Ermolov
4.34 (35)
MT5 버전  |   FAQ Owl Smart Levels Indicator 는   Bill Williams 의 고급 프랙탈, 시장의 올바른 파동 구조를 구축하는 Valable ZigZag, 정확한 진입 수준을 표시하는 피보나치 수준과 같은 인기 있는 시장 분석 도구를 포함하는 하나의 지표 내에서 완전한 거래 시스템입니다. 시장과 이익을 취하는 장소로. 전략에 대한 자세한 설명 표시기 작업에 대한 지침 고문-거래 올빼미 도우미의 조수 개인 사용자 채팅 ->구입 후 나에게 쓰기,나는 개인 채팅에 당신을 추가하고 거기에 모든 보너스를 다운로드 할 수 있습니다 힘은 단순함에 있습니다! Owl Smart Levels   거래 시스템은 사용하기 매우 쉽기 때문에 전문가와 이제 막 시장을 연구하고 스스로 거래 전략을 선택하기 시작한 사람들 모두에게 적합합니다. 전략 및 지표에는 눈에 보이지 않는 비밀 공식 및 계산 방법이 없으며 모든 전략 지표는 공개되어 있습니다. Owl Smart Lev
Point61 Indicator
Evgeniy Machok
5 (1)
The Point61 indicator is the result of many years of monitoring of price behavior of currency pairs and metals. It is not a secret, that in times of uncertainty, traders are looking for possible levels of support and resistance - the point, where price should stop its movement. There are 2 possible scenarios at these points: 1. Reverse (correction) to the opposite direction; 2. Breakthrough to continue movement. Very often these points are used to set stop orders - TakeProfit or
CumulativeDeltaBars
Stanislav Korotky
This indicator is a conventional analytical tool for tick volumes changes. It calculates tick volumes for buys and sells separately, and their delta on every bar, and displays volumes by price clusters (cells) within a specified bar (usually the latest one). The algorithm used internally is the same as in the indicator VolumeDelta , but results are shown as cumulative volume delta bars (candlesticks). Analogous indicator for MetaTrader 5 exists - VolumeDeltaBars . This is a limited substitution
An indicator of pattern #31 ("Long Island") from Encyclopedia of Chart Patterns by Thomas N. Bulkowski. The second gap is in the opposite direction. Parameters: Alerts - show alert when an arrow appears   Push - send a push notification when an arrow appears (requires configuration in the terminal) GapSize - minimum gap size in points ArrowType - a symbol from 1 to 17 ArrowVShift - vertical shift of arrows in points   ShowLevels - show levels ColUp - color of an upward line ColDn - color of
All Symbols   AND  All Time frames Scan                                                                                                                 Document Introduction   The ABCD is a basic harmonic pattern. The ABCD pattern is a visual, geometric chart pattern comprised of three consecutive price swings. It looks like a diagonal lightning bolt and can indicate an upcoming trading opp
Super Reversal Pattern
Parfait Mujinga Ndalika
Super Reversal Pattern Indicator Unlock the power of advanced pattern recognition with our Super Reversal Pattern Indicator. Designed for traders seeking precision and reliability, this indicator identifies one of the most effective reversal patterns in technical analysis, offering a significant edge in your trading strategy. Key Features: Non-Repainting Accuracy: Enjoy the confidence of non-repainting technology. Once a Super Reversal Pattern is detected, it remains static, providing consis
Trendiness Index
Libertas LLC
5 (3)
"The trend is your friend" is one of the best known sayings in investing, because capturing large trendy price movements can be extremely profitable. However, trading with the trend is often easier said than done, because many indicators are based on price reversals not trends. These aren't very effective at identifying trendy periods, or predicting whether trends will continue. We developed the Trendiness Index to help address this problem by indicating the strength and direction of price trend
The indicator displays the data of the Stochastic oscillator from a higher timeframe on the chart. The main and signal lines are displayed in a separate window. The stepped response is not smoothed. The indicator is useful for practicing "manual" forex trading strategies, which use the data from several screens with different timeframes of a single symbol. The indicator uses the settings that are identical to the standard ones, and a drop-down list for selecting the timeframe. Indicator Parame
Gold Bricks FX USES THE TREND WAVE INDICATOR AND IT CAN IDENTIFY THE BEGINNING AND THE END OF A NEW WAVE TREND MOVEMENT. AS AN OSCILLATOR, THE INDICATOR IDENTIFIES THE OVERBOUGHT AND OVERSOLD ZONES. IT WORKS GREAT TO CATCH THE SHORT TERM PRICE REVERSALS AND USES A MARTINGALE STRATEGY TO CLOSE ALL TRADES IN PROFIT. USE DEFAULT SETTINGS ON H1 OR HIGHER TIME FRAME ON ANY PAIR FOR MORE ACCURATE TRADES WHY THIS EA : Smart entries calculated by 4 great strategies The EA can be run on even a
이 제품의 구매자들이 또한 구매함
Trade Assistant MT4
Evgeniy Kravchenko
4.43 (180)
거래당 위험 계산, 라인을 사용한 손쉬운 신규 주문, 부분 청산 기능을 통한 주문 관리, 7가지 유형의 트레일링 스탑 및 기타 유용한 기능을 제공합니다. 주의, 응용 프로그램은 전략 테스터에서 작동하지 않습니다. Manual, Description, Download demo 라인 기능       - 차트에 개시선, 손절매, 차익실현을 표시합니다. 이 기능을 사용하면 새로운 주문을 쉽게 하고 개봉 전에 추가 특성을 볼 수 있습니다. 위기 관리       -       위험 계산 기능은 설정된 위험과 손절매 주문의 크기를 고려하여 새 주문의 볼륨을 계산합니다. 이를 통해 손절매 크기를 설정하고 동시에 설정된 위험을 존중할 수 있습니다. 로트 계산 버튼 - 위험 계산을 활성화/비활성화합니다. 필요한 위험 값은 위험 필드에 0에서 100 사이의 백분율 또는 예금 통화로 설정됩니다. 설정 탭에서 위험 계산 옵션을 선택합니다. $ 통화, % 잔액, % 지분, % 자유 마진, % 사용
사용자 지정 알림은 8가지 주요 통화(USD, CAD, GBP, EUR, CHF, JPY, AUD, NZD)와 금(XAU), 이러한 통화를 기준으로 하는 28개의 모든 외환 및 금 쌍, US30, UK100, WTI, 비트코인 등 최대 7개 지수에 걸쳐 유망한 설정을 식별하는 다목적 멀티마켓 모니터링 도구입니다. 완전히 사용자 정의할 수 있습니다. 이 도구는 FX 파워, FX 볼륨, IX 파워 지표에서 데이터를 수집하여 중요한 이벤트를 알려줍니다.   시작하기 전에 이 멀티 마켓 스캐너가 제공하는 모든 옵션을 활용하려면 터미널에 사용 중인 보조지표가 이미 설치되어 있어야 합니다. 기능 및 다양한 알림 옵션에 대한 자세한 내용은 ->   사용자 지정 알림 FAQ에서 확인하세요.                                                                                                        사용자 지정 알림
가격이 순식간에 변할 수 있는 시장에서 주문은 가능한 한 간단해야 한다고 생각하십니까? Metatrader에서는 주문을 열 때마다 시작 가격, 손절매 및 이익실현 및 거래 규모를 입력하는 창을 열어야 합니다. 금융 시장 거래에서 자본 관리는 초기 예금을 유지하고 곱하기 위해 필수적입니다. 따라서 주문을 하고 싶을 때 얼마나 큰 거래를 열어야 하는지 궁금할 것입니다. 이 단일 거래에서 위험을 감수해야 하는 예치금의 비율은 얼마입니까? 이 거래에서 얼마나 많은 이익을 얻을 수 있으며 위험 대비 이익 비율은 얼마입니까? 거래 규모를 설정하기 전에 거래 규모가 어떻게 되어야 하는지에 대한 질문에 대한 답을 얻기 위해 필요한 계산을 수행합니다. 이 모든 작업을 자동으로 수행하는 도구가 있다고 상상해 보십시오. 차트를 열고 시장 분석을 하고 진입점, 방어점(손절매) 및 목표(이익 실현)를 수평선으로 표시하고 마지막에 위험 수준을 정의합니다. 이 거래에서 감당할 수 있는 가용 자본의 %로, 이
Local Trade Copier EA MT4
Juvenille Emperor Limited
5 (81)
Local Trade Copier EA MT4 를 사용하여 매우 빠른 거래 복사 경험을 해보세요. 1분 안에 간편하게 설정할 수 있으며, 이 거래 복사기를 사용하면 Windows 컴퓨터 또는 Windows VPS에서 여러 개의 MetaTrader 터미널 간에 거래를 0.5초 미만의 초고속 복사 속도로 복사할 수 있습니다. 초보자든 전문가든 Local Trade Copier EA MT4 는 다양한 옵션을 제공하여 사용자의 특정 요구에 맞게 맞춤 설정할 수 있습니다. 이는 수익 잠재력을 높이려는 모든 사람을 위한 최고의 솔루션입니다. 지금 사용해보시고 이것이 왜 시장에서 가장 빠르고 쉬운 무역용 복사기인지 알아보세요! 팁: 여기 에서 데모 계정에서 Local Trade Copier EA MT4 데모 버전을 다운로드하여 사용해 볼 수 있습니다. 다운로드한 무료 데모 파일을 MT4 >> File >> Open Data Folder >> MQL4 >> Experts 폴더에 붙여넣고 터미
Exp COPYLOT CLIENT for MT4
Vladislav Andruschenko
4.7 (61)
MetaTrader 4용 트레이드 복사기.       모든 계정의 외환 거래, 포지션, 주문을 복사합니다. 그것은 최고의 무역 복사기 중 하나입니다       MT4 - MT4, MT5 - MT4       위해       카피롯 MT4       버전(또는       MT4 -  MT5   MT5 - MT5       위해       카피롯 MT5       버전). MT5 버전 전체 설명   +DEMO +PDF 구입 방법 설치하는 방법     로그 파일을 얻는 방법     테스트 및 최적화 방법     Expforex의 모든 제품 복사기   버전         MetaTrader 5   터미널 (   МТ5 - МТ5, МТ4 - МТ5   ) -   Copylot Client MT5 고유한 복사 알고리즘은 마스터 계정에서 고객 계정으로 모든 거래를 정확하게 복사합니다. 이 제품은 또한 높은 작동 속도에서 높은 오류 처리로 유명합니다. 강력한 기능 세트. 프로그램
Trade Dashboard MT4
Fatemeh Ameri
5 (38)
Tired of complex order placement and manual calculations? Trade Dashboard is your solution. With its user-friendly interface, placing orders becomes effortless, by a single click, you can open trades, set stop loss and take profit levels, manage trade lot size, and calculate risk to reward ratios, allowing you to only focus on your strategy. Say goodbye to manual calculations and streamline your trading experience with Trade Dashboard. Download  Demo Version  right now. You can find  Details
TradePanel MT4
Alfiya Fazylova
4.91 (86)
Trade Panel은 다기능 거래 보조원입니다. 이 애플리케이션에는 수동 거래를 위한 50개 이상의 기능이 포함되어 있으며 대부분의 거래 작업을 자동화할 수 있습니다. 구매하기 전에 데모 계정에서 데모 버전을 테스트할 수 있습니다. 데모는 여기 에서 확인하세요. 전체 지침은 여기 에서 확인하세요. 거래 . 한 번의 클릭으로 기본적인 거래 작업을 수행할 수 있습니다: 보류 주문 및 포지션 열기 주문 그리드 열기 보류 주문 및 포지션을 마감합니다. 포지션 전환(매수를 청산하여 매도를 개시하거나 매도를 청산하여 매수를 개시). 포지션 고정(반대 포지션을 열어 SELL과 BUY 포지션의 볼륨을 동일하게 만듭니다). 모든 포지션을 부분 청산합니다. 모든 포지션의 이익실현 및/또는 손절매를 공통 수준으로 설정합니다. 모든 포지션의 손절매를 손익 분기점 수준으로 설정합니다. 주문 및 포지션을 열 때 다음을 수행할 수 있습니다. 설정된 위험에 따라 거래량 자동 계산을 사용합니다. 한 번의 클릭으
Trade Manager MT4 DaneTrades
Levi Dane Benjamin
4.33 (9)
거래 관리자는 위험을 자동으로 계산하는 동시에 거래를 빠르게 시작하고 종료하는 데 도움을 줍니다. 과잉 거래, 복수 거래 및 감정 거래를 방지하는 데 도움이 되는 기능이 포함되어 있습니다. 거래를 자동으로 관리할 수 있으며 계정 성과 지표를 그래프로 시각화할 수 있습니다. 이러한 기능은 이 패널을 모든 수동 거래자에게 이상적으로 만들고 MetaTrader 4 플랫폼을 향상시키는 데 도움이 됩니다. 다중 언어 지원. MT5 버전  |  사용자 가이드 + 데모 트레이드 매니저는 전략 테스터에서 작동하지 않습니다. 데모를 보려면 사용자 가이드로 이동하세요. 위기 관리 % 또는 $를 기준으로 위험 자동 조정 고정 로트 크기 또는 거래량과 핍을 기반으로 한 자동 로트 크기 계산을 사용하는 옵션 RR, Pips 또는 Price를 사용한 손익분기점 손실 설정 추적 중지 손실 설정 목표 달성 시 모든 거래를 자동으로 마감하는 최대 일일 손실률(%)입니다. 과도한 손실로부터 계정을 보호하고 과도한
MT4 to Telegram Signal Provider 는 사용하기 쉽고 완전히 사용자 정의가 가능한 도구로, 텔레그램으로 신호를 보내어 계정을 신호 제공자로 변환할 수 있습니다. 메시지 형식은 완전히 사용자 정의가 가능합니다! 그러나 간단한 사용을 위해 미리 정의된 템플릿을 선택하고 메시지의 특정 부분을 활성화하거나 비활성화할 수도 있습니다. [ 데모 ]  [ 매뉴얼 ] [ MT5 버전 ] [ 디스코드 버전 ] [ 텔레그램 채널 ] 설정 단계별 사용자 가이드 가 제공됩니다. 텔레그램 API에 대한 지식이 필요 없으며, 개발자가 필요한 모든 것을 제공합니다. 주요 기능 구독자에게 보낸 주문 세부 정보를 사용자 정의할 수 있는 기능 예를 들어 브론즈, 실버, 골드와 같은 계층 구독 모델을 만들 수 있습니다. 골드 구독은 모든 신호 등을 받게 됩니다. ID, 심볼 또는 코멘트별 주문 필터링 주문이 실행된 차트의 스크린샷을 포함 보낸 스크린샷에 종료된 주문을 그려 추가
The product will copy all telegram signal to MT4   ( which you are member  ) , also it can work as remote copier.  Easy to set up, copy order instant, can work with almost signal formats, image signal, s upport to translate other language to English Work with all type of channel or group, even channel have "Restrict Saving Content", work with  multi channel, multi MT5 Work as remote copier: with signal have ticket number, it will copy exactly via ticket number. Support to backtest signal. How to
Unlimited Trade Copier Pro is a tool to copy trade remotely to multiple MT4, MT5 and cTrader accounts at different computers/locations over internet. This is an ideal solution for you if you are a signal provider and want to copy your trades to other receivers globally on your own rules. One provider can copy trades to multiple receivers and one receiver can get trade from multiple providers as well. The provider can even set the subscription expiry for each receiver, so that receiver will not b
Custom Ultimate Sniper Dashboard
Hispraise Chinedum Abraham
5 (2)
이 맞춤형 Ultimate Sniper 대시보드는 원래 Ultimate Sniper 대시보드 지표에 대한 EA 업그레이드입니다. 최대 98개의 서로 다른 알고리즘과 함께 작동하여 작업하는 자산 클래스에 대한 추세의 진정한 특성을 포착합니다. 이는 몇 달 동안 대부분의 고객으로부터 받은 많은 제안과 조언에 대한 직접적인 응답입니다. 이 사용자 정의 버전은 완전히 사용자 정의할 수 있습니다. 98개의 개별 맞춤형 알고리즘으로 구동됩니다. 매우 멋진 시각적 인터페이스로 모든 쌍 또는 기간에 대한 전체 시장 추세를 쉽고 자신 있게 따를 수 있습니다. 텔레그램에 실시간 알림을 보낼 수 있습니다. 거래 쌍에 따라 자신의 인덱스를 만들 수 있습니다. 휴대폰으로 실시간으로 알림을 보낼 수 있으므로 움직임이 설정되고 있음을 알기 위해 PC에 있을 필요가 없습니다. 입력 설정에서 8개의 인덱스를 설정할 수 있습니다. 알림을 받을 인덱스 및 기간을 설정할 수 있습니다. 인터넷 연결이 감지되지 않으면 경
MT4 to Discord Signal Provider 는 Discord로 직접 거래 신호를 보내는 데에 설계된 사용자 친화적이고 완전히 맞춤화할 수 있는 유틸리티입니다. 이 도구는 귀하의 거래 계좌를 효율적인 신호 제공자로 변환합니다. 귀하의 스타일에 맞게 메시지 형식을 사용자 정의하세요! 사용 편의성을 위해 사전에 디자인된 템플릿을 선택하고 포함하거나 제외할 메시지 요소를 선택할 수 있습니다. [ 데모 ] [ 매뉴얼 ] [ MT5 버전 ] [ Telegram 버전 ] 설정 간편한 설정을 위해 저희의 상세한 사용자 가이드 를 따르세요. Discord API에 대한 사전 지식이 필요 없습니다; 필요한 모든 도구를 제공합니다. 주요 기능 구독자 업데이트를 위한 주문 세부 정보를 사용자 정의합니다. 각 계층이 다른 수준의 신호 접근을 제공하는 브론즈, 실버, 골드와 같은 계층적 구독 모델을 구현합니다. 주문이 실행된 차트의 스크린샷을 첨부합니다. 더 명확하게 하기 위해 이 스크린
TPSpro Trade PRO
Roman Podpora
5 (4)
테스트 모드(테스터에서)에서는 패널 기능이 활성화되지 않습니다. 우리는 패널 자체의 시각적 표현만을 제공했습니다. 주어진 정지 손실 수준을 기반으로 포지션 규모나 위험을 즉시 계산할 수 있는 도구는 전문 트레이더와 초보자 모두에게 중요합니다. TRADE PRO 거래 유틸리티는 빠르고 정확한 계산을 제공하여 제한된 시간과 증가된 시장 변동성 조건에서 결정을 내리는 데 도움을 줍니다. 지침 -   https://www.mql5.com/ru/blogs/post/758419 주요 기능: 원래의. 단지. 효과적인. 독창적이고 편리한 메인 거래 패널 열기: 차트 오른쪽에 마우스를 올려 놓고 적절한 방향을 클릭하면 향후 주문이 가능합니다. 시장 주문의 빠른 설정 TRADE PRO를 사용하여 잔액이나 자본의 위험 비율 수준을 설정하거나 특정 위험 금액을 지정하세요. 차트에서 정지 손실 수준을 시각적으로 결정하여 도구가 각 통화 쌍에 대한 최적의 포지션 크기를 자동으로 계산할 수 있도록 합니다.
The News Filter
Leolouiski Gan
5 (21)
이 제품은 뉴스 시간 동안 모든 전문가 어드바이저 및 수동 차트를 필터링하여 수동 거래 설정이나 다른 전문가 어드바이저가 입력한 거래가 파괴될 수 있는 급격한 가격 상승으로부터 걱정하지 않아도 됩니다. 이 제품은 또한 뉴스 발표 전에 열린 포지션과 대기 주문을 처리할 수 있는 완전한 주문 관리 시스템이 함께 제공됩니다. The News Filter  를 구매하면 더 이상 내장 뉴스 필터에 의존할 필요가 없으며 이제부터 모든 전문가 어드바이저를 여기서 필터링할 수 있습니다. 뉴스 선택 뉴스 소스는 Forex Factory의 경제 캘린더에서 얻어집니다. USD, EUR, GBP, JPY, AUD, CAD, CHF, NZD 및 CNY와 같은 어떤 통화 기준으로 선택할 수 있습니다. Non-Farm (NFP), FOMC, CPI 등과 같은 키워드 식별을 기준으로 선택할 수도 있습니다. 저, 중, 고 영향을 가지는 뉴스를 필터링할 수 있도록 선택할 수 있습니다. 차트와 관련된 뉴스만 선택
Grid Manual MT4
Alfiya Fazylova
4.72 (18)
"Grid Manual"은 주문 그리드 작업을 위한 거래 패널입니다. 이 유틸리티는 보편적이며 유연한 설정과 직관적인 인터페이스를 제공합니다. 그것은 손실을 평균화하는 방향뿐만 아니라 이익을 증가시키는 방향으로 주문 그리드와 함께 작동합니다. 거래자는 주문 그리드를 만들고 유지할 필요가 없으며 유틸리티에서 수행합니다. 거래자가 주문을 시작하는 것으로 충분하며 "Grid Manual"는 자동으로 그를 위한 주문 그리드를 생성하고 거래가 마감될 때까지 그와 동행할 것입니다. 전체 설명 및 데모 버전 여기 . 유틸리티의 주요 기능: 모바일 터미널을 포함하여 어떤 방식으로든 열린 주문과 함께 작동합니다. "제한" 및 "중지"의 두 가지 유형의 그리드와 함께 작동합니다. 고정 및 동적(ATR 표시기 기반)의 두 가지 유형의 그리드 간격 계산과 함께 작동합니다. 오픈 오더 그리드의 설정을 변경할 수 있습니다. 차트에서 각 주문 그리드의 손익분기점 수준을 표시합니다. 각 주문 그리드에 대한 이익
Summer 40% discount ($149 -> $88) Everything for chart Technical Analysis indicator mt4 in one tool Draw your supply demand zone with rectangle and support resistance with trendline and get alerts to mobile phone or email alert -  Risk reward indicator Video tutorials, manuals, DEMO download   here .  Find contacts on my   profile . 1.   Extended rectangles and trendlines Object will be extended to the right edge of the chart when price will draw new candles on chart. This is rectangle extend
Visit our all-new   Stein Investments Welcome Page   to get the latest information, updates and trading strategies. Do you want to become a constantly profitable 5-star forex trader? Then  get our Stein Investments trading tools  and send us a screenshot to get your personal invitation to our exclusive trading chat with 500+ members. Crosshair is a fantastic tool that simplifies our chart analysis by bringing the price candles perfectly in line with the indicator values in the subwindows. You
This tool will allow you to export MetaTrader indicators data (Buffers) for any financial instrument present in your MetaTrader 4. You can download multiple Symbols and Timeframes in the same csv file. Also, you can schedule the frequency of download (every minute, 5 minutes, 60 minutes, etc.). No need to open a lot of charts in order to get the last data, the tool will download the data directly. The CSV File will be stored in the folder:   \MQL4\Files . How it works Report Tab : Select
Summer 50% discount ($199 -> $99) Advanced trading tool: One click smart orders that execute under your conditions Developed by trader for trading community:  position size calculator (lot size), open position after price action, strategy builder, set and forget trading, mobile notifications... Risk Management -  Risk percentage position size calculator, gain percentage, target risk reward ratio, spread and commissions are included in calculations 7 Advanced order types   - Set and forget tra
DrawDown Limiter MT4
Haidar, Lionel Haj Ali
5 (8)
Drawdown Limiter EA You are in the right place if you were searching for Drawdown control, Drawdown limiter, Balance protection, Equity Protection or Daily Drawdown Limit related to Prop Firm, FTMO, or Funded account trading, or if you want to protect your trading account. Have you suffered from controlling your drawdown when trading funded accounts? This EA is meant for you. Prop firms usually set a rule called “Trader Daily Drawdown”, and if it is not respected, you are disqualified.  I am an
Telegram To MT4 Receiver
Levi Dane Benjamin
5 (3)
당신이 멤버인 어떤 채널에서든(비공개 및 제한된 채널 포함) 신호를 직접 MT4로 복사하세요.  이 도구는 사용자를 고려하여 설계되었으며 거래를 관리하고 모니터하는 데 필요한 많은 기능을 제공합니다. 이 제품은 사용하기 쉽고 시각적으로 매력적인 그래픽 인터페이스로 제공됩니다. 설정을 사용자 정의하고 제품을 몇 분 안에 사용하십시오! 사용자 가이드 + 데모  | MT5 버전 | Discord 버전 데모를 시도하려면 사용자 가이드로 이동하십시오. Telegram To MT5 수신기는 전략 테스터에서 작동하지 않습니다! Telegram To MT4 특징 한 번에 여러 채널에서 신호를 복사합니다. 비공개 및 제한된 채널에서 신호를 복사합니다. Bot 토큰이나 채팅 ID가 필요하지 않습니다(필요한 경우 계속 사용할 수 있음). 위험 % 또는 고정된 로트를 사용하여 거래합니다. 특정 심볼을 제외합니다. 모든 신호를 복사할지 복사할 신호를 사용자 정의할지 선택합니다. 모든 신호를 인식하
Exp SafetyLock PRO
Vladislav Andruschenko
4.68 (25)
SAFETYLOCK을 사용하면 거래자는 이미 열린 포지션에 대해 반대 주문을 설정하여 강한 시장 반전을 피할 수 있습니다. 거래자 또는 EA가 포지션을 열면, SAFETYLOCK은 자동으로 반대 방향의 보류 주문을 설정합니다. 포지션이 손실 상태로 전환되면, 이 보류 주문이 활성화되어 잠금(락)을 생성하여 손실을 최소화합니다. EA는 초기 포지션을 닫거나, 후행 정지를 사용하여 수익을 최적화하거나, 로트를 증가시켜 거래 전략을 강화하는 다양한 옵션을 제공합니다. 또한, 포지션 가격에 맞추어 미결 주문의 오픈 가격을 조정하여 시장 움직임에 유연하게 대응할 수 있습니다. 전체 설명 +DEMO +PDF 구입 방법 설치하는 방법     로그 파일을 얻는 방법     테스트 및 최적화 방법     Expforex의 모든 제품 매개변수 기본(블로그의 매개변수에 대한 전체 설명) MilliSecondsTimerForMonitoring – 알고리즘 실행 시간을 밀리초 단위로 설정합니다
Trade copier MT4
Alfiya Fazylova
4.52 (29)
Trade Copier는 거래 계정 간의 거래를 복사하고 동기화하도록 설계된 전문 유틸리티입니다. 복사는 공급자의 계정/단말기에서 동일한 컴퓨터 또는 vps에 설치된 수신자의 계정/단말기로 발생합니다. 구매하기 전에 데모 계정에서 데모 버전을 테스트할 수 있습니다. 데모 버전 여기 . 전체 지침 여기 . 주요 기능 및 이점: 복사기는 "МТ4> МТ4", "МТ4> МТ5", "МТ5> МТ4" 복사를 지원합니다. 복사기는 데모 계정 > 실 계정, 실 계정 > 데모 계정, 데모 계정 > 데모 계정 및 실제 계정 > 실 계정 복사를 지원합니다. 복사기는 읽기 전용 암호가 적용된 투자자 계정에서 복사를 지원합니다. 하나의 공급자 터미널은 여러 수신 터미널로 트랜잭션을 보낼 수 있고 하나의 수신 터미널은 여러 공급자 터미널에서 트랜잭션을 수신할 수 있습니다. 복사기는 귀하 또는 귀하의 고문이 거래하는 동일한 터미널에서 작동할 수 있습니다. 높은 복사 속도(0.5초 미만). 복사기에는 간편
RSI Divergence Scanner is a multi-timeframe and multi-symbol dashboard and alert that checks all timeframes and symbols to find divergences between price chart and RSI indicator. This divergence scanner is integrated with support and resistance zones so you can check the RSI divergences in the most important areas of the chart to find trend reversals in the price chart. Download demo version   (works on M 1,M5,M30,W1 timeframes) Full description of scanner parameters ->   click here . How to get
Layer Master Toolbox
Peter Andrew Thomas
5 (3)
GRID TRADING - Layer Master tool kit is the ultimate, easy to use trading toolkit makes it simple to layer grids of Orders over any entry level. This toolkit will make it simple and fast to Open / Enter and Manage your grid trades on MT4. Every function is simple - but clicking and dragging the order zone - you define an area you want your orders, then you can quickly drag the SL and TP levels to where you want them. Hit one button and your orders are sent!!!  Features: It is capable to send h
The top-selling EAs on the market cost a lot and one day they are suddenly gone. This is because one strategy will not work in the forex market all the time. Our product is unique from all others in the MQL Marketplace because our EA comes with 34+ built-in indicators that allow adding more strategies every time.  You build your strategy and keep updating it. If one strategy does not work, simply build another all using only one EA. This is All-In-One EA in this market place. You can use as trad
LineSyncMirrorChart
Vitaly Muzichenko
5 (2)
통화 쌍의 상관 관계 및 발산 지표 - 동일한 가격 차트의 모든 쌍. 터미널에 열려 있는 모든 쌍을 표시합니다. MT5 버전 장점 다중 통화 거래 전략을 사용하는 거래자는 이동 매개변수를 비교하기 위해 동일한 가격 차트에서 선택한 쌍의 가격 이동을 시각적으로 관찰할 수 있습니다. 이것은 오버레이 차트 표시기의 고급 및 확장 버전입니다. "쌍 거래" 및 "포트폴리오 거래"와 같은 다중 통화 거래에 있어 상당히 효과적인 조수로서 다가오는 움직임을 미리 결정하는 데 도움이 됩니다. 이 기술은 두 가지 전략으로 요약되며, 첫 번째는 중요한 뉴스 발표 후 또는 거래 플로어가 열릴 때 통화 쌍 간의 불일치를 찾기 위해 고안되었습니다. 이러한 작업의 논리는 매우 간단하며 시장의 "폭풍"이 진정된 후 상품 가격 간의 델타가 다시 수렴하기 시작할 것이라는 가정을 기반으로 하는 반면 강력한 지원에 주의를 기울이는 것이 좋습니다. 강한 저항 아래에서 직접 구매하고 맨 아래에서 판
RedFox Copier Pro
Rui Manh Tien
4.73 (11)
FREE SIGNAL CHANEL:  https://t.me/redfox_daily_forex_signals Time saving and fast execution Whether you’re traveling or sleeping, always know that Telegram To Mt4 performs the trades for you. In other words, Our   Telegram MT4 Signal Trader  will analyze the trading signals you receive on your selected Telegram channels and execute them to your Telegram to MT4 account. Reduce The Risk Telegram To Mt4   defines the whole experience of copying signals from   Telegram signal copier to mt4  p
VirtualTradePad mt4 Extra
Vladislav Andruschenko
4.88 (57)
한 번의 클릭으로 거래할 수 있는 거래 패널.   위치 및 주문 작업!   차트 또는 키보드에서 거래. 거래 패널을 사용하면 차트에서 클릭 한 번으로 거래하고 표준 MetaTrader 컨트롤보다 30배 빠르게 거래 작업을 수행할 수 있습니다. 거래자의 삶을 더 쉽게 만들고 거래자가 훨씬 빠르고 편리하게 거래 활동을 수행할 수 있도록 도와주는 매개변수 및 기능의 자동 계산. 차트의 무역 거래에 대한 그래픽 팁 및 전체 정보. MT5 버전 전체 설명   +DEMO +PDF 구입 방법 설치하는 방법     로그 파일을 얻는 방법     테스트 및 최적화 방법     Expforex의 모든 제품 열기 및 닫기, 반전 및 잠금, 부분 닫기/오토로트. 가상/실제 손절매/이익 실현/후행 정지/손익분기점, 주문 그리드 .... MetaТrader 4   의 주요 요청 거래 제어판   : 구매, 판매, 구매 중지, 구매 제한, 판매 중지, 판매 제한, 닫기, 삭제, 수정, 후행 중지,
제작자의 제품 더 보기
Multi OrderBlock
Kourosh Hossein Davallou
Order blocks are essential structures in trading that indicate areas where large institutional traders , like banks and hedge funds, have placed their orders. These blocks represent significant price levels where substantial buying or selling activity has occurred, providing clues about potential market movements. So, why should you, as a trader, care about order blocks? Well, knowing where these big orders are placed can give you a huge advantage. It’s like having a map showing where the treasu
FREE
Pattern Searching
Kourosh Hossein Davallou
Chart patterns are a common tool used by traders to identify potential trading opportunities in the financial markets. These patterns are formed by the price action of a security, and can provide valuable information about the direction in which the price is likely to move. Some of the most common chart patterns include head and shoulders, double tops and bottoms, triangles, and flags and pennants. By analyzing these patterns, traders can make informed decisions about when to enter or exit a tr
FREE
Stochastic RainBow 5
Kourosh Hossein Davallou
A   stochastic   oscillator is a momentum indicator comparing a particular closing price of a security to a range of its prices over a certain period of time. The sensitivity of the oscillator to market movements is reducible by adjusting that time period or by taking a moving average of the result. It is used to generate overbought and oversold trading signals, utilizing a 0-100 bounded range of values. This indicator  show 8 stochastic on one chart.
FREE
StochasticRainBow
Kourosh Hossein Davallou
5 (1)
A stochastic oscillator is a momentum indicator comparing a particular closing price of a security to a range of its prices over a certain period of time. The sensitivity of the oscillator to market movements is reducible by adjusting that time period or by taking a moving average of the result. It is used to generate overbought and oversold trading signals, utilizing a 0-100 bounded range of values. This indicator  show 15 stochastic on one chart.
FREE
MarketSession
Kourosh Hossein Davallou
The 24-hour forex (FX) market offers a considerable advantage for many institutional and individual traders because it guarantees liquidity and the opportunity to trade at any conceivable time. Currencies can be traded anytime but an individual trader can only monitor a position for so long, however. Most traders can't watch the market 24/7 so they're bound to miss opportunities or worse. A jump in volatility can lead to a movement against an established position when the trader isn't around. A
FREE
Price Aleart
Kourosh Hossein Davallou
4.5 (2)
Price Alert indicator plays sound alerts when the price reaches certain levels that are set by the trader. If you use e-mail alert feature, don't forget to set the e-mail settings in your MetaTrader platform options window.   Input parameters: WhenPriceGoesAbovePIP - if the price exceeds the current one by a specified amount of Pips, the alert will be triggered. WhenPriceGoesBelowPIP - if the price goes below the current one by a specified amount of Pips, the alert will be triggered. WhenPriceIs
FREE
Price Ladder
Kourosh Hossein Davallou
This indicator is based on the Channel . Input Parameters channel_One - show trend line One on or off. timeFrame_One  - time Frame of channel One . ColorChannel_One  - color of  trend line One. channel_Two - show trend line Two on or off. timeFrame_Two  - time Frame of channel Two . ColorChannel_Two  - color of  trend line Two. channel_Three - show trend line Three on or off. timeFrame_Three  - time Frame of channel Three . ColorChannel_Three  - color of  trend line three. channel_Four - show tr
FREE
Wolfe Wave
Kourosh Hossein Davallou
This particular methodology. Please note the odd sequence in counting, as you will see, it is necessary for the inductive analysis. By starting with a top we are assured of beginning our count on a new wave. (The reverse would apply for a bearish wave.) The 2 point is a top. The 3 point is the bottom of the first decline. The 1 point is the bottom prior to point 2 (top), that 3 has surpassed. The 4 point is the top of the rally after point 3. The 5 point is the bottom after point 4 and is likely
Daily GBPUSD trade
Kourosh Hossein Davallou
Our strategy relies on a choppy movement on most Forex pairs during the Asian session. Most traders in London sleep when the Sun shines over the Pacific and this results to a very slow movement of GBPUSD pair between 9:00 PM GMT and 7:00 AM GMT. Buy order: Place a buy-stop order just five  pip above the upper band. Place a stop loss just one pip below the lower band. Place a profit target at the upper LawnGreen Arrow. Sell order: Place a sell-stop order just five pip below the lower band. Place
Breakout trade
Kourosh Hossein Davallou
Breakout System   This indicator is based on the trend line and breakthrough. Pair: EURUSD, GBPUSD. Timeframe: M15 Or H1. Input Parameters AlertsOn  - alert on or off. TrendLine  - show trend line. TrendLineStyle  - style of trend line. UpTrendColor  - color of up trend. DownTrendColor  - color of down trend. ShowTakeprofit  - show take profits. ShowTakeprofitStyle  - style of take profit. UpperTakeprofitColor  - color of up take profit. LowerTakeprofitColor  - color of down take profit.
Week Pivot
Kourosh Hossein Davallou
Weekly Pivot   There are a lot of advantages when trading with support and resistance lines, and they should be a staple in every trader's arsenal. Another effective method of deriving multiple horizontal based support and resistance lines is using a formula derived from yesterday's High, Low and Close bar. The formula maps out pivot point levels consisting of the pivot, and three levels of support and resistance, and these levels can be traded much the same way as trading with the regular suppo
Forex Tools
Kourosh Hossein Davallou
The indicator is based on several useful indicators in the multi time frames that help us chart and table and alert.     This demo version and fix parameters. The full version can be downloaded at following address. https://www.mql5.com/en/market/product/34745  The various parameters used in this indicator and the default ones are as follows. ·     Moving Average Mode:     LMMA ·         Moving Average Period One:      4 ·         Moving Average Period Two:       8 ·         Moving Average
FREE
Forex Tools X
Kourosh Hossein Davallou
The indicator is based on several useful indicators in the multi time frames that help us chart and table and alert.   The various parameters used in this indicator and the default ones are as follows. ·     Moving Average Mode:     LMMA ·           Moving Average Period One:        4 ·           Moving Average Period Two:         8 ·           Moving Average Period Three:     15 ·           Moving Average Period Four:       30 ·           Moving Average Period Five:          80 ·           Mo
Only NonFarm Payroll Trade 4
Kourosh Hossein Davallou
Only NonFarm Payroll Trade   The employment situation is a set of labor market indicators. The unemployment rate measures the number of unemployed as a percentage of the labor force. Non-farm payroll employment counts the number of paid employees working part-time or full-time in the nation's business and government establishments. The average workweek reflects the number of hours worked in the non-farm sector. Average hourly earnings reveal the basic hourly rate for major industries as indicate
Daily GBP expert
Kourosh Hossein Davallou
Daily GBPUSD trade   Our strategy relies on a choppy movement on most Forex pairs during the Asian session. Most traders in London sleep when the Sun shines over the Pacific and this results to a very slow movement of GBPUSD pair between 9:00 PM GMT and 7:00 AM GMT. Input Parameters: Auto GMT shift extern int Broker_GMT_Shift = 0;//Manual Broker GMT shift extern int London_Night = 21; //London Night extern int London_Open = 7; //London Open
ForexTools
Kourosh Hossein Davallou
This Indicator works based on several well-known Technical Indicators in different time frame Works. These Technical Indicators include:           Moving Averages (MA)           Average Directional Index (ADX)           Parabolic Stop and Reverse (SAR)         Moving Average Convergence Divergence (MACD)         Commodity Channel Index (CCI)           Oscillator of a Moving Average (OsMA )           Momentum(MOM)           Relative Strength Index (RSI)           Williams' Percent Range  (WPR)
ForexToolsFree
Kourosh Hossein Davallou
This Indicator works based on several well-known Technical Indicators in different time frame Works. These Technical Indicators include: ·          Moving Averages(MA) ·          Average Directional Index (ADX) ·          Parabolic Stop and Reverse (SAR) ·          Moving Average Convergence Divergence (MACD) ·          Commodity Channel Index (CCI) ·          Oscillator of a Moving Average (OsMA) ·          Momentum(MOM) ·          Relative Strength Index (RSI) ·          Williams' Percent Rang
FREE
CurrencyMeter
Kourosh Hossein Davallou
Currency Meter   When trading Forex, we trade a pair of currencies at time. For example EUR/USD. If we are long on the EUR/USD it means that we expect the EUR to gain in strength relative to the USD. If we are short on the EUR/USD it means that we expect the EUR to weaken relative to the USD. You should be all familiar with this concept. The key thing about pairs though is that they just indicate the strength of one currency  relative  to another. If we see the EUR/USD going up, is it because th
Three Channel
Kourosh Hossein Davallou
5 (1)
The Price Channel pattern trading strategy is one of the smartest ways to make money trading. The Price Channel pattern represents two trend lines positioned above (channel resistance) and below (channel support) the price. The  price action  is contained between these two parallel trendlines. The separation between the two trendlines needs to be wide enough if you want to trade inside the Price Channel Pattern. If this is the case, you can buy at the channel support level and sell at the channe
Multi Andrew PitchFork
Kourosh Hossein Davallou
5 (1)
ANDREW’S PITCHFORK TRADING STRATEGY       Essentially, Andrew’s Pitchfork is a tool for drawing price channels. While two lines surrounding price are usually enough to draw a channel, the Pitchfork has an extra line. It is the median line or the handle of the Pitchfork.     The median line is central to this trading method. This is why Andrew’s Pitchfork is also known as the Median Line Method. TRADING RULES      There are many ways to trade using Andrew’s Pitchfork but the basic idea is that pr
PriceActionDetector
Kourosh Hossein Davallou
Price Action translates as "price movement." Proponents of technical analysis believe that the price takes into account everything that happens on the market. Therefore,   indicators   and advisers are not needed, since they are calculated based on historical price data and can be very late. By the time the indicator signal triggers, the price direction may already have changed. Those indicators that are trying to predict the price direction are often redrawn. All this leads to unnecessary losse
Visual Trading Demo
Kourosh Hossein Davallou
With this tool you can easily draw lines on the chart and the trade is done easily. The steps are as follows: First: Draw the buy and sell lines on the chart. Second: Draw the profit and loss lines on the chart. Third: Specify the volume of the transaction you want to trade. Fourth: Activate the lines. Warning When moving lines, be careful not to make a wrong trade. Expert easily trades you. This is a DEMO version and can only be used on EURUSD . You can check the final version below: https://
FREE
Visual Trading
Kourosh Hossein Davallou
With this tool you can easily draw lines on the chart and the trade is done easily. The steps are as follows: First:   Draw the buy and sell lines on the chart. Second:   Draw the profit and loss lines on the chart. Third:   Specify the volume of the transaction you want to trade. Fourth:   Activate the lines. Warning When moving lines, be careful not to make a wrong trade. Expert easily trades you.  You can check out the ٍِDEMO version below : https://www.mql5.com/en/market/product/55493
Multi Fair Value Gap
Kourosh Hossein Davallou
A Fair Value Gap (FVG) in Forex trading is essentially the difference between the current market price of a currency pair and what it's believed to be worth based on economic factors or reversion to the mean idea in technical analysis. Market price deviates significantly from this estimated "fair value," it can signal potential trading opportunities. Several factors can cause an FVG to appear. It often arises from market sentiment, economic news, or geopolitical events that temporarily push a cu
On Click Trade
Kourosh Hossein Davallou
This is an Expert Advisor that allows opening and modifying positions and orders via mouse (with Stop Loss, Take Profit). Working with this Expert Advisor requires setting lot size, take profit and stop loss for positions. For pending orders you need to set lot size, take profit, stop loss and distance (pip). This Expert Advisor has only one input parameter - background color.
Moving Average RAINBOW
Kourosh Hossein Davallou
Moving Average RAINBOW Forex traders use moving averages for different reasons. Some use them as their primary analytical tool, while others simply use them as a confidence builder to back up their investment decisions. In this section, we'll present a few different types of strategies - incorporating them into your trading style is up to you! A technique used in technical analysis to identify changing trends. It is created by placing a large number of moving averages onto the same chart. When a
Three Channel 5
Kourosh Hossein Davallou
The Price Channel pattern trading strategy is one of the smartest ways to make money trading. The Price Channel pattern represents two trend lines positioned above (channel resistance) and below (channel support) the price. The price action is contained between these two parallel trendlines. The separation between the two trendlines needs to be wide enough if you want to trade inside the Price Channel Pattern. If this is the case, you can buy at the channel support level and sell at the channel
Multi Andrew PitchFork 5
Kourosh Hossein Davallou
Multi Andrew PitchFork   ANDREW’S PITCHFORK TRADING STRATEGY       Essentially, Andrew’s Pitchfork is a tool for drawing price channels. While two lines surrounding price are usually enough to draw a channel, the Pitchfork has an extra line. It is the median line or the handle of the Pitchfork.     The median line is central to this trading method. This is why Andrew’s Pitchfork is also known as the Median Line Method. TRADING RULES      There are many ways to trade using Andrew’s Pitchfork but
Iranian stock market
Kourosh Hossein Davallou
5 (1)
Smart money is a powerful currency. This money is available to major investors who can identify, predict or even generate capital movements ahead of others. This money can flow into financial and capital markets and create dramatic price changes in various stocks. Therefore, detecting smart cash flow, which usually enters the market in a coherent manner and confronts the volume and value of transactions in a market with high returns, is one of the methods that some investors use to invest. But h
FREE
필터:
Francis Dogbe
10241
Francis Dogbe 2016.04.12 22:04 
 

사용자가 평가에 대한 코멘트를 남기지 않았습니다

Vadim Strelkov
7710
Vadim Strelkov 2014.05.06 15:14 
 

사용자가 평가에 대한 코멘트를 남기지 않았습니다

리뷰 답변
버전 3.0 2020.04.29
Change candlestick