Wave Trend Indicator
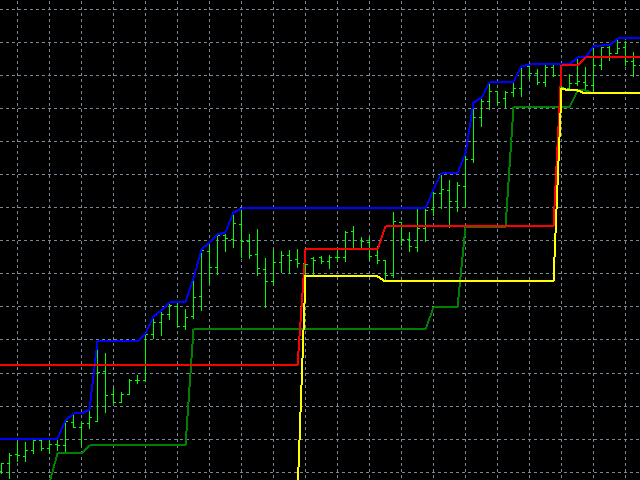
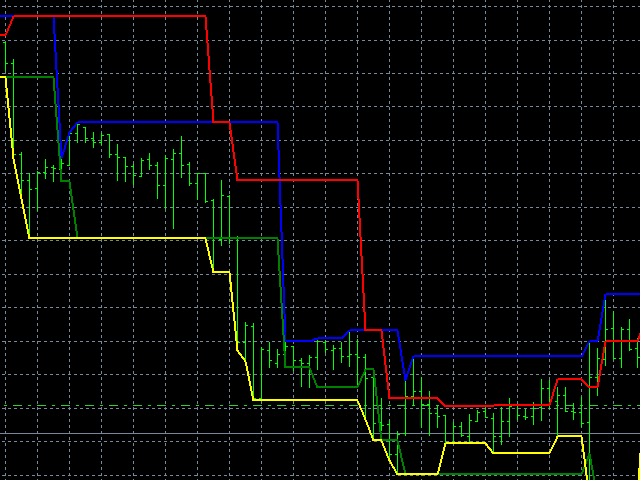
The high and low band points made strictly according to Dow's theory can be used to distinguish the position of support and resistance, to
identify the starting point of trend, and to stop and stop loss.
Whether you are a trend trader, an day short-term trader, or a scalp trader, I believe this indicator will be of great help to you.
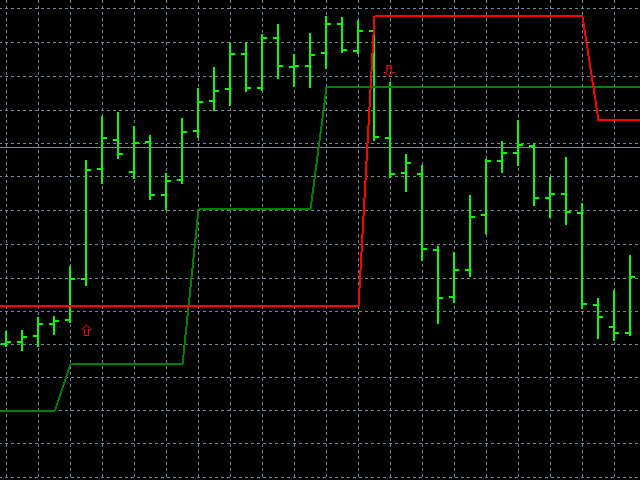
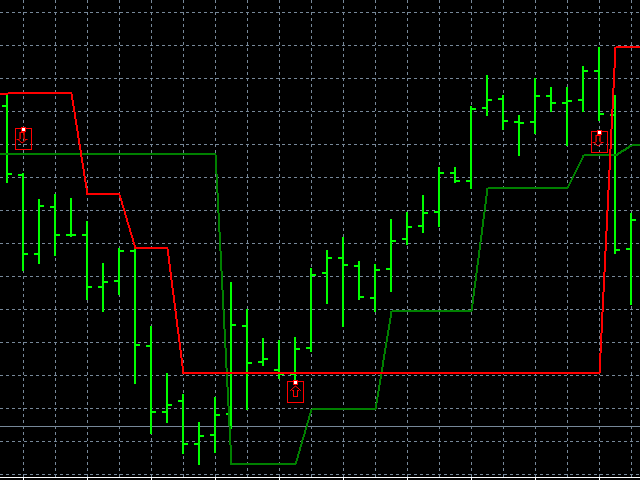
For example, when the price goes down through the green line, the current short trend starts, and when the price goes up through the red line,
the bull trend starts, the corresponding High and Low act as the effective stop-loss line for opening positions, and the corresponding
reverse crossing act as the stop-loss position.
Of course, with other theories such as charts, Gann,Turtle、 and so on, indicators can play a greater role.
I won't go into any more details here. You can find other interesting uses of this indicator according to your trading strategy.
Indicators do not have external parameters, and the results will not be inconsistent according to the number of backtracking columns. All the
conditions used are entirely from the market, that is, always follow the steps of the market.
