AIS Levi Smoothing Process MT5
- 지표
- Aleksej Poljakov
- 버전: 1.0
- 활성화: 5
One of the powerful methods of analysis is the modeling of financial series using Levy processes. The main advantage of these processes is
that they can be used to model a huge number of phenomena - from the simplest to the most complex. Suffice it to say that the idea of the
fractal price movement in the market is only a special case of Levy processes. On the other hand, with proper selection of parameters,
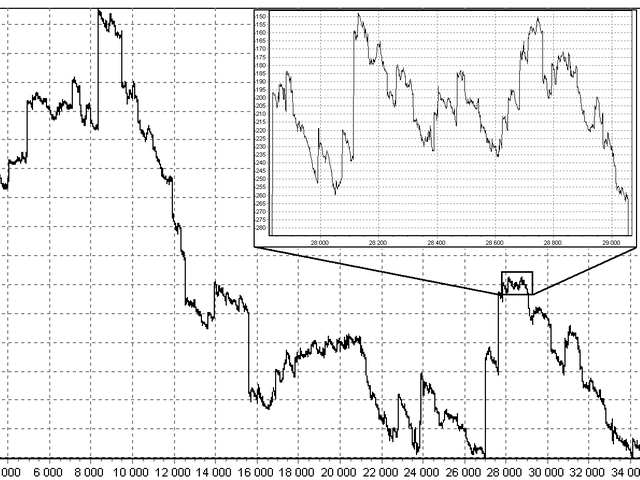
any Levy process can be represented as a simple moving average. Figure 1 shows an example of a Levy process with a fragment enlarged
several times.
Let's consider the possibility of using the Levy process to smooth out the price chart. First you need to select the parameters of the Levy
process so that it can be used to simulate a linear process. Then we get a system of weights, which includes the coefficients of different
signs. Thanks to this, we will be able not only to smooth out the financial range, but also to track the anti-trend and periodic
components present in it.
- The operation of the indicator is configured by selecting the parameter LF. It determines the depth of the story, which will be analyzed. The permissible value of this parameter lies within 0 - 255. And the number of bars that are used for the calculation will be two more than this number.
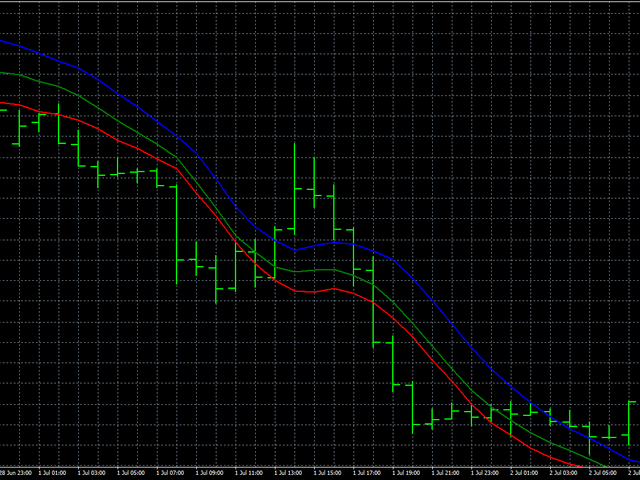
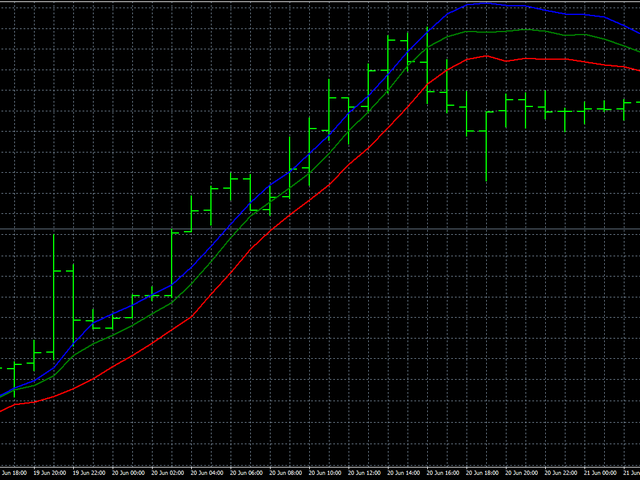
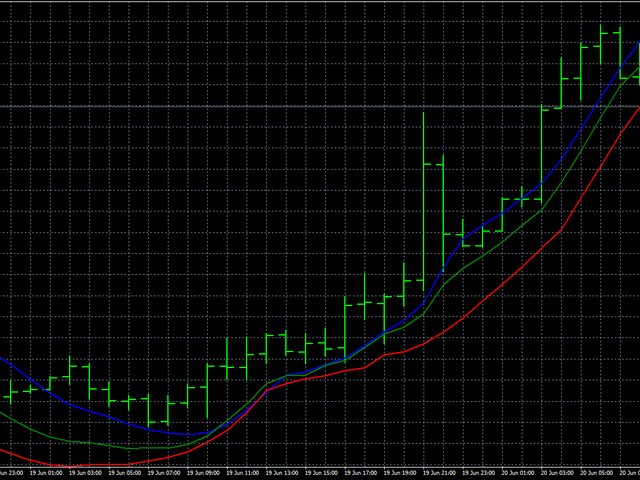
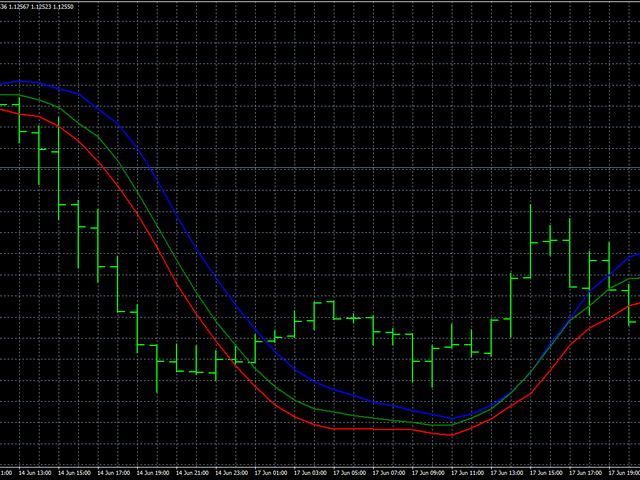
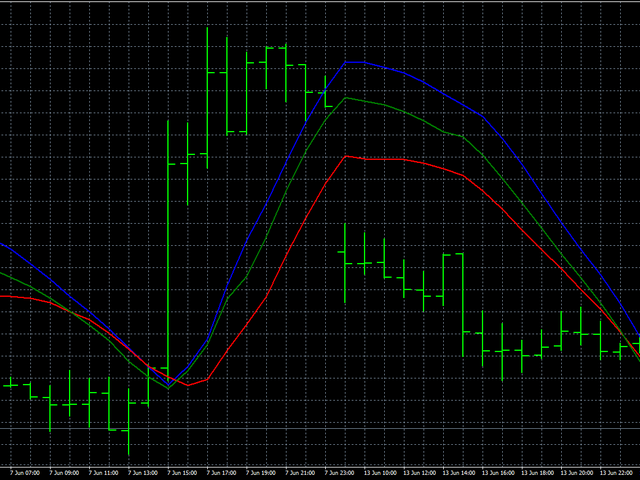
The blue line shows the result of High price smoothing, the green line refers to Close prices, and the red line shows Low prices.
The main disadvantage of this indicator is that anti-aliasing is performed according to a strictly defined algorithm, which does not take
into account sharp and strong changes in the market. Also, as in all smoothing indicators, there is a lag that can reach the values of a
simple moving average.

