AIS Linear Dynamic System
- 지표
- Aleksej Poljakov
- 버전: 1.0
- 활성화: 5
Let's look at the nature of price changes in the Forex market, not paying attention to the reasons why these changes occur. This approach will allow us to identify the main factors affecting the price movement.
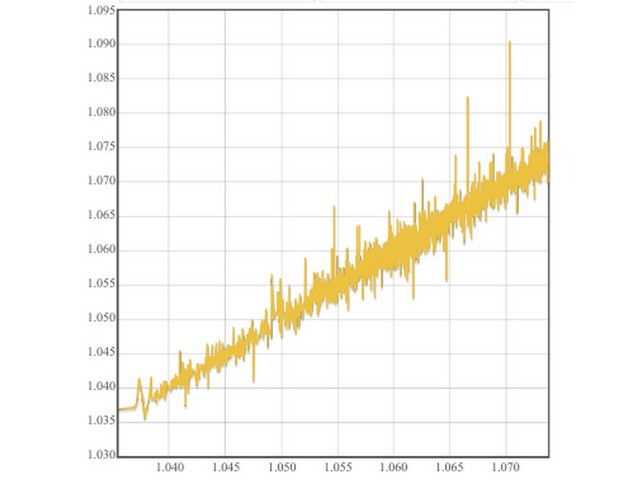
For example, let's take the opening prices of bars on the EUR-USD currency pair and the H1 timeframe. For these prices, we construct the Lameray diagram (Figure 1).
In this diagram, it can be seen that the price movement basically occurs according to a linear equation. To determine the parameters of this equation, you can use the method of least squares. In this particular example, the equation for changing the opening price took the form:
Open [i] = 0.99989 * Open [i + 1] +0.00013.
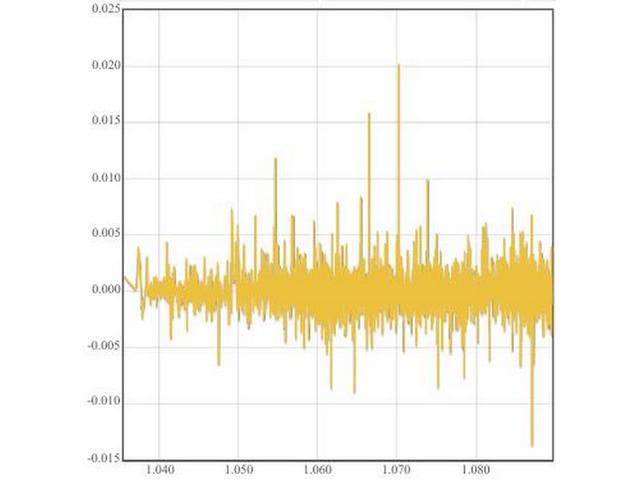
Let's check how adequately this equation describes the price movement. To do this, we remove the linear component and analyze the residuals (Figure 2).
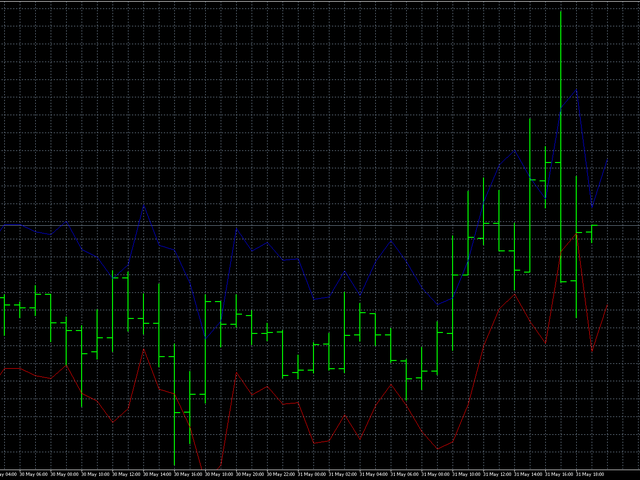
As it becomes clear from the figure, these residues are rather chaotic and if we consider them as noise, we can get a fairly simple system for predicting the opening price of the next bar, which is implemented in the form of this indicator.


