Magic Volumes
- 지표
- Marco vd Heijden
- 버전: 1.0
- 활성화: 5
This is the first out of a series of two indicators from the magic series.
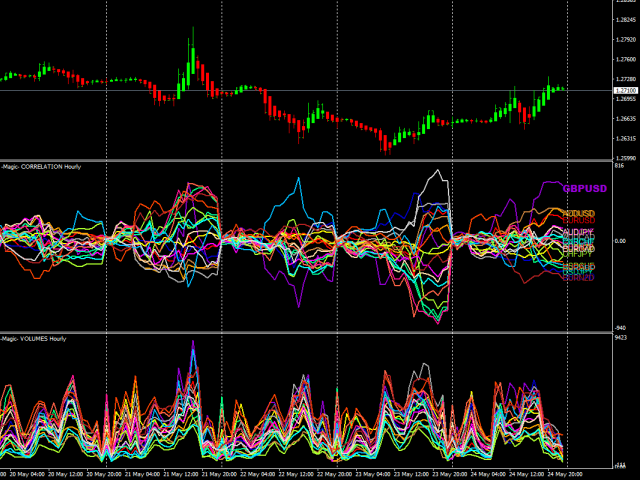
This indicator is Magic Volumes, this is the Indicator at the Bottom in the screenshot.
The indicator plots up to 30 instruments and visualizes events like:
- Time, Start, End and Duration of the events.
- Levels of activity in the form of Tick Volumes.
- Patterns.
- Time Cycles.
What normally remains hidden between charts, will now be revealed in the blink of an eye.
The need of an economic calendar becomes obsolete, simply because the activity of the instruments combined, will reflect market activity.
Tick Volumes will reveal when the heat starts, ends, as well as the intensity of the event, frontrunners,
This Indicator can not really be tested in the tester because it needs multiple feeds, of multiple instruments at the same time.
