Signal Strength Meter
- 지표
- Naim El Hajj
- 버전: 1.6
- 업데이트됨: 17 7월 2020
- 활성화: 5
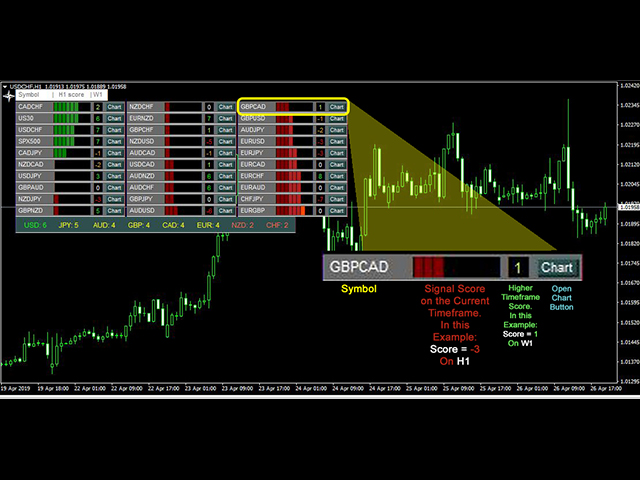
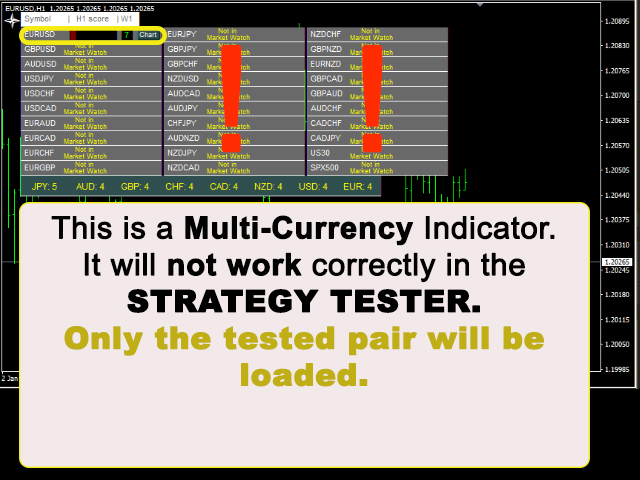
The Signal Strength Meter is a Multi-Currency, Dual Timeframe Interactive Indicator, which calculates the strength of buy and sell signals, and displays a score for each symbol on a display board.
Check Video Below For Complete Demonstration, and User Manual here.
Key Features:
- Allows you to see multiple currency signals from one chart
- Analyses the signals from more than a dozen classic indicators
- Identifies Candlestick patterns which are used in the calculation of the signals
- Get a currency strength score for individual currencies (ex: USD, EUR, JPY...)
- Returns a score of the signal strength for two different timeframes
- Offers an interactive interface so you could do everything from the chart
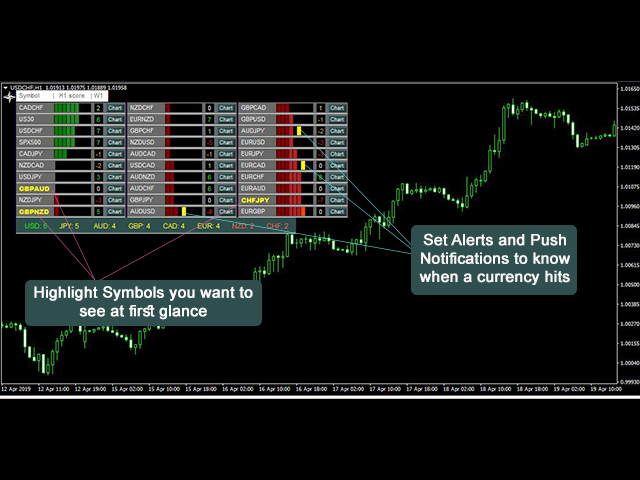
- Sends Alerts and Push Notifications
You could load the Signal Strength Meter onto a single chart, and be able to see the strength of the buys/sells signals across all selected currencies.
It replaces you having to load all the charts and attach dozens of indicators onto them. You could get a lot of information with a single glance, and decide which symbols you want to trade.
User Manual: https://www.mql5.com/en/blogs/post/727547
IN ORDER TO REDUCE THE WORKLOAD OF THE INDICATOR, IT IS VERY IMPORTANT TO GO TO TOOLS>OPTIONS>CHARTS AND REDUCE THE "MAX BARS IN CHART" NUMBER. I RECOMMEND SETTING IT AROUND 1500-2500.
Settings:
HigherTimeFrame: Lets you set the higher timeframe whose scores are displayed in the small square boxes.
extraSymbols: The main 28 pairs included in the indicator are:
| EURUSD | AUDUSD | USDJPY | USDCHF | USDCAD | EURAUD | EURCAD |
| GBPUSD | EURCHF | EURGBP | EURJPY | GBPJPY | GBPCHF | NZDUSD |
| AUDCAD | AUDJPY | CHFJPY | AUDNZD | NZDJPY | NZDCAD | NZDCHF |
| GBPNZD | EURNZD | GBPCAD | GBPAUD | AUDCHF | CADCHF | CADJPY |
You could also add more symbols by adding them in the "extraSymbols" input, seperated by commas. By default, the symbols "us30,spx500" are added, but you could add more symbols to them, replace them with other symbols, or delete all extra symbols.
DisableAlertResetNotice: true/false. If true, you will not get the "SSM ALERTS RESTARTED" alert every time you reload the indicator.
HorizontalShift: Set a horizontal shift in pixel of the main dashboard.
For Technical Parameters, check out User Manual.
Interactive Features: (Notice that these features don't work if you are offline, or if the market is closed)
- To move the dashboard, you could either set shifts in the input settings, or you could double click the white cross on the top left corner of the dashboard, and move it to where you want the dashboard to be. (There might be a delay before the whole dashboard moves because it is redrawn once there is a new tick)
- You could highlight a symbol you want to follow simply by clicking on it
- You could set a score as a trigger for an alert and/or a push notification by clicking on that score in the black rectangle containing the coloured bars
►Write an honest review of the indicator
►and send me a proof of purchase to admin@nelhajj.com
►and get a free MA Scanner a multi-currency multi-timeframe dashboard scanner of moving averages
Youtube Channel: nelhajj trading


Good work is very helpful.