• 미리보기
  • 리뷰 (2)
  • 코멘트

AMA Adaptive Moving Average Alerts Serie MT4

5

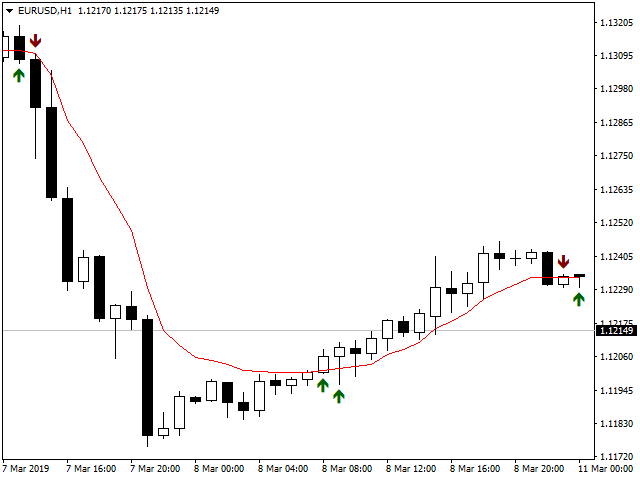
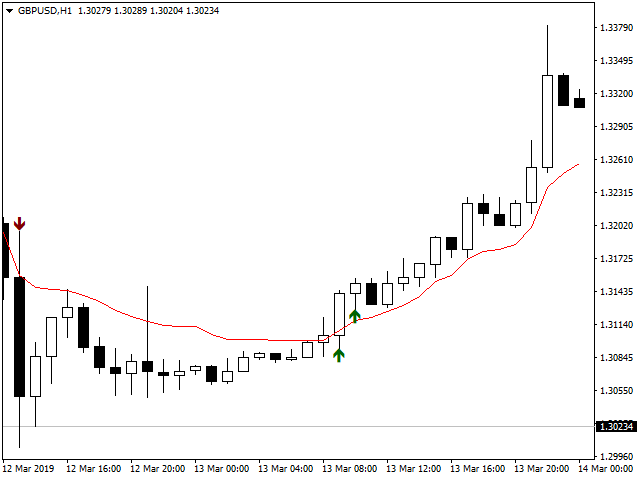
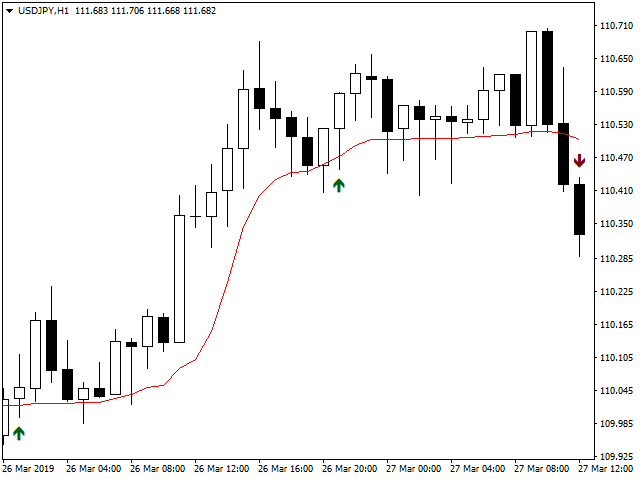
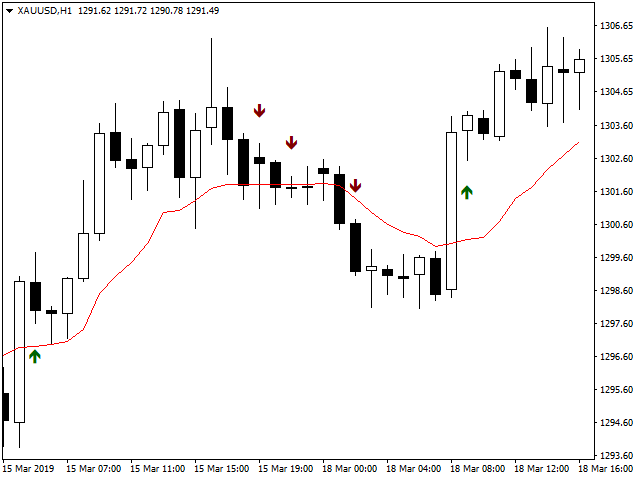
Signals and Alerts for AMA (Adaptive Moving Average) indicator based on these MQL5 posts: Adaptive Moving Average (AMA) and Signals of the Indicator Adaptive Moving Average.

Note: this tool is based on the code of AMA indicator developed by MetaQuotes Software Corp.


Features

  • The signals are triggered at closing of last bar/opening of a new bar;
  • Any kind of alerts can be enabled: Dialog Box, Email message, SMS notifications for smartphones and tablets, and Sound alerts;
  • Customizable arrows. By default, up arrows are plotted for buying signals and down arrows for selling signals;
  • It works properly at any symbol (no matter how exotic it is) and any timeframe;
  • Compatible with any MetaTrader platform, regardless of the number of digits or other parameters;
  • Compatible with any other tool (indicator, EA or script) without slowing down the terminal performance and the trading operations.


Indicator parameters

  • Arrow Relative Distance - set arrows' distance.
  • Buy/Sell Arrow Code - arrow code from Wingdings font or predefined arrow constant.
  • Enable dialog box - if 'true' enables pop-up alerts.
  • Send email - if 'true' an email message will be sent.
  • Push notification - if 'true' a push notification will be sent to mobile terminals.
  • Play sound - if 'true' a sound will be played.
  • Sound file - selects the sound that will be used by the sound alert.


Report a bug

In case you find any issue related to the program functioning, do not hesitate to submit a report here. Notice that we cannot help you with problems related to your purchases. For these kinds of issues, you must contact MQL5 service desk.


More helpful tools

Find here more indicators with 'Alerts serie' denomination. We'll keep launching new indicators for both MT4 & MT5 with alert features implemented at a low cost. Feel free to ask for any specific indicator that you want to improve with alert features sending us an email to support.team@barmenteros.com with the subject "Request for alerts serie indicator". But don't forget firstly to check if your requirements are not already fulfilled in one of the released indicators.


About Us

We are a team of coders/traders that provide professional programming services for the trading world, mostly —but not only— for MetaTrader platform. Our team has several years of trading the FOREX market and coding MetaTrader tools. We have developed Scripts, Indicators and Expert Advisors for many clients around the world and for our own use.


리뷰 2
KingdomCome
548
KingdomCome 2023.02.25 22:27 
 

GOOD INDICATOR IF YOU CAN FIND A WAY TO FILTER YOUR TRADES

Boaz
88
Boaz 2021.11.27 13:44 
 

Excellent!!

추천 제품
WPR Breakout SW
Mohamed Hassan Mohamed Hassan Alsherbiny
When prices breakout resistance levels are combined with Larry Williams' Percent Range oscillator "WPR" breaks out its historical resistance levels then higher chances emerges to record farther prices. It's strongly encouraged to confirm price breakout with oscillator breakout since they have comparable effects to price breaking support and resistance levels; certainly short trades will have the same perception. Concept is based on find swing levels which based on number of bars by each side to
FREE
Average Price
Alexandr Ivanov
The Average Price indicator calculates the average prices of BUY (LONG) and SELL (SHORT) open positions, taking into account the size of open positions, commissions and swaps. The indicator builds the average line of LONG open positions, after crossing which, from the bottom up, the total profit for all LONG positions for the current instrument becomes greater than 0. The indicator builds the average line of SHORT open positions, after crossing which, from top to bottom, the total profit f
Two Lines Color II
Cristobal Hidalgo Soriano
Nombre del Indicador: Two Lines Color II Descripción: El indicador "Two Lines Color II", desarrollado por 13 Crow Trading Club, es una versión más rápida de su predecesor, el "Two Lines Color 1". Este indicador ha sido diseñado para brindar señales aún más tempranas sobre posibles cambios de tendencia en el mercado financiero. Características Principales: Mayor Velocidad de Señales: Two Lines Color II ofrece señales más rápidas en comparación con su versión anterior. La rápida velocidad de las s
FREE
Defines extremes. This indicator consists of two parts. The first draws lines on the chart indicating low volatility in relative daily market activity. The second is responsible for determining the extremum and gives signals to buy or sell. This system is suitable for all instruments. It is recommended to use a timeframe from m15 to h4. Before using, you need to choose the settings for yourself. Configure lines deviation. Specify volatility coefficient. Advantages The indicator does not repaint
FREE
It predicts the most likely short-term price movement based on advanced mathematical calculations. Features Estimation of immediate price movement; Calculation of the real market trend; Calculation of the most important support and resistance levels; Algorithms optimized for making complex mathematical calculations with a minimal drain of system resources; Self-adjusting for better performance, so it’s able to work properly at any symbol (no matter how exotic it is) and any timeframe; Compatib
FREE
RSX Signal 2 AM
Andriy Matviyevs'kyy
The indicator displays the signals of the RSX oscillator on the price chart. (To display these signals in a separate window, along with the oscillator, another indicator is used -  RSX Osc 4 AM ). It is optimal to use the indicator signals as signals to open a trade when the price overcomes the maximum or minimum of the bar at which the signal was given. An opposite signal cancels the previous signal. Settings: Data period for indicator calculation - data period for indicator calculation; Data
FREE
COG LR Osc AM
Andriy Matviyevs'kyy
The presented indicator allows you to determine potential entry points into the market and set protective orders at reasonable levels. This product can be useful for both beginners and experienced traders. The indicator is based on calculation methods proven by time and practicing traders. The indicator is calculated in two stages: At the first stage, linear regression (LR) of the selected price type is determined for a given number of chart periods. At the second stage, the obtained data is p
FREE
TrendPlus
Sivakumar Subbaiya
4.21 (14)
Trend Plus   Trendplus  Indicator   Time Frame: Suitable for any time frame.  Purpose: Trend Prediction. Blue and red candle indicate the buy and sell call respectively. Buy: When the blue candle is formed buy call is initiated. close the buy trades when the next red candle will formed.   Sell: When the Red candle is formed Sell call is initiated. close the Sell trades when the next blue candle will formed.   Happy trade!!
FREE
Necessary for traders: tools and indicators Waves automatically calculate indicators, channel trend trading Perfect trend-wave automatic calculation channel calculation , MT4 Perfect trend-wave automatic calculation channel calculation , MT5 Local Trading copying Easy And Fast Copy , MT4 Easy And Fast Copy , MT5 Local Trading copying For DEMO Easy And Fast Copy , MT4 DEMO Easy And Fast Copy , MT5 DEMO Advanced Bollinger Bands: 1. The Bollinger rail will change color with the direction" 2. T
FREE
UPD1 X00 Levels
Vitaliy Kuznetsov
4.92 (12)
인디케이터는 차트의 라운드 레벨을 보여줍니다. 심리적, 뱅킹 또는 주요 플레이어 레벨이라고도 합니다. 이 수준에서 황소와 곰 사이에 실제 싸움이 있고 많은 주문이 누적되어 변동성이 증가합니다. 표시기는 모든 악기와 기간에 따라 자동으로 조정됩니다. 80레벨을 돌파하고 테스트를 하면 구매합니다. 20레벨 돌파 후 테스트 하면 판매합니다. 목표는 00입니다. 주목. 강력한 지원 및 저항 수준으로 인해 가격이 00 수준을 약간 놓칠 수 있습니다. 입력 매개변수. Bars Count - 라인 길이. Show 00 Levels - 00 레벨을 표시하거나 표시하지 않음. Show 10, 90 Levels. Show 20, 80 Levels. Show 30, 70 Levels. Show 40, 60 Levels. Show 50 Levels. N Lines - 차트의 레벨 수를 제한하는 매개변수. Distance 00 Levels - 레벨 사이의 거리(자동 또는 수동). Line Posi
FREE
FATL Candles 2 AM
Andriy Matviyevs'kyy
This indicator displays candle prices on the chart, colored in accordance with the data of the FATL digital filter built on closing prices. The indicator has no configurable parameters. Allows you to effectively follow the short-term trend. Usage: After the full formation of a candle colored in the opposite color to the previous candle, place a stop order at the high / low of such a candle. When the price overcomes such a high/low, a position will be opened. With the full formation of a candle p
FREE
Geo Fractals
Georgij Komarov
5 (1)
This is professional fractals indicator able to work "on several screens" while on a single chart. The product has been developed for scalpers and those relying on "accurate" entries. The indicator shows fractals from six timeframes and displays the distance between the price and a new emerging fractal on lower timeframes showing the price behavior more clearly and making its analysis more accurate on reversal points. The indicator displays fractals from the D1, H4, H1, M15, M5 and M1 timeframes
Nice Trade Point
Muhammed Emin Ugur
This    Nice Trade Point     indicator is designed for signal trading. This indicator generates trend signals. It uses many algorithms and indicators to generate this signal. It tries to generate a signal from the points with the highest trend potential. This indicator is a complete trading product. This indicator does not need any additional indicators. The indicator certainly does not repaint. The point at which the signal is given does not change.     Features and Suggestions Time
Description The base of this indicator is an ZigZag algorithm based on ATR and Fibo retracement. This indicator is not redrawing in sense that the ZigZag's last shoulder is formed right after the appropriate conditions occur on the market. The shoulder doesn't change its direction afterwards (can only continue). Note:  An indicator with advanced possibilities is also available. Indicator input parameters The input parameters allow to change the sensitivity of the ZigZag. ATR period ATR mul
FREE
Major Support and Resistance Indicator
Ahmad Ar Abedalaziz Alazaizeh
5 (1)
This indicator filters the Zigzag indicator to calculate the main support and resistance levels. Variables minimum gap between peaks : is the distance (GAP) between the peaks of the Zigzag peaks sensitivity : Minimum number of nearby peaks look back: it means that it has to test the last 50 peaks in the Zigzag object name perfix: a prefix for level’s line name on chart
FREE
Extremum by trend
Anton Iudakov
5 (1)
Looking for entry points along the local trend without repaint! Arrows indicate entry points. Based on classic indicators. The indicator is easy to use. Settings Наименование Описание Frequency factor Signal frequency. The less, the more often. This affects the quality. Recommendations Recommended for use on major currency pairs. Timeframe from m5, m15, m30 Subscribe to my telegram channel, where we discuss intraday trading, ideas, indicators, etc., a link in my profile contacts.
FREE
ZigZag Trend Channels indicator is designed to find channel trends. This indicator uses the zigzag indicator, some channel lines and some algorithms. This indicator also sends signal warnings for processing entry points. Up trend, down trend and triangle trend formations. Easy to use and understandable. Channel lines appear on the screen and trend forms are written. Suggestions and Features This indicator has 3 trend features. They are up trend, down trend and triangle trend formations. This i
Deviation Index
Francisco De A Vilar Enriquez
Normalized indicator. It measures the relative deviation of the price from its moving average. It is extremely reliable. Accurately determine overbought and oversold price areas and divergences. Features. The indicator has a range of -100 to 100. The overbought zone is above 80 and the oversold zone is below -80. Zones of overvalue, indicate possible reversal. Mode: histogram/line. MA method: simple, exponential, smoothed, linear weighted. By default, the indicator is calculated on an SMA of
FREE
Peak Trough Analysis is the great tool to detect peaks and troughs in your chart. Peak Trough Analysis tool can use three different peaks and troughs detection algorithm. The three algorithm include the orignal Fractals Indicator by Bill Williams, the Modified Fractals indicator and ZigZag indicator. You can use this peak and trough analysis tool to detect the price pattern made up from Equilibrium Fractal-Wave process. For further usage, there are good guide line on how to use this peak trough
FREE
RCCMA is a general moving average indicator that works with ReviewCandleChart. Original is "Custom Moving Average" provided by MetaQuotes Software Corp. Based on that source code, I corresponded to ReviewCandleChart . Advantages When ReviewCandleChart is ON, no line will be displayed on the right side from the vertical reference line. When ReviewCandleChart is ON and you press a key such as "Z" or "X" Following that, the MA is drawn. When ReviewCandleChart is OFF, the same drawing as the origi
FREE
Color Macd Tf
Syarif Nur Arief
MACD is well known indicator that still can be use for prediction where price will go next few minutes, hours or even weekly  With colored bar of Macd, your eyes can easily catch when color is changed based what market price movement to find any early trend on market. here is the parameter of the indicator: TF_MACD , default is 1 Hour , this mean you can see clearly MACD of 1 Hour TimeFrame on Lower TimeFrame. InpPrice , default is Price Close , this is original MACD parameter from Metaquotes st
FREE
Profit Trade
Aleksey Ivanov
The principle of constructing indicator lines .               Profit Trade  indicator is very effective for trading. Profit Trade  is a deep development of the well-known Donchian channel  indicator. The upper (BlueViolet color) Dup and the lower (IndianRed) Ddn lines of the indicator are constructed in the same way as in the Donchian channel , based on the highest (high of High) and lowest (low of Low) prices for the previous n1 = 20 periods. The middle line (Gold) Dm is constructed in the sam
MQLTA Bollinger Bands Breakout Alert
MQL4 Trading Automation
4 (4)
Bollinger Bands Breakout Alert is a simple indicator that can notify you when the price breaks out of the Bollinger Bands. You just need to set the parameters of the Bollinger Bands and how you want to be notified. Parameters: Indicator Name - is used for reference to know where the notifications are from Bands Period - is the period to use to calculate the Bollinger Bands Bands Shift - is the shift to use to calculate the Bollinger Bands Bands Deviation - is the deviation to use to calculate
FREE
The indicator analyzes the change in the minimum and maximum prices of the previous bars fixing the entrance of the big players. If the change (delta) increases, a signal is displayed on the graph in the form of an arrow. At the same time, virtual trade on history is carried out. In the free version, virtual trade is performed without refills in case of a repeat of the signal. The results of virtual trading in the form of losses / losses, profitability, drawdown and transaction lines are display
FREE
RSI Breakout SW
Mohamed Hassan Mohamed Hassan Alsherbiny
When prices breakout resistance levels are combined with Relative Strength Index oscillator "RSI" breaks out its historical resistance levels then higher chances emerges to record farther prices. It's strongly encouraged to confirm price breakout with oscillator breakout since they have comparable effects to price breaking support and resistance levels; certainly short trades will have the same perception. Concept is based on find swing levels which based on number of bars by each side to confir
FREE
CCI Colored
Zaky Hamdoun
Introduction and Description The commodity channel index (CCI) is an oscillator originally introduced by Donald Lambert in 1980. Since its introduction, the indicator has grown in popularity and is now a very common tool for traders in identifying cyclical trends not only in commodities but also equities and currencies. The CCI can be adjusted to the timeframe of the market traded on by changing the averaging period.  CCI indicator with different colors at levels 0, 100 and -100. The cross is a
FREE
Mr Beast Indicator
Luis Mariano Vazquez Marcos
Indicador Gratuito desarrollado por Mr Beast Inversiones Mr Beast : Gestión de riesgo profesional. Brindo a la comunidad la entrada a productos de M Beast. Echar un vistazo a mis señales y expert advisors. Descuentos de hasta 70% Diclaimer: La negociación en Forex, CFD y Opciones conlleva un riesgo de pérdida sustancial y no es adecuada para todos los inversores. El alto grado de apalancamiento puede actuar en su contra y también en su favor, Antes de decidirse a operar en productos tan apalanca
FREE
RSI vs Envelopes Graph
Yurij Izyumov
3 (3)
This semaphore indicator is based in the standard RSI, which is applied over the Envelopes indicator that shows an envelope or envelope fluctuation borders. This is a version of RSI vs Envelopes drawn in the symbol window . A sell signal emerges when the upper envelope/border is broken by the RSI indicator from top to bottom. A buy signal emerges when the lower envelope/border is broken by the RSI indicator from bottom upwards. The indicator can draw arrows on the indicator, draw vertical lines
FREE
Hma Vvm Hull
Valerij Mazurenko
Hma Vvm Hull은 모든 시장에서 작동하는 전문 지표이며 통화 쌍을 거래할 때 특히 효과적이며 추세를 변경하는 초기 추세를 보여줍니다. 표시기에는 다양한 거래 방법 및 거래 전략과 함께 성공적으로 사용할 수 있는 많은 설정이 있습니다. 하나의 차트에 매개변수가 다른 여러 지표를 설치할 수 있습니다. 다양한 맞춤형 알림을 통해 거래자는 항상 시장 상황을 제어하고 적시에 시장에 대한 올바른 진입점을 찾을 수 있습니다. 지표를 사용하면 수익성 있는 거래의 수를 크게 늘릴 수 있음을 알 수 있습니다. 지표와 거래하는 세 가지 주요 방법이 있습니다. 1. 가격이 표시선을 돌파한 직후에 포지션을 엽니다. 2. 첫 번째 롤백에서 라인 재도색 신호를 받은 후 시장에 진입합니다. 3. 추세를 따라 모든 후속 풀백에 대한 항목. 설정: TimeFrame - 시간 프레임 설정. 현재 - 현재 TF. 또한, 1분에서 1개월까지. TimeFrameAuto - 더 높은 시
이 제품의 구매자들이 또한 구매함
Gann Made Easy
Oleg Rodin
4.88 (97)
Gann Made Easy 는 mr.의 이론을 사용하여 최고의 거래 원칙을 기반으로 하는 전문적이고 사용하기 쉬운 Forex 거래 시스템입니다. W.D. 간. 이 표시기는 Stop Loss 및 Take Profit Levels를 포함하여 정확한 BUY 및 SELL 신호를 제공합니다. PUSH 알림을 사용하여 이동 중에도 거래할 수 있습니다. 구매 후 연락주세요! 내 거래 팁과 훌륭한 보너스 지표를 무료로 공유하겠습니다! 아마도 Gann 거래 방법에 대해 이미 여러 번 들었을 것입니다. 일반적으로 Gann의 이론은 초보자 거래자뿐만 아니라 이미 거래 경험이 있는 사람들에게도 매우 복잡한 것입니다. Gann의 거래 방식은 이론적으로 적용하기 쉽지 않기 때문입니다. 나는 그 지식을 연마하고 Forex 지표에 최고의 원칙을 적용하기 위해 몇 년을 보냈습니다. 표시기는 적용하기가 매우 쉽습니다. 차트에 첨부하고 간단한 거래 권장 사항을 따르기만 하면 됩니다. 지표는 지속적으로 시장 분석 작업
Atomic Analyst
Issam Kassas
5 (3)
우선적으로 언급할 점은이 거래 지표가 다시 그리지 않고 지연되지 않으며 이를 통해 수동 및 로봇 거래 모두에 이상적이라는 점입니다. 사용자 매뉴얼: 설정, 입력 및 전략. Atomic Analyst는 가격의 강도와 모멘텀을 활용하여 시장에서 더 나은 이점을 찾는 PA Price Action Indicator입니다. 고급 필터를 장착하여 잡음과 거짓 신호를 제거하고 거래 잠재력을 높이는 데 도움이 됩니다. 복잡한 지표의 다중 레이어를 사용하여 Atomic Analyst는 차트를 스캔하고 복잡한 수학적 계산을 간단한 신호와 색상으로 변환하여 초보 트레이더가 이해하고 일관된 거래 결정을 내릴 수 있도록합니다. "Atomic Analyst"는 새로운 및 경험이 풍부한 트레이더를위한 종합적인 거래 솔루션입니다. 프리미엄 지표와 최고 수준의 기능을 하나의 거래 전략에 결합하여 모든 종류의 트레이더에 대한 다재다능한 선택지가되었습니다. 인트라데이 거래 및 스캘핑 전략 : 빠르고 정확한
Trend Pulse
Mohamed Hassan
5 (4)
Please contact me after purchase to immediately get your PDF strategy + documentation for Trend Pulse !  Official release price of $89  ( 3 /50 copies left). Next price is $199 . Introducing Trend Pulse , a unique and robust indicator capable of detecting bullish, bearish, and even ranging trends! Trend Pulse uses a special algorithm to filter out market noise with real precision. If the current symbol is moving sideways, Trend Pulse will send you a ranging signal, letting you know that it
Scalper Inside PRO
Alexey Minkov
4.75 (60)
An exclusive indicator that utilizes an innovative algorithm to swiftly and accurately determine the market trend. The indicator automatically calculates opening, closing, and profit levels, providing detailed trading statistics. With these features, you can choose the most appropriate trading instrument for the current market conditions. Additionally, you can easily integrate your own arrow indicators into Scalper Inside Pro to quickly evaluate their statistics and profitability. Scalper Inside
Trend Punch
Mohamed Hassan
4.91 (22)
This indicator is unstoppable when combined with our other indicator called  Support & Resistance . After purchase, send us a message and you will get it   for  FREE as a BONUS! Introducing Trend Punch , the revolutionary forex trend indicator that will transform the way you trade! Trend Punch is uniquely designed to provide precise buy and sell arrows during strong market trends, making your trading decisions clearer and more confident. Whether you're trading major currency pairs or exotic sym
Gold Stuff
Vasiliy Strukov
4.9 (269)
Gold Stuff는 금을 위해 특별히 설계된 추세 지표이며 모든 금융 상품에서도 사용할 수 있습니다. 표시기가 다시 그려지지 않고 지연되지 않습니다. 권장 기간 H1. 표시기에서 완전 자동 Expert Advisor EA Gold Stuff를 작동합니다. 내 프로필에서 찾을 수 있습니다. 설정 및 개인 보너스를 받으려면 구매 후 즉시 저에게 연락하십시오!   강력한 지원 및 트렌드 스캐너 표시기의 무료 사본을 받으실 수 있습니다. 메시지를 보내주세요. 나!   설정 화살표 그리기 - 켜기 끄기. 차트에 화살표 그리기. 경고 - 가청 경고를 끕니다. 이메일 알림 - 켜기 끄기. 이메일 알림. Puch-notification - 켜기 끄기. 푸시 알림. 다음으로 색 영역을 조정합니다. Gold Stuff는 금을 위해 특별히 설계된 추세 지표이며 모든 금융 상품에서도 사용할 수 있습니다. 표시기가 다시 그려지지 않고 지연되지 않습니다. 권장 기간 H1. 표시기에서 완
Advanced Currency Strength28 Indicator
Bernhard Schweigert
4.91 (667)
현재 26% 할인 초보자 또는 전문가 트레이더를 위한 최고의 솔루션! 이 지표는 우리가 독점 기능과 새로운 공식을 통합했기 때문에 독특하고 고품질이며 저렴한 거래 도구입니다. 단 하나의 차트로 28 Forex 쌍의 통화 강도를 읽을 수 있습니다! 새로운 추세 또는 스캘핑 기회의 정확한 트리거 포인트를 정확히 찾아낼 수 있기 때문에 거래가 어떻게 개선될지 상상해 보십시오. 사용 설명서: 여기를 클릭  https://www.mql5.com/en/blogs/post/697384 그것이 첫 번째, 원본입니다! 쓸모없는 지망생 클론을 사지 마십시오. 더 스페셜  강력한 통화 모멘텀을 보여주는 하위 창의 화살표 GAP가 거래를 안내합니다! 기본 또는 호가 통화가 과매도/과매도 영역(외부 시장 피보나치 수준)에 있을 때 개별 차트의 기본 창에 경고 표시가 나타납니다. 통화 강도가 외부 범위에서 떨어질 때 풀백/반전 경고. 교차 패턴의 특별 경고 추세를 빠르게 볼 수 있는
Currency Strength Wizard
Oleg Rodin
4.92 (51)
통화 강도 마법사는 성공적인 거래를 위한 올인원 솔루션을 제공하는 매우 강력한 지표입니다. 표시기는 여러 시간 프레임의 모든 통화 데이터를 사용하여 이 또는 해당 외환 쌍의 힘을 계산합니다. 이 데이터는 특정 통화의 힘을 확인하는 데 사용할 수 있는 사용하기 쉬운 통화 지수 및 통화 전력선의 형태로 표시됩니다. 필요한 것은 거래하려는 차트에 표시기를 부착하는 것뿐입니다. 표시기는 거래하는 통화의 실제 강세를 보여줍니다. 지표는 또한 추세와 거래할 때 유리하게 사용할 수 있는 구매 및 판매 거래량 압력의 극한값을 보여줍니다. 지표는 또한 피보나치에 기반한 가능한 대상을 보여줍니다. 표시기는 PUSH 알림을 포함한 모든 유형의 알림을 제공합니다. 구매 후 연락주세요. 나는 당신과 거래 팁을 공유하고 당신에게 무료로 훌륭한 보너스 지표를 줄 것입니다! 나는 당신에게 행복하고 유익한 거래를 기원합니다!
FX Power MT4 NG
Daniel Stein
5 (12)
모닝 브리핑 여기 mql5 와 텔레그램에서 FX Power MT4 NG 는 오랫동안 인기 있는 통화 강도 측정기인 FX Power의 차세대 버전입니다. 이 차세대 강도 측정기는 무엇을 제공합니까? 기존 FX Power에서 좋아했던 모든 것 PLUS GOLD/XAU 강도 분석 더욱 정밀한 계산 결과 개별 구성 가능한 분석 기간 더 나은 성능을 위한 사용자 정의 가능한 계산 한도 특별 멀티더 많은 것을보고 싶은 사람들을위한 특별한 다중 인스턴스 설정 모든 차트에서 좋아하는 색상을위한 끝없는 그래픽 설정 수많은 알림 옵션, 중요한 것을 다시는 놓치지 않도록 Windows 11 및 macOS 스타일의 둥근 모서리가 있는 새로운 디자인 마법처럼 움직이는 인디케이터 패널 FX 파워 키 특징 모든 주요 통화의 완전한 강세 이력 모든 시간대에 걸친 통화 강세 이력 모든 브로커 및 차트에서 고유 계산 결과 100% 신뢰할 수있는 실시간100 % 신뢰할 수있는 실시간 계산-> 다시 칠하지 않음
Advanced Currency IMPULSE with ALERT
Bernhard Schweigert
4.91 (495)
현재 31% 할인!! 초보자 또는 전문가 트레이더를 위한 최고의 솔루션! 이 지표는 우리가 독점 기능과 비밀 공식을 통합했기 때문에 독특하고 고품질이며 저렴한 거래 도구입니다. 단 하나의 차트로 28개 통화 쌍 모두에 대한 경고를 제공합니다. 새로운 추세 또는 스캘핑 기회의 정확한 트리거 포인트를 정확히 찾아낼 수 있기 때문에 거래가 어떻게 개선될지 상상해 보십시오! 새로운 기본 알고리즘을 기반으로 구축되어 잠재적인 거래를 훨씬 더 쉽게 식별하고 확인할 수 있습니다. 이는 통화의 강세 또는 약세가 가속되는지 여부를 그래픽으로 표시하고 가속 속도를 측정하기 때문입니다. 자동차의 속도계처럼 생각하면 됩니다. 가속화할 때 Forex 시장에서 동일한 일이 분명히 더 빠르게 발생합니다. 즉, 반대 방향으로 가속화되는 통화를 페어링하면 잠재적으로 수익성 있는 거래를 식별한 것입니다. 통화 모멘텀의 수직선과 화살표가 거래를 안내합니다! 역동적인 Market Fibonacci 23
Order Block Hunter
Noha Mohamed Fathy Younes Badr
5 (1)
Order block hunter indicator is the best indicator for  hunt the order blocks that area where there has been a large concentration of limit orders waiting to be executed Order blocks are identified on a chart by observing previous price action and looking for areas where the price experienced significant movement or sudden changes in direction .This indicator does that for you by using very complicated codes and helps you to take the best areas To buy and sell because it make marks at the best a
현재 20% 할인 ! 초보자 또는 전문가 트레이더를 위한 최고의 솔루션! 이 대시보드 소프트웨어는 28개의 통화 쌍에서 작동합니다. 2가지 주요 지표(Advanced Currency Strength 28 및 Advanced Currency Impulse)를 기반으로 합니다. 전체 Forex 시장에 대한 훌륭한 개요를 제공합니다. 고급 통화 강도 값, 통화 이동 속도 및 모든(9) 시간대의 28 Forex 쌍에 대한 신호를 보여줍니다. 추세 및/또는 스캘핑 기회를 정확히 파악하기 위해 차트의 단일 지표를 사용하여 전체 시장을 볼 수 있을 때 거래가 어떻게 개선될지 상상해 보십시오! 잠재적인 거래를 식별하고 확인하면서 강력한 통화와 약한 통화를 더욱 쉽게 식별할 수 있도록 이 지표에 기능을 내장했습니다. 이 표시기는 통화의 강세 또는 약세가 증가 또는 감소하는지 여부와 모든 시간대에서 수행되는 방식을 그래픽으로 보여줍니다. 추가된 새로운 기능은 현재 시장 조건 변화에 적
우선적으로, 이 거래 도구는 전문적인 거래에 이상적인 비-다시 그리기 및 지연되지 않는 지표입니다.  온라인 강좌, 사용자 매뉴얼 및 데모. 스마트 가격 액션 컨셉트 인디케이터는 신규 및 경험 많은 트레이더 모두에게 매우 강력한 도구입니다. Inner Circle Trader Analysis 및 Smart Money Concepts Trading Strategies와 같은 고급 거래 아이디어를 결합하여 20가지 이상의 유용한 지표를 하나로 결합합니다. 이 인디케이터는 스마트 머니 컨셉트에 중점을 두어 대형 기관의 거래 방식을 제공하고 이동을 예측하는 데 도움을 줍니다.  특히 유동성 분석에 뛰어나 기관이 어떻게 거래하는지 이해하는 데 도움을 줍니다. 시장 트렌드를 예측하고 가격 변동을 신중하게 분석하는 데 탁월합니다. 귀하의 거래를 기관 전략에 맞추어 시장의 동향에 대해 더 정확한 예측을 할 수 있습니다. 이 인디케이터는 시장 구조를 분석하고 중요한 주문 블록을 식별하고 다양한
Enigmera
Ivan Stefanov
5 (4)
에니메라: 시장의 핵심 https://www.enigmera.com 소개 이 지표 및 트레이딩 시스템은 금융 시장에 대한 놀라운 접근 방식입니다. 에니메라는 프랙탈 주기를 사용하여 지지선과 저항선을 정확하게 계산합니다. 진정한 축적 단계를 보여주고 방향과 목표를 제시합니다.  추세에 있든 조정에 있든 작동하는 시스템입니다.  어떻게 작동하나요? 에니메라는 지지선/저항선, 목표선, 편차선의 세 가지 라인으로 구성됩니다. 이 시스템은 과거 데이터를 현재와 미래로 추정하는 일반적인 시장 지표와 달리 현재에 대한 완전한 그림을 제공합니다. 지지선 위에 있으면 실제 지지를 의미하고 저항선 위에 있으면 실제 저항을 의미합니다. 레벨이 깨지면 추세의 변화를 나타냅니다. 다시 그리지 않습니다. 시장이 지속적으로 진화함에 따라 에니메라는 평가 도구를 조정하여 전략을 정기적으로 수정합니다.   이를 통해 모든 시나리오를 철저히 평가할 수 있습니다. 이 시장 지표의 고유성은 분명하며 그 기
Scalper Vault
Oleg Rodin
5 (29)
Scalper Vault 는 성공적인 스캘핑에 필요한 모든 것을 제공하는 전문 스캘핑 시스템입니다. 이 표시기는 외환 및 바이너리 옵션 거래자가 사용할 수 있는 완전한 거래 시스템입니다. 권장 시간 프레임은 M5입니다. 시스템은 추세 방향으로 정확한 화살표 신호를 제공합니다. 또한 상단 및 하단 신호와 Gann 시장 수준을 제공합니다.  이 시스템은 사용하기가 매우 쉽습니다. 원하는 시장 지역의 화살표만 따라가면 됩니다. 엑시트는 가격이 적정 수준에 도달하거나 시장의 고점 또는 저점 신호가 나타날 때 수행됩니다.  표시기는 PUSH 알림을 포함한 모든 유형의 경고를 제공합니다. 인디케이터 구매 후 연락주세요. 내 개인 거래 권장 사항과 훌륭한 보너스 지표를 무료로 공유합니다! 나는 당신에게 행복하고 유익한 거래를 기원합니다!
Trend Screener
STE S.S.COMPANY
4.82 (93)
트렌드 표시기, 트렌드 트레이딩 및 필터링을 위한 획기적인 고유 솔루션, 하나의 도구 안에 내장된 모든 중요한 트렌드 기능! Forex, 상품, 암호 화폐, 지수 및 주식과 같은 모든 기호/도구에 사용할 수 있는 100% 다시 칠하지 않는 다중 시간 프레임 및 다중 통화 표시기입니다. Trend Screener는 차트에 점이 있는 화살표 추세 신호를 제공하는 효율적인 지표 추세 추종 지표입니다. 추세 분석기 표시기에서 사용할 수 있는 기능: 1. 트렌드 스캐너. 2. 최대 이익 분석이 있는 추세선. 3. 추세 통화 강도 측정기. 4. 경고가 있는 추세 반전 점. 5. 경고가 있는 강력한 추세 점. 6. 추세 화살표 Trend Screener Indicator가 있는 일일 분석 예, 일일 신호 성능...등은 여기에서 찾을 수 있습니다.   여기를 클릭하십시오. LIMITED TIME OFFER : Trend Screener Indicator는 50 $ 및 평생 동안만 사용할 수 있
PZ Day Trading
PZ TRADING SLU
3.67 (3)
Effortless trading: non-repainting indicator for accurate price reversals Special Offer: Purchase now to receive free bonuses worth $189! (Read more for details) This indicator detects price reversals in a zig-zag fashion, using only price action analysis and a donchian channel. It has been specifically designed for short-term trading, without repainting or backpainting at all. It is a fantastic tool for shrewd traders aiming to increase the timing of their operations. [ Installation Guide | Up
- Real price is 80$ - 50% Discount ( It is 39$ now ) Contact me for instruction, any questions! Introduction The breakout and retest strategy is traded support and resistance levels. it involves price breaking through a previous level.  The break and retest strategy is designed to help traders do two main things, the first is to avoid false breakouts. Many false breakouts start with a candlestick that breaks out of a level but ends with an immediate candlestick that brings the price back into t
Gold Channel XAUUSD
Paulo Rocha
5 (2)
Gold Channel is a volatility-based indicator, developed with a specific timing algorithm for the XAUUSD pair, which consists of finding possible corrections in the market. This indicator shows two outer lines, an inner line (retracement line) and an arrow sign, where the theory of the channel is to help identify overbought and oversold conditions in the market. The market price will generally fall between the boundaries of the channel. If prices touch or move outside the channel it is a tra
Apollo Pips PLUS SP
Oleg Rodin
5 (3)
제품을 구매하기 전에 아래 정보를 읽어보세요! Apollo Pips PLUS SP는 독특한 제품입니다! 모든 거래 지표에 액세스할 수 있는 새로운 "APOLLO PIPS" 지표와 "슈퍼 팩" 보너스를 받고 싶은 분들을 위한 것입니다! Apollo Pips PLUS SP 제품을 구매하면 실제로 Apollo Pips 표시기의 완전히 새로운 버전을 구매하게 됩니다. 이 버전의 지표에는 개선된 알고리즘과 사용하기 쉬운 매개변수가 있어 모든 시장 및 거래 스타일에서 지표를 사용할 수 있는 기회를 제공합니다. 이 제품의 구매자는 슈퍼 보너스로 다른 모든 표시기에 무료로 액세스할 수 있습니다! 내 모든 거래 도구에 액세스하고 싶었다면 이 제품이 당신에게 딱 맞습니다! :) 하지만 이것이 전부는 아닙니다! :) 이 제품의 모든 구매자는 또한 내 새로운 지표를 무료로 받을 자격이 있습니다! :) 새로운 거래 지표를 사용할 수 있게 되었는데, 귀하는 저의 특별한 "SUPER PACK" 평생 보너스
RelicusRoad Pro
Relicus LLC
4.73 (141)
이제 $ 147 (몇 가지 업데이트 후 $ 499 증가) - 무제한 계정 (PCS 또는 MACS) RelicusRoad 사용 설명서 + 교육 비디오 + 비공개 Discord 그룹 액세스 + VIP 상태 시장을 보는 새로운 방법 RelicusRoad는 외환, 선물, 암호화폐, 주식 및 지수에 대한 세계에서 가장 강력한 거래 지표로서 거래자에게 수익성을 유지하는 데 필요한 모든 정보와 도구를 제공합니다. 우리는 초보자부터 고급까지 모든 거래자가 성공할 수 있도록 기술적 분석 및 거래 계획을 제공합니다. 미래 시장을 예측할 수 있는 충분한 정보를 제공하는 핵심 거래 지표입니다. 우리는 차트에서 말이 안 되는 여러 지표 대신 완전한 솔루션을 믿습니다. 타의 추종을 불허하는 매우 정확한 신호, 화살표 + 가격 조치 정보를 표시하는 올인원 표시기입니다. 강력한 AI를 기반으로 하는 RelicusRoad는 누락된 정보와 도구를 제공하여 교육하고 성공적인 트레이더인 트레이딩 전문
Advanced Supply Demand
Bernhard Schweigert
4.9 (314)
현재 33% 할인! 초보자나 전문 트레이더를 위한 최고의 솔루션! 이 보조지표는 우리가 다수의 독창적 기능과 새로운 공식을 통합한 독특하고 고품질이며 저렴한 거래 도구입니다. 이 업데이트를 통해 이중 시간대를 표시할 수 있습니다. 더 높은 TF를 표시할 수 있을 뿐만 아니라 차트 TF와 더 높은 TF 모두를 표시할 수 있습니다: 중첩 영역 표시. 모든 Supply Demand 트레이더들이 좋아할 것입니다. :) 중요한 정보 공개 Advanced Supply Demand의 잠재력을 극대화하려면 다음을 방문하십시오. https://www.mql5.com/ko/blogs/post/720245   진입 또는 목표의 명확한 트리거 포인트를 정확히 찾아냄으로 해서 거래가 어떻게 개선될지 상상해 보십시오. 새로운 알고리즘을 기반으로 매수자와 매도자 간의 잠재적인 불균형을 훨씬 더 쉽게 분간할 수 있습니다. 왜냐하면 가장 강한 공급영역과 가장 강한 수요 영역과 과거에 어떻게 진행 되었는지를(이
IX Power MT4
Daniel Stein
5 (6)
IX Power는 마침내 FX Power의 탁월한 정밀도를 외환이 아닌 기호에도 적용했습니다. 좋아하는 지수, 주식, 원자재, ETF, 심지어 암호화폐까지 단기, 중기, 장기 추세의 강도를 정확하게 파악할 수 있습니다. 단말기가 제공하는 모든 것을 분석할 수 있습니다. 사용해 보고 트레이딩 타이밍이 크게 향상되는 것을 경험해 보세요. IX Power 주요 특징 단말기에서 사용 가능한 모든 거래 심볼에 대해 100% 정확한 비재도장 계산 결과 제공 사전 구성 및 추가적으로 개별 구성 가능한 강도 분석 기간의 드롭다운 선택 가능 이메일, 메시지, 모바일 알림을 통한 다양한 알림 옵션 제공 EA 요청을 위한 액세스 가능한 버퍼 더 나은 성능을 위한 사용자 지정 가능한 계산 한도 더 많은 것을 보고 싶은 사용자를 위한 특별 다중 인스턴스 설정 모든 차트에서 좋아하는 색상을 위한 무한한 그래픽 설정 가능 Windows 11 및 macOS 스타일의 둥근 모서리를 가
맞춤형 MT4 지표로 성공적인 외환 거래에 대한 비밀을 발견하십시오! 외환 시장에서 성공을 달성하고 위험을 최소화하면서 일관되게 이익을 얻는 방법을 궁금해 한 적이 있습니까? 여기에 당신이 찾고 있던 답이 있습니다! 거래에 대한 귀하의 접근 방식을 혁신 할 독점적 MT4 지표를 소개 할 수 있습니다. 독특한 다양성 우리의 지표는 Renko 및 Rangebar Candle Formations를 선호하는 사용자를 위해 특별히 설계되었습니다. 우리는 이러한 차트 유형이 많은 숙련 된 거래자들이 선호한다는 것을 이해하기 때문에 우리의 지표가 그들과 완벽하게 통합되어 비교할 수없는 시장 분석을 제공합니다. 명확한 추세 신호 복잡한 분석을 잊어 버리십시오! 우리의 지표는 생생한 색상과 명확한 점 구조를 사용하여 시장 동향을 명확하게 나타냅니다. 빨간색과 파란색 점은 가격 이동 방향에 대해 의심의 여지가 없어 거래에서 빠른 의사 결정을 할 수 있습니다. HH/HL HL/LL
XQ Indicator MetaTrader 4
Marzena Maria Szmit
3.67 (3)
Step into the realm of Forex trading with confidence and precision using XQ, a cutting-edge Forex indicator designed to elevate your trading game to unprecedented heights. Whether you're a seasoned trader or just stepping into the world of currency exchange,   XQ Forex Indicator   empowers you with the insights and signals needed to make informed trading decisions. The signal conditions are a combination of three indicators, and XQ Forex Indicator only display  medium and long-term trends . The
M1 Arrow
Oleg Rodin
4.73 (15)
시장의 두 가지 기본 원칙에 기반한 일중 전략. 알고리즘은 추가 필터를 사용하여 거래량 및 가격 파동 분석을 기반으로 합니다. 지표의 지능형 알고리즘은 두 가지 시장 요인이 하나로 결합될 때만 신호를 제공합니다. 지표는 더 높은 시간 프레임의 데이터를 사용하여 M1 차트에서 특정 범위의 파도를 계산합니다. 그리고 파동을 확인하기 위해 지표는 볼륨 분석을 사용합니다. 이 표시기는 준비된 거래 시스템입니다. 트레이더가 필요로 하는 모든 것은 신호를 따르는 것입니다. 또한 지표는 자신의 거래 시스템의 기초가 될 수 있습니다. 거래는 분 차트에서만 수행됩니다. 지표가 MTF 원리를 사용한다는 사실에도 불구하고 지표 알고리즘은 가능한 한 안정적입니다. 구매 후 반드시 저에게 편지를 보내주세요! 내 거래 설정 및 권장 사항을 공유하겠습니다!
Automated Trendlines
Georgios Kalomoiropoulos
5 (17)
추세선은 외환 거래에서 기술적 분석의 가장 필수적인 도구입니다. 불행히도, 대부분의 거래자는 올바르게 그리지 않습니다. 자동 추세선 표시기는 시장의 추세 움직임을 시각화하는 데 도움이 되는 진지한 거래자를 위한 전문 도구입니다. 추세선 강세 추세선과 약세 추세선에는 두 가지 유형이 있습니다. 상승 추세에서 Forex 추세선은 가격 움직임의 가장 낮은 스윙 포인트를 통해 그려집니다. 최소 두 개의 "최저 저점"을 연결하면 추세선이 생성됩니다. 하락 추세에서 추세선은 가격 움직임의 가장 높은 스윙 포인트를 통해 그려집니다. 최소 두 개의 "최고 최고점"을 연결하면 추세선이 생성됩니다. 추세선이 깨질 때? 강세 추세선은 약세 양초가 강세 추세선 아래에서 닫히고 양초의 고점이 추세선 위에 있을 때 깨집니다. 약세 추세선은 강세 양초가 약세 추세선 위로 마감되고 양초 저점이 추세선 아래에 있을 때 깨집니다. 추세선이 삭제되면? 강세 추
Break and Retest
Mohamed Hassan
4.12 (17)
This Indicator only places quality trades when the market is really in your favor with a clear break and retest. Patience is key with this price action strategy! If you want more alert signals per day, you increase the number next to the parameter called: Support & Resistance Sensitivity.  After many months of hard work and dedication, we are extremely proud to present you our  Break and Retest price action indicator created from scratch. One of the most complex indicators that we made with ove
AW Trend Predictor
AW Trading Software Limited
4.74 (39)
하나의 시스템에서 추세와 고장 수준의 조합입니다. 고급 지표 알고리즘은 시장 노이즈를 필터링하고 추세, 진입점 및 가능한 출구 수준을 결정합니다. 표시기 신호는 통계 모듈에 기록되어 가장 적합한 도구를 선택하여 신호 기록의 효율성을 보여줍니다. 이 표시기는 이익 실현 및 손절매 표시를 계산합니다. 매뉴얼 및 설명 ->   여기   / MT5 버전 ->   여기 지표로 거래하는 방법: Trend Predictor로 거래하는 것은 3단계로 간단합니다. 1단계 - 포지션 열기 70% 이상의 성공률로 매수 신호를 받았습니다. 2단계 - StopLoss 결정 반대 신호로 트렁크 선택 3단계 - 이익 실현 전략 정의 전략 1: TP1 도달 시 전체 포지션 청산 전략 2: TP1 도달 시 포지션의 50% 청산 및 TP2 도달 시 나머지 50% 청산 전략 3: 추세 반전 시 전체 포지션 청산 이익: 결과를 다시 그리지 않음, 신호는 엄격하게 양초가 닫힐 때 어드바이저에서 사용할 수 있습니다. 이
TPSpro RFI Levels
Roman Podpora
4.83 (24)
Reversal First Impulse levels (RFI)    INSTRUCTIONS        RUS       -       ENG              R ecommended to use with an indicator   -   TPSpro  TREND PRO -  Version MT5 A key element in trading is zones or levels from which decisions to buy or sell a trading instrument are made. Despite attempts by major players to conceal their presence in the market, they inevitably leave traces. Our task was to learn how to identify these traces and interpret them correctly. Main functions: Displaying activ
제작자의 제품 더 보기
It predicts the most likely short-term price movement based on advanced mathematical calculations. Features Estimation of immediate price movement; Calculation of the real market trend; Calculation of the most important support and resistance levels; Algorithms optimized for making complex mathematical calculations with a minimal drain of system resources; Self-adjusting for better performance, so it’s able to work properly at any symbol (no matter how exotic it is) and any timeframe; Compatib
FREE
It predicts the most likely short-term price movement based on advanced mathematical calculations. Features Estimation of immediate price movement; Calculation of the real market trend; Calculation of the most important support and resistance levels; Algorithms optimized for making complex mathematical calculations with a minimal drain of system resources; Self-adjusting for better performance, so it’s able to work properly at any symbol (no matter how exotic it is) and any timeframe; Compatib
Signals and Alerts for Accelerator/Decelerator indicator based on these MQL5 posts: Accelerator Oscillator and Signals of the Indicator Accelerator Oscillator . Note : this tool is based on the code of Accelerator indicator developed by MetaQuotes Software Corp. Features The signals are triggered at   closing   of last bar/opening of a new bar; Any kind of alerts can be enabled: Dialog Box, Email message, SMS notifications for smartphones and tablets, and Sound alerts; Customizable arrows. By
FREE
메타트레이더 4(MT4)의 "두 이동평균 크로스오버" 인디케이터는 두 이동평균을 표시하고 이동평균이 서로 교차할 때 알려주는 차트 분석 도구입니다. 이 인디케이터는 두 개의 이동평균을 계산하여 표시하는데, 하나는 더 빠르고 다른 하나는 느립니다. 더 빠른 이동 평균이 더 느린 이동 평균 위로 교차하면 강세 신호로 간주되어 잠재적 인 추세 반전 또는 새로운 상승 추세의 시작을 나타냅니다. 반대로 빠른 이동평균이 느린 이동평균 아래로 교차하면 하락 신호로, 추세 반전 또는 새로운 하락 추세의 시작을 나타냅니다. 이 인디케이터는 단순이동평균(SMA), 지수이동평균(EMA), 평활이동평균(SMMA) 또는 선형가중이동평균(LWMA) 등 다양한 유형의 이동평균을 사용하도록 사용자 지정할 수 있습니다. 트레이더는 자신의 트레이딩 스타일과 선호도에 맞게 각 이동평균의 주기를 조정할 수도 있습니다. 이동 평균을 표시하는 것 외에도 인디케이터는 크로스오버가 발생하면 알림을 생성합니다. 트레이더는 크
Crossing of market price and moving average with all kinds of alerts and features to improve visualization on the chart. Features Crossing of market price and Moving Average (MA) at current bar or at closing of last bar; It can avoid same signals in a row, so it can allow only a buy signal followed by a sell signal and vice versa; MA can be set for any of the following averaging methods: Simple Moving Average (SMA), Exponential Moving Average (EMA), Smoothed Moving Average (SMMA), Linear-weig
Be notified of every color change of Heiken Ashi (HA) candles. The indicator will trigger past and new signals every time that HA candles change their colors. Note : this tool is based on the code of Heiken Ashi indicator developed by MetaQuotes Software Corp. Features The signals are triggered at closing of last bar/opening of a new bar; Any kind of alerts can be enabled: Dialog Box, Email message, SMS notifications for smartphones and tablets, and Sound alerts; By default, up arrows are plot
This indicator triggers an alert for one of the most popular methods used in Stochastic Oscillator. This is as follow: a buying alert when the Oscillator (either MAIN [%K] or SIGNAL [%D]) falls below a specific level (e.g., 20) and then rises above that level. a selling alert when the Oscillator rises above a specific level (e.g., 80) and then falls below that level. Note: this tool was developed based on the code of Stochastic Oscillator indicator included by default in MetaTrader 4 terminal
Introduction The "Two Moving Average Crossover" indicator for MetaTrader 5 (MT5) is a technical analysis tool that displays two moving averages and notifies when the moving averages cross each other. The indicator calculates and plots two moving averages, one of which is faster and the other is slower. When the faster moving average crosses above the slower moving average, it is considered a bullish signal, indicating a potential trend reversal or the start of a new uptrend. Conversely, when th
Be notified of every color change of Heiken Ashi (HA) candles. The indicator will trigger past and new signals every time that HA candles change their colors. ( Note : this tool is based on the code of Heiken Ashi indicator developed by MetaQuotes Software Corp.) Features The signals are triggered at closing of last bar/opening of a new bar; Any kind of alerts can be enabled: Dialog Box, Email message, SMS notifications for smartphones and tablets, and Sound alerts; By default, up arrows are p
Crossing of market price and moving average with all kinds of alerts and features to improve visualization on the chart. Features Crossing of market price and Moving Average (MA) at current bar or at closing of last bar; It can avoid same signals in a row, so it can allow only a buy signal followed by a sell signal and vice versa; MA can be set for any of the following averaging methods: Simple Moving Average (SMA), Exponential Moving Average (EMA),   Smoothed Moving Average (SMMA),   Linear-w
필터:
KingdomCome
548
KingdomCome 2023.02.25 22:27 
 

GOOD INDICATOR IF YOU CAN FIND A WAY TO FILTER YOUR TRADES

Boaz
88
Boaz 2021.11.27 13:44 
 

Excellent!!

리뷰 답변