• 미리보기
  • 리뷰 (23)
  • 코멘트 (97)
  • 새 소식

Supply and Demand Dashboard PRO

4.8
현재 20% 할인!

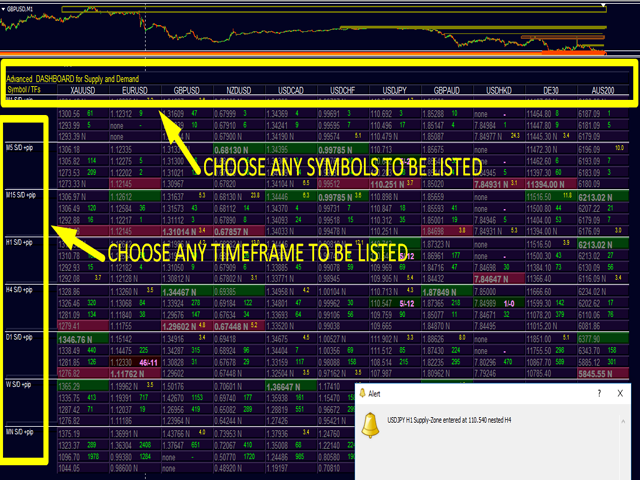
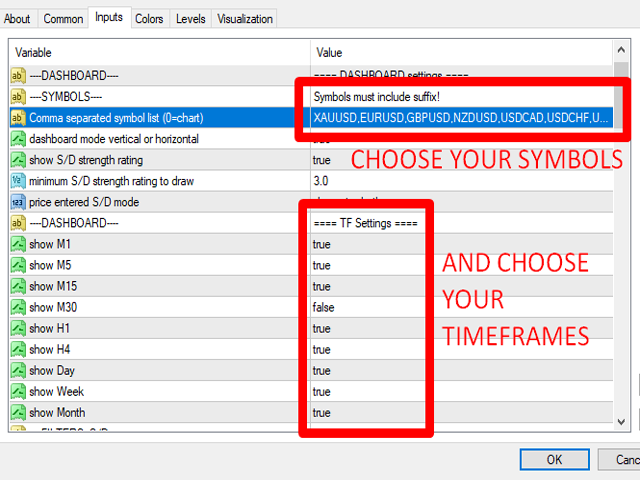
이 대시보드는 여러 기호와 최대 9개의 타임프레임에서 작동하는 매우 강력한 소프트웨어입니다.
주요 지표(최상의 리뷰: 고급 공급 수요)를 기반으로 합니다.  Advanced Supply Demand

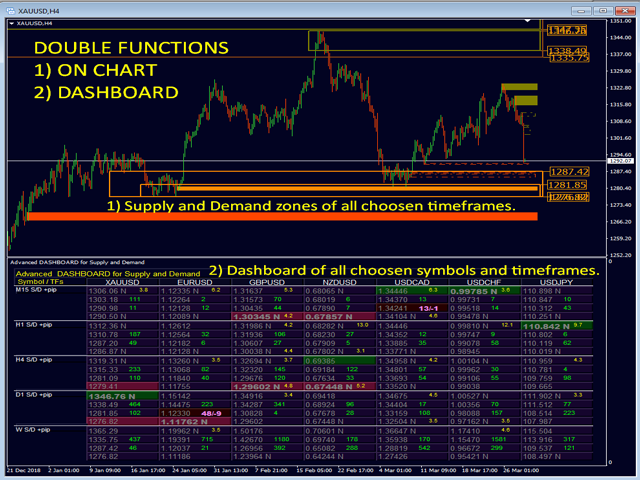
대시보드는 훌륭한 개요를 제공합니다. 다음과 같이 표시됩니다. 
  1. 영역 강도 등급을 포함하여 필터링된 공급 및 수요 값,
  2. 영역에 대한/및 영역 내 Pips 거리,
  3. 중첩된 영역을 강조 표시하고
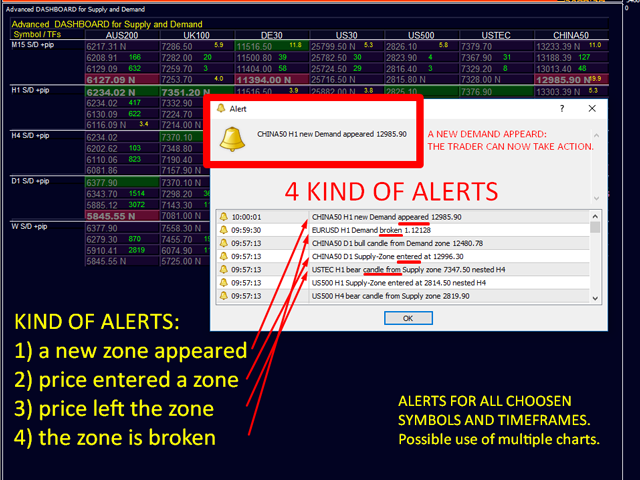
  4. 모든 (9) 시간 프레임에서 선택한 기호에 대해 4가지 종류의 경고를 제공합니다.
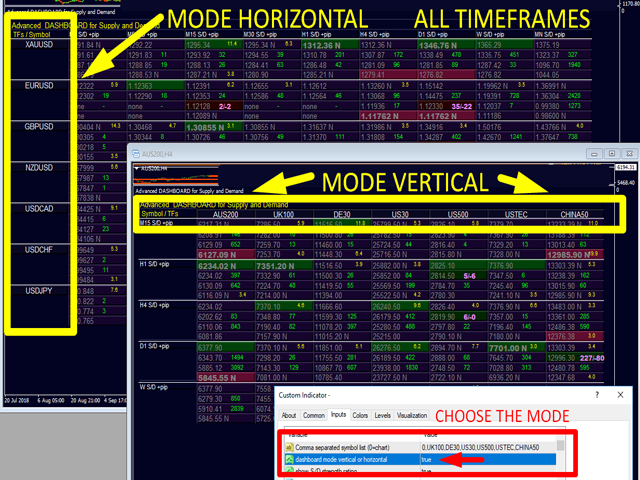
  5. 그것은 당신의 개인적인 필요에 맞게 고도로 구성 가능합니다!


당신의 혜택!


모든 트레이더에게 가장 중요한 질문:

시장에 진입하기에 가장 좋은 수준은 무엇입니까?
최고의 성공 기회와 위험/보상을 얻으려면 강력한 공급/수요 영역 내 또는 그 근처에서 거래를 시작하십시오.


손절매를 위한 최적의 장소는 어디입니까?
가장 안전하려면 강력한 수요/공급 구역 아래/위에 정류장을 두십시오.


최고의 이익 목표는 무엇입니까?
귀하의 출구 전략은 귀하의 진입만큼 중요하며 더 높은 시간 프레임 그림을 아는 것이 도움이 될 수 있습니다. 매수의 경우 다음 공급 구역을 목표로 사용하고 매도의 경우 다음 수요 구역을 목표로 사용하십시오. 더 높은 시간대의 공급과 수요까지 이윤 마진을 위한 충분한 여지가 있도록 공급 또는 수요에 대한 철회를 입력하면 수익이 증가할 것입니다.


강한 영역과 약한 영역을 필터링하는 이유는 무엇입니까?
불균형이 클수록 가격 움직임이 커집니다. 확률이 가장 높은 가격 수준은 구매자와 판매자 간의 불균형이 가장 큰 가격 수준입니다. 사전 경고 없이 그 자리에서 후진하여 돌처럼 떨어집니다. 이러한 부분은 불균형이 큰 부분입니다. 많은 수의 판매자가 그 가격으로 시장에 진입했고 구매자 수보다 많았습니다. 또한 갑작스러운 매도세 발생 시 그 수준 부근에서 매도를 기다리는 매도자가 더 많았을 가능성도 크다.


공개된 중요 정보:

수요와 공급의 잠재력을 극대화하려면 사용 설명서를 참조하십시오.  https://www.mql5.com/en/blogs/post/725584

공급 수요 거래가 처음이라면 이 블로그도 읽으십시오.  blog

고급 기능은 4가지 특별 알림입니다. 

  • 새로운 영역이 나타났습니다.
  • 가격이 영역에 진입했습니다.
  • 가격이 영역을 벗어났습니다.
  • 영역이 깨졌습니다.


원하는 경우 중첩된 영역에 대해서만 모든 경고를 필터링할 수 있습니다.
알림을 받아야 하는 기간을 선택할 수 있습니다.
경고에서 기호를 제외할 수 있습니다.


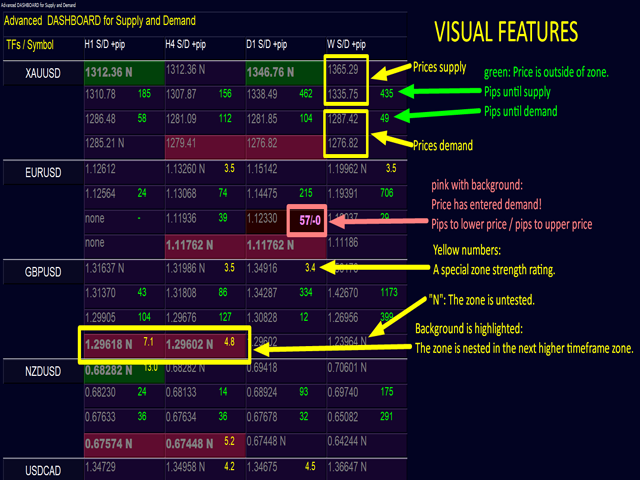
대시보드의 시각적 기능:
수요와 공급을 위한 가격. (위에서 아래로: 공급 상한 가격 / 공급 하한 가격 / 수요 상한 가격 / 수요 하한 가격)
공급과 수요까지 거리를 핍니다. 녹색, 가격이 구역에서 멀리 떨어져 있는 경우.
공급과 수요 내에서 핍 거리. 가격이 영역에 들어간 경우 분홍색 및 굵게 표시됩니다. (외부 가격으로 핍 / 내부 가격으로 핍)
특수 구역 강도 등급. 최소 강도에 도달하면 노란색 숫자입니다.
신규 또는 테스트됨: 영역이 아직 테스트되지 않았거나 신규인 경우 가격에 "N"이 추가됩니다.
중첩됨: 영역이 상위 시간대 영역 내에 중첩된 경우 배경이 강조 표시됩니다.
중첩 및 신규: 공급 및 수요 가격이 굵게 표시됩니다.


차트의 시각적 기능:


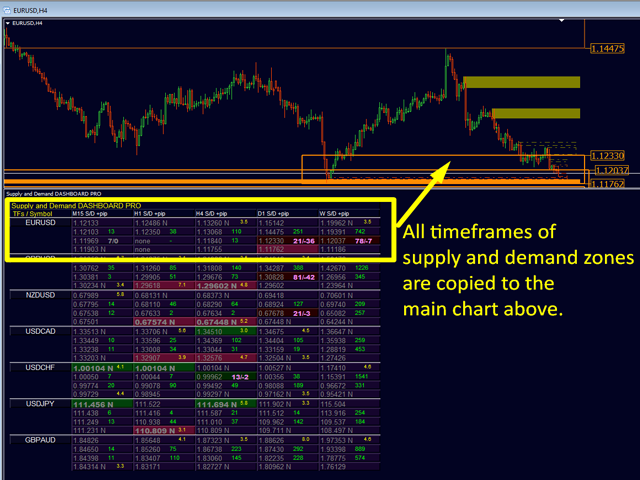
대시보드의 하위 창을 마우스로 아래로 드래그하면 실제 차트를 볼 수 있습니다. 기호를 변경하려면 기호 이름을 클릭합니다.
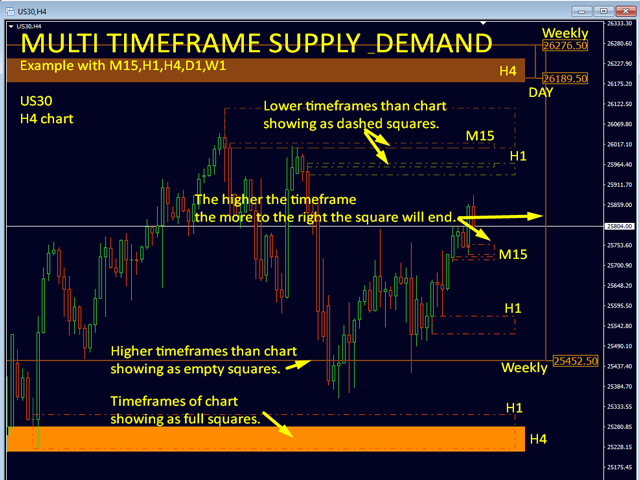
대시보드에 표시되는 모든 기간은 차트에 그려집니다.
점선 사각형으로 표시되는 차트보다 짧은 기간입니다.
전체 사각형으로 표시되는 차트의 실제 기간입니다.
빈 사각형으로 표시되는 차트보다 기간이 더 깁니다.
시간 프레임이 높을수록 사각형이 오른쪽으로 더 많이 끝납니다.
구역이 새 구역인지 테스트 구역인지 색상 코드가 표시됩니다.
가격은 차트에 표시되거나 표시되지 않을 수 있습니다.


전체 목록은 사용 설명서에서 확인할 수 있습니다. https://www.mql5.com/en/blogs/post/725584


전략 테스터:
주의: 전략 테스터에서 데모 작업을 하려면 다중 기호 및 다중 시간 프레임 대시보드이므로 특별한 설정이 필요합니다. 또한 차트 데이터 견적서를 준비해야 합니다. 개인 메시지를 보내주세요. (유사한 방식으로 작동하는 Advanced Supply Demand 데모를 대신 사용해 볼 수도 있습니다.)


팁:

사용 설명서 읽기: 여기를 클릭하십시오. https://www.mql5.com/en/blogs/post/725584
스페셜: MT4 차트 히스토리를 업데이트하기 위해 1개의 지원 차트가 열립니다! 이 기능은 비활성화할 수 있습니다.
거래 시스템 및 거래 사례는 프로필에서 내 뉴스와 블로그를 확인하세요.
지표를 받은 사람은 더 많은 정보, 링크, 템플릿 등이 포함된 STARTER-PACK 이메일(매뉴얼)을 요청합니다. 나는 당신의 성공을 확인하고 싶습니다!


자동 번역! 영어 원본 여기를 클릭 https://www.mql5.com/en/market/product/37335


리뷰 23
Gabor Bocsak
2755
Gabor Bocsak 2023.05.23 18:42 
 

I really like the indicators! Actually i use 4 of them and they work really well together! I had a lot of questions as i use a bit different strategy.but i got all the help! Thank you!

Tyrena Booker
96
Tyrena Booker 2023.02.01 19:59 
 

The indicator is phenomenal!!! This indicator help me to know when pullbacks are happening.I enjoy the enhance features of this indicator because you can add any symbols see the whole market within seconds. I use this indicator with Currency Strength Exotics on the chart and let just say you will be counting PIPS. Bernhard will help with your question and answer each one in punctual time. I highly recommend this indicator to anyone. I appreciated your help Bernhard!!!

batukbhairava
206
batukbhairava 2022.08.10 19:13 
 

Similar to CS28 Dashboard this indicator is a great dashboard which provides the Supply & Demand zones of all 28 pairs in a single window. My only issue with this indicator is that I couldn't resize the windows properly. May be Bernhard could look into this in the next update can design a template which can be resized properly. Also adding & removing currency requires manually typing the currency pairs in the settings. Is it possible if we can use the "Check Box" from the list instead? That will save lot of time As usual great work from Bernhard Thanks and Happy trading to all.. :-)

추천 제품
This indicator works on MT4 and is very easy to use. When you receive a signal from it, you wait for that candle with the signal to close and you enter your trade at the beginning of the next new candle . A red arrow means sell and a green arrow means buy. All arrows comes with Alert  like for easy identification of trade signal. Are you okay with that? 1 minute candle 1 minute expire
The Binary Profit Maker,  This indicator works on MT4 and is very easy to use. When you receive a signal from it, you wait for that candle with the signal to close and you enter your trade at the beginning of the next new candle . A Up Purple arrow means Buy and a Down Purple arrow means Sell. All arrows comes with Alert  like for easy identification of trade signal. Are you okay with that? How To Enter Trade? 1 minute candle 1 minute expire
Signal From Level
Yaroslav Varankin
Binary Options Support Resistance Indicator This indicator is designed for binary options trading and effectively shows retracements from support and resistance levels. Signals appear on the current candle. A red arrow pointing downwards indicates a potential selling opportunity, while a blue arrow pointing upwards suggests buying opportunities. All that needs adjustment is the color of the signal arrows. It is recommended to use it on the M1-M5 timeframes as signals are frequent on these timef
Credible Cross System
Muhammed Emin Ugur
Credible Cross System   indicator is designed for signal trading. This indicator generates trend signals. It uses many algorithms and indicators to generate this signal. It tries to generate a signal from the points with the highest trend potential. The indicator works based on instant price movements. This indicator is a complete trading product. This indicator does not need any additional indicators. The indicator certainly does not repaint. The point at which the signal is given does not
Rattling Signal Point
Muhammed Emin Ugur
This   Rattling Signal Point   indicator is designed for signal trading. This indicator generates trend signals. It uses many algorithms and indicators to generate this signal. It tries to generate signals from the points with the highest trend potential. This indicator is a complete trading product. This indicator does not need any additional indicators. The indicator is never repainted. The point at which the signal is given does not change. When the signal comes the arrows are put back
Real Magic Trend
Muhammed Emin Ugur
1 (1)
This   Real Magic Trend   indicator is designed for signal trading. This indicator generates trend signals. It uses many algorithms and indicators to generate this signal. It tries to generate signals from the points with the highest trend potential. This indicator is a complete trading product. This indicator does not need any additional indicators. The indicator is never repainted. The point at which the signal is given does not change.      Features and Recommendations Time Frame
SuperTrend Alerts
Libertas LLC
3 (4)
SuperTrend Alerts adds alerts to the widely popular SuperTrend indicator. As the name suggests, SuperTrend is a trending indicator which works best in trendy (not choppy) markets. SuperTrend is extremely popular for intraday and daily trading, and can be used on any timeframe. Place a call when the price closes above the SuperTrend line, and place a put when the price closes below the SuperTrend line. These crossovers are highlighted by non-repainting up/down arrows. Alerts Email, message and
Real Pro Signal
Muhammed Emin Ugur
Real Pro Signal   indicator is designed for signal trading. This indicator generates trend signals. It uses many algorithms and indicators to generate this signal. It tries to generate a signal from the points with the highest trend potential. This indicator is a complete trading product. This indicator does not need any additional indicators. The indicator certainly does not repaint. The point at which the signal is given does not change.     Features and Suggestions Time Frame: H1 W
Signal Tower   indicator is designed for signal trading. This indicator generates trend signals. It uses many algorithms and indicators to generate this signal. It tries to generate a signal from the points with the highest trend potential. This indicator is a complete trading product. This indicator does not need any additional indicators. The indicator certainly does not repaint. The point at which the signal is given does not change. The indicator has a pips counter. You can see how
Pro Magic Signal   indicator is designed for signal trading. This indicator generates trend signals.  It uses many algorithms and indicators to generate this signal. It tries to generate a signal from the points with the highest trend potential. This indicator is a complete trading product. This indicator does not need any additional indicators.  The indicator certainly does not repaint. The point at which the signal is given does not change.  Thanks to the alert features you can get the signals
Great Strong System
Muhammed Emin Ugur
Great Strong System   indicator is designed for signal trading. This indicator generates trend signals. It uses many algorithms and indicators to generate this signal. It tries to generate a signal from the points with the highest trend potential. This indicator is a complete trading product. This indicator does not need any additional indicators. The indicator certainly does not repaint. The point at which the signal is given does not change.     Features and Suggestions Time Frame:
True Magic Oscillator
Muhammed Emin Ugur
The   True Magic Oscillator   indicator is designed for signal trading. This indicator generates trend signals. It uses many algorithms and indicators to generate this signal. It tries to generate signals from the points with the highest trend potential. This indicator is a complete trading product. This indicator does not need any additional indicators. The indicator is never repainted. The point at which the signal is given does not change.         Features and Recommendations Wor
The new update makes this indicator a complete tool for studying, analyzing and operating probabilistic patterns. It includes: On-chart Multi-asset percentage monitor. Configurable martingales. Twenty-one pre-configured patterns , including Mhi patterns and C3. An advanced pattern editor to store up to 5 custom patterns. Backtest mode to test results with loss reports. Trend filter. Hit operational filter. Martingale Cycles option. Various types of strategies and alerts. Confluence between patte
VR Cub
Vladimir Pastushak
VR Cub 은 고품질 진입점을 얻는 지표입니다. 이 지표는 수학적 계산을 용이하게 하고 포지션 진입점 검색을 단순화하기 위해 개발되었습니다. 지표가 작성된 거래 전략은 수년 동안 그 효율성을 입증해 왔습니다. 거래 전략의 단순성은 초보 거래자라도 성공적으로 거래할 수 있다는 큰 장점입니다. VR Cub은 포지션 개시 지점과 이익 실현 및 손절매 목표 수준을 계산하여 효율성과 사용 편의성을 크게 높입니다. 간단한 거래 규칙을 이해하려면 아래 전략을 사용한 거래 스크린샷을 살펴보세요. 설정, 세트 파일, 데모 버전, 지침, 문제 해결 등은 다음에서 얻을 수 있습니다. [블로그] 다음에서 리뷰를 읽거나 작성할 수 있습니다. [링크] 버전 [MetaTrader 5] 진입점 계산 규칙 포지션 개설 진입점을 계산하려면 VR Cub 도구를 마지막 최고점에서 마지막 최저점까지 늘려야 합니다. 첫 번째 지점이 두 번째 지점보다 빠른 경우, 거래자는 막대가 중간선 위에서 마감될 때까지 기다립
Gvs Undefeated Trend   indicator is designed for trend and signal trading. This indicator generates trend signals.  It uses many algorithms and indicators to generate this signal. It tries to generate a signal from the points with the highest trend potential. This indicator is a complete trading product. This indicator does not need any additional indicators.  You can only trade with this indicator. The generated signals are displayed on the graphical screen.  Thanks to the alert features you ca
Signal Undefeated   indicator is designed for trend and signal trading. This indicator generates trend signals.  It uses many algorithms and indicators to generate this signal. It tries to generate a signal from the points with the highest trend potential. This indicator is a complete trading product. This indicator does not need any additional indicators.  You can only trade with this indicator. The generated signals are displayed on the graphical screen.  Thanks to the alert features you can g
Shark Trading
Yaroslav Varankin
The indicator is designed to trade binary options on small time frames up to m 30 Signals The blue up arrow is a buy signal. The red dn arrow is a sell signal. The signal will appear together with the advent of a new candle  and during formation Signals on the current candle Expiration time one candle from the timeframe on which you are trading You can use moving average to filter out false signals. Or escort support levels. This tool is reliable in trading.
Two Candles to Glory
Ellan Dirgantara Tholkhah
This is a Binary Options signal indicator. Extremely powerful for the 1 min chart. The signals are based on my personal tweak (based on real trial and error & backtested) of the RSI, ADX and Ichimoku and my observation on how price moves. It turns out, 2 candles expiry is the most consistent with this set up. How to use: 1. Wait for arrow signal to show. 2. Place a 2 candle expiry right after the close of the signal candle. So if you are trading a 1 min chart, place an expiry for 2 mins... if yo
Super Reversal Pattern
Parfait Mujinga Ndalika
Super Reversal Pattern Indicator Unlock the power of advanced pattern recognition with our Super Reversal Pattern Indicator. Designed for traders seeking precision and reliability, this indicator identifies one of the most effective reversal patterns in technical analysis, offering a significant edge in your trading strategy. Key Features: Non-Repainting Accuracy: Enjoy the confidence of non-repainting technology. Once a Super Reversal Pattern is detected, it remains static, providing consis
Happy Trend Arrow
Muhammed Emin Ugur
This   Happy Trend Arrow   indicator is designed for signal trading. This indicator generates trend signals. It uses many algorithms and indicators to generate this signal. It tries to generate signals from the points with the highest trend potential. This indicator is a complete trading product. This indicator does not need any additional indicators. The indicator is never repainted. The point at which the signal is given does not change.       Features and Recommendations Time Fra
Entry Signal Arrows   indicator is designed for signal trading. This indicator generates trend signals.  It uses many algorithms and indicators to generate this signal. It tries to generate a signal from the points with the highest trend potential. This indicator is a complete trading product. This indicator does not need any additional indicators.  The indicator certainly does not repaint. The point at which the signal is given does not change.  Thanks to the alert features you can get the sign
Advanced Stochastic Scalper
Evgeny Belyaev
4.53 (15)
Advanced Stochastic Scalper - is a professional indicator based on the popular Stochastic Oscillator. Advanced Stochastic Scalper is an oscillator with dynamic overbought and oversold levels, while in the standard Stochastic Oscillator, these levels are static and do not change. This allows Advanced Stochastic Scalper to adapt to the ever-changing market. When a buy or a sell signal appears, an arrow is drawn on the chart and an alert is triggered allowing you to open a position in a timely mann
Big Trend Signal   indicator is designed for trend and signal trading. This indicator generates trend signals.  It uses many algorithms and indicators to generate this signal. It tries to generate a signal from the points with the highest trend potential. This indicator is a complete trading product. This indicator does not need any additional indicators.  You can only trade with this indicator. The generated signals are displayed on the graphical screen.  Thanks to the alert features you can ge
Night ghost
Dmitriy Kashevich
Night Ghost - Arrow indicator for binary options. This is a reliable assistant to you in the future! - No redrawing on the chart -Works great on EUR/USD currency pairs! -Indicator accuracy up to 90% (Especially at night) -No long setup required (Perfectly set up for Binary Options) - Not late signals - The appearance of a signal on the current candle -Perfect for M1 period (No More!) - Eye-friendly candle color (Red and Blue) -Installed Alert Working with it: - Blue arrow
This indicator is customized for binary option trading like M1 timeframe or turbo option trading. The way a binary option works is from the traders perspective is that you choose whether or not a certain underlying asset (a stock, commodity, currency etc.) is going to go up or down in a certain amount of time. You essentially bet money on this prediction. You are shown how much money up front you will earn if your prediction is correct. If your prediction is wrong, you lose your bet and the mone
Good Signal
Yaroslav Varankin
The indicator is designed for binary options and short-term transactions on Forex To enter a trade when a signal appears blue up arrow buy red down arrow sell signal For Forex enter on a signal exit on the opposite signal or take profit For binary options Enter on 1 candle, if the deal goes negative, set a catch on the next candle Works on all timeframes If you apply a filter like Rsi, you will get a good reliable strategy.. The algorithm is at the stage of improvement and will be further develo
Professional Level
Yaroslav Varankin
indicator for trading binary options and forex trading. The indicator does not redraw the readings. when trading binary options, testing was performed. This indicator showed the good results correct predictions. Under these conditions, the eur / usd m1 chart, when a signal appears, the transaction opens in the direction indicated by the indicator for 5 candles, then the truth is (5 minutes since in us the 1-minute chart of a candlestick is 1 minute) the result was. When trading in the forex
Beta Signal
Svyatoslav Kucher
Beta Signal   - индикатор предназначенный для поиска локальных экстремумов, определения текущей тенденции. В расчетах индикатора используется авторская методика. С помощью индикатора можно определять места возможного разворота цены желательно в направлении тенденции, но также с достаточной точностью и против нее. Также с помощью индикатора можно определять текущую тенденцию. Индикатор подходит для любых валютных пар, но для адекватного отображения показания необходимо, чтобы было достаточно исто
Binary Option Signal
Yaroslav Varankin
Indicator for binary options arrow is easy to use and does not require configuration works on all currency pairs, cryptocurrencies buy signal blue up arrow sell signal red down arrow tips do not trade during news and 15-30 minutes before their release, as the market is too volatile and there is a lot of noise it is worth entering trades one or two candles from the current period (recommended for 1 candle) timeframe up to m 15 recommended money management fixed lot or fixed percentage of the depo
Pair Trading Station MT4
Young Ho Seo
3.67 (3)
How to use Pair Trading Station Pair Trading Station is recommended for H1 time frame and you can use it for any currency pairs. To generate buy and sell signal, follow few steps below to apply Pair Trading Station to your MetaTrader terminal. When you load Pair Trading Station on your chart, Pair Trading station will assess available historical data in your MetaTrader platforms for each currency pair. On your chart, the amount of historical data available will be displayed for each currency pai
이 제품의 구매자들이 또한 구매함
Ultimate Index Advisor는 시장 움직임을 정확하게 분석하고 거래 기회를 동적으로 식별하도록 설계된 고급 도구입니다. 이 지표는 트렌드, 조정 및 반전을 최적화한 전략 조합을 기반으로 신호를 제공하여 다양한 거래 스타일에 적합합니다. 직관적인 인터페이스를 갖춘 Ultimate Index Advisor는 차트에서 보이는 화살표로 명확한 진입 및 이탈 지점을 강조하여 거래 결정에서 모호함을 제거합니다. 고급 기술 분석 전략을 활용하여 이 도구는 모든 시간대에 적합하며, 단기 또는 장기 거래를 선호하는 트레이더에게 유연성을 제공합니다. 주요 기능: 트렌드 및 반전의 자동 식별. 명확하고 읽기 쉬운 시각적 신호. 다양한 금융 시장 및 시간대에 적합. 사용자 거래 전략에 맞게 설정 가능. Ultimate Index Advisor가 명확한 신호와 고급 분석으로 거래 결정을 어떻게 지원하는지 직접 확인해보세요.
TPSpro RFI Levels
Roman Podpora
4.82 (22)
지침         러시아   -        영어       표시기와 함께 사용하는 것이 좋습니다   .       -       TPSpro   트렌드 프로 -   MT4 버전         거래에서 핵심 요소는 거래 상품을 매수 또는 매도하기로 결정하는 구역 또는 수준입니다. 주요 업체가 시장에서 자신의 존재를 숨기려는 시도에도 불구하고, 그들은 필연적으로 흔적을 남깁니다. 우리의 과제는 이러한 흔적을 식별하고 올바르게 해석하는 방법을 배우는 것이었습니다. 주요 기능:: 판매자와 구매자를 위한 활성 영역을 표시합니다! 이 지표는 매수 및 매도를 위한 모든 올바른 초기 임펄스 레벨/존을 보여줍니다. 진입점 검색이 시작되는 이러한 레벨/존이 활성화되면 레벨의 색상이 바뀌고 특정 음영으로 채워집니다. 또한 상황을 보다 직관적으로 이해하기 위해 화살표가 나타납니다. 더 높은 시간대의 레벨/존 표시(MTF 모드) 더 높은 시간 간격을 사용하여 레벨/존을 표시하는 기능을 추가했습니다.
Connect Indicator
Sukunthakan Ngernbamrung
Connect Indicator is a tool used for connecting indicators between the MQL market and MT4. The connected indicators are made by our group and can be used for other applications, such as sending messages to the Line application or Telegram application. If you have any questions, please don't hesitate to ask us to receive support. Function and indicator buffer Buffer one is the high price of the previous candle. Buffer two is the high price of the previous candle. Usage To connect indicators to fu
Entry Arrow Alerts: Finds market entry opportunities then notifies you via mobile or desktop alerts The key features include: Conservative mode . One entry signal per direction. Ideal for the patient trader looking to capture longer term moves. Aggressive mode . Multiple possible entry signals per direction. Ideal for the active trader looking to capture multiple moves within the same trend. Trigger Line . Price entry line helps cut down on false signals. Display Window . Allows you to instantly
TrendMaestro
Stefano Frisetti
5 (3)
note: this indicator is for METATRADER4, if you want the version for METATRADER5 this is the link:  https://www.mql5.com/it/market/product/108106 TRENDMAESTRO ver 2.4 TRENDMAESTRO recognizes a new TREND in the bud, he never makes mistakes. The certainty of identifying a new TREND is priceless. DESCRIPTION TRENDMAESTRO identifies a new TREND in the bud, this indicator examines the volatility, volumes and momentum to identify the moment in which there is an explosion of one or more of these data a
Apollo Pips PLUS SP
Oleg Rodin
5 (4)
제품을 구매하기 전에 아래 정보를 읽어보세요! Apollo Pips PLUS SP는 독특한 제품입니다! 모든 거래 지표에 액세스할 수 있는 새로운 "APOLLO PIPS" 지표와 "슈퍼 팩" 보너스를 받고 싶은 분들을 위한 것입니다! Apollo Pips PLUS SP 제품을 구매하면 실제로 Apollo Pips 표시기의 완전히 새로운 버전을 구매하게 됩니다. 이 버전의 지표에는 개선된 알고리즘과 사용하기 쉬운 매개변수가 있어 모든 시장 및 거래 스타일에서 지표를 사용할 수 있는 기회를 제공합니다. 이 제품의 구매자는 슈퍼 보너스로 다른 모든 표시기에 무료로 액세스할 수 있습니다! 내 모든 거래 도구에 액세스하고 싶었다면 이 제품이 당신에게 딱 맞습니다! :) 하지만 이것이 전부는 아닙니다! :) 이 제품의 모든 구매자는 또한 내 새로운 지표를 무료로 받을 자격이 있습니다! :) 새로운 거래 지표를 사용할 수 있게 되었는데, 귀하는 저의 특별한 "SUPER PACK" 평생 보너스
SMCpro VIP
Arief
5 (1)
Currently Price 20% OFF ( for unlimited use )   BONUS  AUX VIP Club 2024 : Include  EA Airbag  and  Load Data History  to enhance the performance of this tool to its maximum potential  Click Here to Download Files   ( for users only )   Hello World! Introducing.. SMCpro VIP tool and Indicator for MetaTrader 4, designed to revolutionize your trading experience with the ICT Smart Money Concept. This system is meticulously crafted to empower traders with advanced insights and precision in
Enigmera
Ivan Stefanov
5 (3)
에니메라: 시장의 핵심 https://www.enigmera.com 소개 이 지표 및 트레이딩 시스템은 금융 시장에 대한 놀라운 접근 방식입니다. 에니메라는 프랙탈 주기를 사용하여 지지선과 저항선을 정확하게 계산합니다. 진정한 축적 단계를 보여주고 방향과 목표를 제시합니다.  추세에 있든 조정에 있든 작동하는 시스템입니다.  어떻게 작동하나요? 에니메라는 지지선/저항선, 목표선, 편차선의 세 가지 라인으로 구성됩니다. 이 시스템은 과거 데이터를 현재와 미래로 추정하는 일반적인 시장 지표와 달리 현재에 대한 완전한 그림을 제공합니다. 지지선 위에 있으면 실제 지지를 의미하고 저항선 위에 있으면 실제 저항을 의미합니다. 레벨이 깨지면 추세의 변화를 나타냅니다. 다시 그리지 않습니다. 시장이 지속적으로 진화함에 따라 에니메라는 평가 도구를 조정하여 전략을 정기적으로 수정합니다.   이를 통해 모든 시나리오를 철저히 평가할 수 있습니다. 이 시장 지표의 고유성은 분명하며 그 기
NAM Order Blocks
NAM TECH GROUP, CORP.
5 (1)
MT4 Multi-timeframe Order Blocks detection indicator. Features - Fully customizable on chart control panel, provides complete interaction. - Hide and show control panel wherever you want. - Detect OBs on multiple timeframes. - Select OBs quantity to display. - Different OBs user interface. - Different filters on OBs. - OB proximity alert. - ADR High and Low lines. - Notification service (Screen alerts | Push notifications). Summary Order block is a market behavior that indicates order collection
RelicusRoad Pro
Relicus LLC
4.64 (102)
이제 $ 147 (몇 가지 업데이트 후 $ 499 증가) - 무제한 계정 (PCS 또는 MACS) RelicusRoad 사용 설명서 + 교육 비디오 + 비공개 Discord 그룹 액세스 + VIP 상태 시장을 보는 새로운 방법 RelicusRoad는 외환, 선물, 암호화폐, 주식 및 지수에 대한 세계에서 가장 강력한 거래 지표로서 거래자에게 수익성을 유지하는 데 필요한 모든 정보와 도구를 제공합니다. 우리는 초보자부터 고급까지 모든 거래자가 성공할 수 있도록 기술적 분석 및 거래 계획을 제공합니다. 미래 시장을 예측할 수 있는 충분한 정보를 제공하는 핵심 거래 지표입니다. 우리는 차트에서 말이 안 되는 여러 지표 대신 완전한 솔루션을 믿습니다. 타의 추종을 불허하는 매우 정확한 신호, 화살표 + 가격 조치 정보를 표시하는 올인원 표시기입니다. 강력한 AI를 기반으로 하는 RelicusRoad는 누락된 정보와 도구를 제공하여 교육하고 성공적인 트레이더인 트레이딩 전문
Gold Channel XAUUSD
Paulo Rocha
5 (4)
Gold Channel is a volatility-based indicator, developed with a specific timing algorithm for the XAUUSD pair, which consists of finding possible corrections in the market. This indicator shows two outer lines, an inner line (retracement line) and an arrow sign, where the theory of the channel is to help identify overbought and oversold conditions in the market. The market price will generally fall between the boundaries of the channel. If prices touch or move outside the channel it is a tra
The Stochastic Basket Currency Strenght  brings the Stochastic indicator to a new level.  Expanding the boundaries of TimeFrames and mono-currency analysis, the SBCS take the movements of each currency that composes the cross and confront them in the whole basket of 7 crosses.  The indicator works with any combination of AUD, CAD, CHF, EUR, GBP, JPY, NZD, USD pairs and with full automation takes in account every stochastic value (main line) for the selected Time Frame.  After that, the indicator
ON Trade Waves Patterns Harmonic Elliot Wolfe를 소개합니다. 이는 수동 및 자동 방법을 사용하여 다양한 시장 패턴을 감지하기 위해 개발된 고급 지표입니다. 다음은 그 작동 방식입니다: 조화적 패턴: 이 지표는 차트에 나타나는 조화적 패턴을 식별할 수 있습니다. 이러한 패턴은 Scott Carney의 "Harmonic Trading vol 1 및 2"에서 설명한 것처럼 조화적 거래 이론을 연습하는 트레이더에게 중요합니다. 수동으로 그리든 자동 감지를 사용하든 ON Trade Waves Patterns가 도움을 줄 것입니다. 컨트롤 패널: 이 지표에는 사용자 친화적인 컨트롤 패널이 있습니다. 차트 및 시간 프레임 설정을 저장하여 다양한 구성 간에 쉽게 전환할 수 있습니다. 차트 공간을 최대화하려면 최소화할 수도 있습니다. 다른 분석 도구를 사용하는 것을 선호하는 경우 닫기 버튼을 클릭하여 모든 지표 데이터를 숨길 수 있습니다. 템플릿 저장: 설정을 사
Bomb Bank Signal
Igor Pereira Calil
5 (1)
폭탄 은행 신호: MetaTrader 4의 신뢰도 지표 Bomb Bank Signal은 금융 시장에서 가장 관련성이 높은 추세를 식별하도록 설계된 MetaTrader 4의 강력한 지표입니다. 움직임을 정확하게 예측하는 도구를 찾고 있다면 Bomb Bank가 바로 여러분에게 필요한 동맹입니다. 작동 방식: 이 지표는 거래량 분석, 양초 종가, 대칭 추세 등 세 가지 방법을 결합하여 매수 및 매도 기회를 감지하고 신호를 보냅니다. Bomb Bank는 매수 기회를 포착할 때는 '폭탄'과 같고, 매도 신호를 감지할 때에는 '해골'과 같습니다. 폭탄 은행은 왜 다른가요? 완전한 신뢰성: 폭탄 은행 신호는 신호를 제거하지 않습니다. 일단 신호가 발행되면 그 신호는 계속 유지되므로 기회를 절대 놓치지 않습니다. 극도의 정확성: Bomb Bank는 잘못된 신호를 보내지 않습니다. 시장이 발전함에 따라 조정하면서 실시간으로 업데이트하지만 이전 신호의 투명성은 유지합니다. 실시간
SR arrows liquid lines
Teresinha Moraes Correia
In the fifth update , the indicator now aims to predict the direction of the next candle, issuing a buy or sell arrow precisely when the conditions are met. Since its first version, which showed support and resistance levels on the chart, up to the current version 5, many improvements have been made. One of the key changes is the removal of visual support and resistance levels to prevent memory overload. This is no longer necessary, as arrows are now issued when the price is near or touches t
Volume by Price MT4
Brian Collard
4.6 (10)
The Volume by Price Indicator for MetaTrader 4 features Volume Profile and Market Profile TPO (Time Price Opportunity). Volume and TPO histogram bar and line charts. Volume Footprint charts. TPO letter and block marker collapsed and split structure charts. Static, dynamic and flexible range segmentation and compositing methods with relative and absolute visualizations. Session hours filtering and segment concatenation with Market Watch and custom user specifications. Graphical layering, positio
---- Brand New Strategy. Three Month Rent is $30. ONE YEAR RENT ONLY $50. FREE EURUSD VERSION AVAILABLE UNDER << Forecast System Gift >>. NO NEED FOR BACKTEST! Link to the FREE version -->  https://www.mql5.com/en/market/product/110085?source=Site --- This is a simple strategy based on BREAKOUT and FIBONACCI levels. After a breakout, either, the market: - continues the move directly to the 161, 261 and 423 levels, or - retraces to the 50% level (also called a correction) and thereafter continues
Prometheus Trade Engine is an indicator that combines price action, ratio based indicator with custom indicators& other lagging indicators to create this leading indicator that has a multi-timeframe approach to trading so that you are able to see what other timeframes are doing all in one chart and give you high probability trade setups to assist you to make a prediction on what is MOST likely to happen in the market going foward Chart Features 1. Reversal Zone It is the rectangular box on
ECM Elite Channel is a volatility-based indicator, developed with a specific time algorithm, which consists of finding possible corrections in the market. This indicator shows two outer lines, an inner line (retracement line) and an arrow sign, where the channel theory is to help identify overbought and oversold conditions in the market. The market price will generally fall between the boundaries of the channel. If prices touch or move outside the channel, it's a trading opportunity. The
거래 속도는 시장에서 대량 주문이 언제 어디서 누적되는지, 그리고 이로 인한 이점을 보여주는 최고 품질의 지표입니다. 매우 초기 단계에서 추세 변화를 감지합니다. 이는 지표이자 동시에 트레이딩 시스템입니다. 이 개념은 독특하고 수익성이 매우 높습니다. 외환에서 틱 볼륨은 거래량이라고 오해의 소지가 있습니다. 실제로는 단위 시간당 가격 변동으로, 사실상 거래 속도입니다. 이 지표는 외환에서 볼륨에 대한 개념을 완전히 수정하여 올바른 방식으로 논리적으로 정의하고이 논리를 적용하면 독특하고 정확한 최상위 수익성 도구가됩니다. 속도가 증가하면 더 큰 관심과 그에 상응하는 진입 및 출구의 신호입니다. 사용 방법: 이 지표는 시장에서 거래 속도를 측정하고 비교하기 때문에 가장 먼저해야 할 일은 다음과 같습니다.  이러한 비교를 할 기간을 선택합니다.  일반적으로 15일 전이 비교를 위한 좋은 출발점입니다.  인디케이터에 날짜를 입력하고 실행합니다.  30분 또는 1시간의 기간에서
Gann Swing Structure
Kirill Borovskii
5 (1)
This indicator is based on the mathematics of the great trader W.D. Ganna. With its help, you can easily find strong levels by analyzing swings to find the optimal entry point. The indicator works on all instruments and all timeframes. The indicator is fully manual and has control buttons. All you need to do is press the NEW button, a segment will appear, which you can place on any movement, swing or even 1 candle that you want to analyze. By placing the segment, press the OK button. A grid (th
Trading System Double Trend - an independent trading system consisting of several indicators. Determines the direction of the general trend and gives signals in the direction of price movement. Can be used for scalping, intraday or weekly trading. Features Works on any time frames and trading instruments (forex, cryptocurrencies, metals, stocks, indices.) Simple visual reading of information that does not load the chart The indicator does not repaint and does not complete signals Works onl
Sneaky Busters 4
Mushfiq Faysal
5 (2)
This indicator is designed for those familiar with smart money concepts, specifically accumulation and distribution. It tracks subtle moves by institutional traders, not always aligned with traditional strategies. Ensure it fits your trading style by testing thoroughly before purchasing. Sneaky Buster is designed to help retail traders identify smart money moves. Traditional indicators often miss these subtle maneuvers, which inspired the creation of this tool. It effectively detects price cons
Oni Scalper
Goh Cheng Wai
5 (2)
Dear Onis, This Indicator is used for   GBPUSD, US30 and GOLD on 1-Min Chart . For US30 , Depending on your broker, Minimum Lot Size will differ from 0.01 to 1.0 lots. My Current Account is trading at 1.0 lots at $1 per point . Please check with your Broker what's the Margin Required for your Minimum lot sizes before you trade on your Real account. I have Forward Tested the indicator for around 6 months before releasing it to the public. ( No Demo is available for the Indicator, Strategy
Gann Signal Scaner
Kirill Borovskii
This indicator is based on the Gann Signal indicator and acts as a market scanner. All you need to do is fill in the selected currency pairs in the settings and that’s it. Next, the indicator itself will view all these currency pairs and time frames from M5 to D1 simultaneously. When a new signal appears, the indicator will give you an Alert and also draw the letter N where this new signal will be.
Pipsurfer
Clinton Keenan Obinna Butler
Overview: With so much noise and distraction in the markets I wanted to create clarity for traders to have a simple, efficient, and fun trading experience. This is why I created Pipsurfer. Pipsurfer is an trend following indicator that visually shows you important Institutional Smart Money levels in the market and helps you to trace Market Structure in the markets. Most traders find it difficult to visually see trading elements such as trend, structure and momentum which are key for understandin
Key level wedge pro
Presley Annais Tatenda Meck
5 (1)
We have combined all of our beloved indicators the likes of: Key level order block , Key level supply and demand , Key level liquidity grab and Key level wedge into one single indicator and dashboard. Whats new Dashboard : There is an easy access dashboard for all your needs. Multi-timeframe button : There is now a multi-timeframe option for Order Blocks and Supply and demand zones, making it easy to see higher timeframe zones easily on the current timeframe by just clicking the desired timefr
Indicator : RealValueIndicator Description : RealValueIndicator is a powerful tool designed specifically for trading on the EURUSD pair. This indicator analyzes all EUR and USD pairs, calculates their real currency strength values, and displays them as a single realistic value to give you a head start on price. This indicator will tell you moves before they happen if you use it right. RealValueIndicator allows you to get a quick and accurate overview of the EURUSD currency pair tops and bottoms,
ON Trade Optuma Astro
Abdullah Alrai
5 (4)
물론입니다. 아래는 제공해주신 텍스트의 한국어 번역입니다: MT4용 천문학 지표 소개: 귀하의 최상급 하늘 트레이딩 동반자 트레이딩 경험을 천체의 높이로 끌어올리기 준비가 되셨나요? MT4용 천문학 지표를 소개합니다. 이 혁신적인 도구는 복잡한 알고리즘의 힘을 활용하여 탁월한 천문학적 통찰과 정밀한 계산을 제공합니다. 정보의 우주를 손에 담다: 천문학적 데이터의 보물함을 드러내는 포괄적인 패널을 살펴보세요. 행성의 지오/헬리오센트릭 좌표, 태양/지구 거리, 크기, 길이, 별자리, 황도 좌표 및 적도 좌표, 심지어 수평 좌표 등 각각이 정밀하게 계산되고 아름답게 제시됩니다. 지표에 의해 생성된 수직선은 시간 값에 해당하여 트레이딩 여정에 우주적인 시각을 부여합니다. 행성 라인과 관계: 수정 가능한 스케일과 각도로 차트를 장식하는 행성 라인의 마법을 경험해보세요. 직관적인 컨트롤 패널을 통해 각 행성의 라인의 가시성을 손쉽게 전환할 수 있습니다. 쥰션이나 섹스타일, 사분각, 삼분각, 트
Introduction to X3 Chart Pattern Scanner X3 Cherart Pattern Scanner is the non-repainting and non-lagging indicator detecting X3 chart patterns including Harmonic pattern, Elliott Wave pattern, X3 patterns, and Japanese Candlestick patterns. Historical patterns match with signal patterns. Hence, you can readily develop the solid trading strategy in your chart. More importantly, this superb pattern scanner can detect the optimal pattern of its kind. In addition, you can switch on and off individu
제작자의 제품 더 보기
Dynamic Forex28 Navigator
Bernhard Schweigert
5 (2)
Dynamic Forex28 Navigator - 차세대 외환 거래 도구. 현재 49% 할인. Dynamic Forex28 Navigator는 오랫동안 인기 있는 지표의 진화형으로, 세 가지의 힘을 하나로 결합했습니다. 고급 통화 Strength28 지표(695개 리뷰) + 고급 통화 IMPULSE with ALERT(520개 리뷰) + CS28 콤보 신호(보너스). 지표에 대한 자세한 정보 https://www.mql5.com/en/blogs/post/758844 차세대 Strength 지표는 무엇을 제공합니까?  원래 지표에서 좋아했던 모든 것이 새로운 기능과 더 높은 정확도로 강화되었습니다. 주요 기능: 독점적인 통화 Strength 공식.  모든 시간대에 걸쳐 부드럽고 정확한 강도선. 추세와 정확한 진입을 식별하는 데 이상적입니다. 역동적인 시장 피보나치 수준(시장 피보나치).  이 지표에만 있는 고유한 기능. 가격 차트가 아닌 통화 강도에 피보나치가 적용
Advanced Supply Demand
Bernhard Schweigert
4.91 (295)
현재 33% 할인! 초보자나 전문 트레이더를 위한 최고의 솔루션! 이 보조지표는 우리가 다수의 독창적 기능과 새로운 공식을 통합한 독특하고 고품질이며 저렴한 거래 도구입니다. 이 업데이트를 통해 이중 시간대를 표시할 수 있습니다. 더 높은 TF를 표시할 수 있을 뿐만 아니라 차트 TF와 더 높은 TF 모두를 표시할 수 있습니다: 중첩 영역 표시. 모든 Supply Demand 트레이더들이 좋아할 것입니다. :) 중요한 정보 공개 Advanced Supply Demand의 잠재력을 극대화하려면 다음을 방문하십시오. https://www.mql5.com/ko/blogs/post/720245   진입 또는 목표의 명확한 트리거 포인트를 정확히 찾아냄으로 해서 거래가 어떻게 개선될지 상상해 보십시오. 새로운 알고리즘을 기반으로 매수자와 매도자 간의 잠재적인 불균형을 훨씬 더 쉽게 분간할 수 있습니다. 왜냐하면 가장 강한 공급영역과 가장 강한 수요 영역과 과거에 어떻게 진행 되었는지를(이
Advanced Supply Demand MT5
Bernhard Schweigert
4.5 (14)
현재 33% 할인! 초보자나 전문 트레이더를 위한 최고의 솔루션! 이 보조지표는 우리가 다수의 독창적 기능과 새로운 공식을 통합한 독특하고 고품질이며 저렴한 거래 도구입니다. 이 업데이트를 통해 이중 시간대를 표시할 수 있습니다. 더 높은 TF를 표시할 수 있을 뿐만 아니라 차트 TF와 더 높은 TF 모두를 표시할 수 있습니다: 중첩 영역 표시. 모든 Supply Demand 트레이더들이 좋아할 것입니다. :) 중요한 정보 공개 Advanced Supply Demand의 잠재력을 극대화하려면 다음을 방문하십시오. https://www.mql5.com/ko/blogs/post/720245   진입 또는 목표의 명확한 트리거 포인트를 정확히 찾아냄으로 해서 거래가 어떻게 개선될지 상상해 보십시오. 새로운 알고리즘을 기반으로 매수자와 매도자 간의 잠재적인 불균형을 훨씬 더 쉽게 분간할 수 있습니다. 왜냐하면 가장 강한 공급영역과 가장 강한 수요 영역과 과거에 어떻게 진행 되었는지를(이
Currency Strength Exotics
Bernhard Schweigert
4.87 (31)
현재 20% 할인! 초보자 또는 전문가 트레이더를 위한 최고의 솔루션! 이 표시기는 Exotic Pairs Commodities, Indexes 또는 Futures와 같은 기호에 대한 통화 강도를 표시하는 데 특화되어 있습니다. 금, 은, 석유, DAX, US30, MXN, TRY, CNH 등의 진정한 통화 강도를 보여주기 위해 9번째 줄에 모든 기호를 추가할 수 있습니다. 이것은 독특하고 고품질이며 저렴한 거래 도구입니다. 우리는 많은 독점 기능과 새로운 공식을 통합했습니다. 새로운 추세 또는 스캘핑 기회의 정확한 트리거 포인트를 정확히 찾아낼 수 있기 때문에 거래가 어떻게 개선될지 상상해 보십시오. 사용 설명서: 여기를 클릭 https://www.mql5.com/en/blogs/post/708876 모든 시간대에 작동합니다. TREND를 빠르게 확인할 수 있습니다! 새로운 기본 알고리즘을 기반으로 설계되어 잠재적인 거래를 더욱 쉽게 식별하고 확인할 수 있습니다.
Advanced Currency Strength28 Indicator
Bernhard Schweigert
4.9 (652)
현재 26% 할인 초보자 또는 전문가 트레이더를 위한 최고의 솔루션! 이 지표는 우리가 독점 기능과 새로운 공식을 통합했기 때문에 독특하고 고품질이며 저렴한 거래 도구입니다. 단 하나의 차트로 28 Forex 쌍의 통화 강도를 읽을 수 있습니다! 새로운 추세 또는 스캘핑 기회의 정확한 트리거 포인트를 정확히 찾아낼 수 있기 때문에 거래가 어떻게 개선될지 상상해 보십시오. 사용 설명서: 여기를 클릭  https://www.mql5.com/en/blogs/post/697384 그것이 첫 번째, 원본입니다! 쓸모없는 지망생 클론을 사지 마십시오. 더 스페셜  강력한 통화 모멘텀을 보여주는 하위 창의 화살표 GAP가 거래를 안내합니다! 기본 또는 호가 통화가 과매도/과매도 영역(외부 시장 피보나치 수준)에 있을 때 개별 차트의 기본 창에 경고 표시가 나타납니다. 통화 강도가 외부 범위에서 떨어질 때 풀백/반전 경고. 교차 패턴의 특별 경고 추세를 빠르게 볼 수 있는
현재 20% 할인 ! 초보자 또는 전문가 트레이더를 위한 최고의 솔루션! 이 대시보드 소프트웨어는 28개의 통화 쌍에서 작동합니다. 2가지 주요 지표(Advanced Currency Strength 28 및 Advanced Currency Impulse)를 기반으로 합니다. 전체 Forex 시장에 대한 훌륭한 개요를 제공합니다. 고급 통화 강도 값, 통화 이동 속도 및 모든(9) 시간대의 28 Forex 쌍에 대한 신호를 보여줍니다. 추세 및/또는 스캘핑 기회를 정확히 파악하기 위해 차트의 단일 지표를 사용하여 전체 시장을 볼 수 있을 때 거래가 어떻게 개선될지 상상해 보십시오! 잠재적인 거래를 식별하고 확인하면서 강력한 통화와 약한 통화를 더욱 쉽게 식별할 수 있도록 이 지표에 기능을 내장했습니다. 이 표시기는 통화의 강세 또는 약세가 증가 또는 감소하는지 여부와 모든 시간대에서 수행되는 방식을 그래픽으로 보여줍니다. 추가된 새로운 기능은 현재 시장 조건 변화에 적
Advanced Currency IMPULSE with ALERT
Bernhard Schweigert
4.9 (483)
현재 31% 할인!! 초보자 또는 전문가 트레이더를 위한 최고의 솔루션! 이 지표는 우리가 독점 기능과 비밀 공식을 통합했기 때문에 독특하고 고품질이며 저렴한 거래 도구입니다. 단 하나의 차트로 28개 통화 쌍 모두에 대한 경고를 제공합니다. 새로운 추세 또는 스캘핑 기회의 정확한 트리거 포인트를 정확히 찾아낼 수 있기 때문에 거래가 어떻게 개선될지 상상해 보십시오! 새로운 기본 알고리즘을 기반으로 구축되어 잠재적인 거래를 훨씬 더 쉽게 식별하고 확인할 수 있습니다. 이는 통화의 강세 또는 약세가 가속되는지 여부를 그래픽으로 표시하고 가속 속도를 측정하기 때문입니다. 자동차의 속도계처럼 생각하면 됩니다. 가속화할 때 Forex 시장에서 동일한 일이 분명히 더 빠르게 발생합니다. 즉, 반대 방향으로 가속화되는 통화를 페어링하면 잠재적으로 수익성 있는 거래를 식별한 것입니다. 통화 모멘텀의 수직선과 화살표가 거래를 안내합니다! 역동적인 Market Fibonacci 23
Advanced Currency Strength28 MT5
Bernhard Schweigert
5 (1)
초보자 또는 전문가 트레이더를 위한 최고의 솔루션! 이 지표는 우리가 독점 기능과 새로운 공식을 통합했기 때문에 독특하고 고품질이며 저렴한 거래 도구입니다. 단 하나의 차트로 28 Forex 쌍의 통화 강도를 읽을 수 있습니다! 새로운 추세 또는 스캘핑 기회의 정확한 트리거 포인트를 정확히 찾아낼 수 있기 때문에 거래가 어떻게 개선될지 상상해 보십시오. 사용 설명서: 여기를 클릭  https://www.mql5.com/en/blogs/post/697384 그것이 첫 번째, 원본입니다! 쓸모없는 지망생 클론을 사지 마십시오. 더 스페셜  강력한 통화 모멘텀을 보여주는 하위 창의 화살표 GAP가 거래를 안내합니다! 기본 또는 호가 통화가 과매도/과매도 영역(외부 시장 피보나치 수준)에 있을 때 개별 차트의 기본 창에 경고 표시가 나타납니다. 통화 강도가 외부 범위에서 떨어질 때 풀백/반전 경고. 교차 패턴의 특별 경고 추세를 빠르게 볼 수 있는 다중 시간 프레임 선택
GOLD Impulse with Alert
Bernhard Schweigert
4.6 (10)
이 지표는 Advanced Currency IMPULSE with ALERT  +   Currency Strength Exotics  의 2가지 제품의 슈퍼 조합입니다. 그것은 모든 시간 프레임에 대해 작동하며 8개의 주요 통화와 하나의 기호에 대한 강약의 충동을 그래픽으로 보여줍니다! 이 표시기는 금, 이국적인 쌍, 상품, 지수 또는 선물과 같은 기호에 대한 통화 강도 가속을 표시하는 데 특화되어 있습니다. 금, 은, 오일, DAX, US30, MXN, TRY, CNH 등의 진정한 통화 강도 가속(충동 또는 속도)을 표시하기 위해 9번째 줄에 모든 기호를 추가할 수 있습니다. 새로운 기본 알고리즘을 기반으로 구축되어 잠재적인 거래를 훨씬 더 쉽게 식별하고 확인할 수 있습니다. 이는 통화의 강세 또는 약세가 가속되는지 여부를 그래픽으로 표시하고 가속 속도를 측정하기 때문입니다. 자동차의 속도계처럼 생각하면 됩니다. 가속화할 때 Forex 시장에서 동일한 일이 분명히
My Trades in Pips
Bernhard Schweigert
4.81 (16)
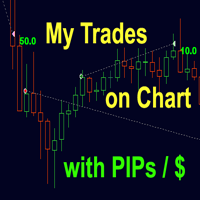
놓치고 싶지 않은 거래 도구. 표시기는 차트의 모든 거래/거래에 첨부 된 기호로 표시됩니다. 이익 또는 손실의 핍 수를 인쇄합니다. 선택에 따라 더 나은 분석을 위해 하위 창을 통해 수직선을 인쇄합니다. 여기에서도 확인하십시오 : My Trade History Pro https://www.mql5.com/en/market/product/50206 또한 예금 통화의 거래 결과 및 총 PIP에 대한 정보를 추가합니다. 당신은 오늘의 거래 만 보여 주거나 여러 막대 내에서 거래 만 보여 주도록 선택할 수 있습니다. 지정된 마법 번호로 거래를 표시 할 수 있습니다. 값이 0으로 설정되면 표시기는 모든 거래를 표시합니다. 전문가 고문의 마법 수를 지정하면 EA의 거래 만 표시됩니다. 입구 오버 엔트리 화살표에는 주문 번호, 댓글 및 마법 번호가 표시됩니다. 이 표시기는 주로 통화 강도의 다른 특수 지표 중 하나와 함께 사용됩니다. https://www.mql5.com/en
FREE
Advanced Accumulated Currency Volume
Bernhard Schweigert
4.54 (48)
현재 20% 할인! 초보자 또는 전문가 상인을위한 최상의 솔루션! 이 지표는 새로운 공식과 함께 여러 독점적 인 기능을 통합했기 때문에 저렴한 거래 도구입니다. 고급 누적 통화 볼륨 표시기는 메인 28 외환 쌍에 특화되어 있으며 모든 시간 프레임에서 작동합니다. 단일 차트에서 AUD, CAD, CHF, EUR, GBP, JPY, NZD 및 USD의 모든 통화 볼륨 (C-Volume)을 추출하는 새로운 공식입니다. 이것은 거래에서 큰 이점입니다. 볼륨 트레이더는 사용 방법을 알게 될 것입니다. 당신이 새로운 경우, 극단적 인 값을 읽고 거래 무기고에 추가하는 방법을 배우십시오. C- 볼륨을 총이 아니라 방패로 생각하십시오. 기본 차트에 경고 표시가 표시됩니다. 이것은 일반적으로 사용되는 단순한 쌍의 부피가 아닙니다. 외환 시장은 스캔되며 각 통화에 대한 볼륨은 추출되어 C- 볼륨으로 축적됩니다. 이제 어떤 통화가 가장 높거나 가장 낮은 볼륨을 확인할 수 있습니다
현재 26% 할인!! 이 지표는 두 주요 지표( Advanced Currency Strength 28   &  Advanced Currency IMPULSE with ALERT )의 슈퍼 조합입니다. TICK-UNITS에 대한 통화 강도 값과 28개 Forex 쌍에 대한 경고 신호를 보여줍니다. 11개의 다른 틱 단위를 사용할 수 있습니다. 1, 2, 3, 4, 5, 6, 10, 12, 15, 20, 30초입니다. 두 번째 타이머 내에 최소 1틱이 있으면 하위 창의 Tick-Unit 막대가 표시되고 왼쪽으로 이동합니다. 단 하나의 차트로 28 Forex 페어를 스캘핑할 수 있습니다! 스캘핑 기회의 정확한 트리거 포인트를 정확히 찾아낼 수 있기 때문에 스캘핑이 어떻게 개선될지 상상해 보십시오. 그것은 1분보다 낮은 기간에 작동하는 시장의 첫 번째 통화 강도 지표입니다! 그것은 시장에 빠르게 들어오고 나가고 시장에서 작은 핍을 잘라내기를 원하는 빠른 스캘퍼를 위한 것입니다.
My Trade History PRO
Bernhard Schweigert
5 (3)
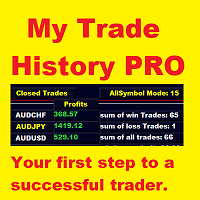
현재 20% 할인 !! 초보자 또는 전문가 상인을위한 최상의 솔루션! 당신의 거래를 검토하는 것은 성공적인 거래자의 첫 번째 단계입니다. 성공적인 트레이더는 거래 성과를 정기적으로 검토하는 습관이 있습니다. 이 도구는 당신이 그렇게하는 데 도움이 될 것입니다. 검토 과정은이 도구에서 가장 효과적이며 거래를 추적합니다. 수동 거래 또는 EA의 거래를 분석하십시오. 3 가지 일반적인 견해를 사용하십시오. 버튼을 클릭하는 것만으로 전환하려면 폐쇄 거래 열린 거래 폐쇄 + 공개 거래 모든 거래는 각 기호에 대해 나열됩니다. 다른 기호로 이동하려면 기호 이름 버튼을 클릭하십시오. 새로 개설 및 마감 거래에 경고를 사용하십시오. 열린 거래를 보는 데 매우 유용합니다. EA, 신호 또는 수동으로 시작될 수 있습니다. 이익 또는 PIP의 결과를 전환하려면 버튼을 클릭하십시오. 이익 핍 그런 다음 3 분석 유형을 전환하십시오. 버튼을 클릭합니다.
초보자 또는 전문가 트레이더를 위한 최고의 솔루션! 이 지표는 우리가 독점 기능과 비밀 공식을 통합했기 때문에 독특하고 고품질이며 저렴한 거래 도구입니다. 단 하나의 차트로 28개 통화 쌍 모두에 대한 경고를 제공합니다. 새로운 추세 또는 스캘핑 기회의 정확한 트리거 포인트를 정확히 찾아낼 수 있기 때문에 거래가 어떻게 개선될지 상상해 보십시오! 새로운 기본 알고리즘을 기반으로 구축되어 잠재적인 거래를 훨씬 더 쉽게 식별하고 확인할 수 있습니다. 이는 통화의 강세 또는 약세가 가속되는지 여부를 그래픽으로 표시하고 가속 속도를 측정하기 때문입니다. 자동차의 속도계처럼 생각하면 됩니다. 가속화할 때 Forex 시장에서 동일한 일이 분명히 더 빠르게 발생합니다. 즉, 반대 방향으로 가속화되는 통화를 페어링하면 잠재적으로 수익성 있는 거래를 식별한 것입니다. 통화 모멘텀의 수직선과 화살표가 거래를 안내합니다! 역동적인 Market Fibonacci 23 레벨은 경고 트리거로 사
필터:
MarcoEA
138
MarcoEA 2023.06.09 22:50 
 

사용자가 평가에 대한 코멘트를 남기지 않았습니다

Bernhard Schweigert
82279
개발자의 답변 Bernhard Schweigert 2023.06.25 12:01
Thank you for purchasing our dashboard. As a bonus, we invite you to join our exclusive community of traders by registering at www.CurrencyStrength28.com/forum . In our forum, you'll have access to valuable resources and discussions on successful trading strategies. The best part? It's completely free for our clients. Don't miss out on this opportunity to enhance your trading skills and connect with like-minded traders. If you have any further questions or need assistance, feel free to reach out. Happy trading!
Gabor Bocsak
2755
Gabor Bocsak 2023.05.23 18:42 
 

I really like the indicators! Actually i use 4 of them and they work really well together! I had a lot of questions as i use a bit different strategy.but i got all the help! Thank you!

Bernhard Schweigert
82279
개발자의 답변 Bernhard Schweigert 2023.06.09 15:01
Thank you, Gabor Bocsak, for your positive feedback. We truly appreciate it. We are glad to hear that you are enjoying the indicators and that they are working well in conjunction with your strategy. Our team is always ready to assist you and answer any questions you may have. We are committed to providing top-notch support and ensuring your success. 💖
Tyrena Booker
96
Tyrena Booker 2023.02.01 19:59 
 

The indicator is phenomenal!!! This indicator help me to know when pullbacks are happening.I enjoy the enhance features of this indicator because you can add any symbols see the whole market within seconds. I use this indicator with Currency Strength Exotics on the chart and let just say you will be counting PIPS. Bernhard will help with your question and answer each one in punctual time. I highly recommend this indicator to anyone. I appreciated your help Bernhard!!!

Bernhard Schweigert
82279
개발자의 답변 Bernhard Schweigert 2023.02.02 12:38
I appreciate your review with the phenomenal note.💖
batukbhairava
206
batukbhairava 2022.08.10 19:13 
 

Similar to CS28 Dashboard this indicator is a great dashboard which provides the Supply & Demand zones of all 28 pairs in a single window. My only issue with this indicator is that I couldn't resize the windows properly. May be Bernhard could look into this in the next update can design a template which can be resized properly. Also adding & removing currency requires manually typing the currency pairs in the settings. Is it possible if we can use the "Check Box" from the list instead? That will save lot of time As usual great work from Bernhard Thanks and Happy trading to all.. :-)

Bernhard Schweigert
82279
개발자의 답변 Bernhard Schweigert 2022.12.30 16:05
Thanks for sharing your great feedback. 🙏💖
New update: 2 buttons have been added to move the dashboard right/left or up/down. There may be symbols outside the visible chart if there are many symbols used. A click on the button will move the diagram by a number of rows or columns. Hope it helps.
najis080
134
najis080 2021.12.08 19:38 
 

Makes trading in zone much easier. I love this indicator.

Bernhard Schweigert
82279
개발자의 답변 Bernhard Schweigert 2022.02.02 09:07
Thanks for the review! 👍
Darryl Brown
258
Darryl Brown 2021.09.27 07:28 
 

I rented the indicator over the weekend and I plan on using this indicator along with cs28 and impulse for binary options trading. My first day so far I made 3k from $400 (5 wins 0 loss trades total) by following his rules of all 3 indicators. His system is by far superior and worth the money spent IMO. This indicator lets you know that all entries are not good entries. I love your other indicators Bernhard but this is by far my favorite one.

Bernhard Schweigert
82279
개발자의 답변 Bernhard Schweigert 2021.12.06 13:30
Thank you very much for your excellent review, friend! Wish you more success in your trading. 🙏👍
sudiang
222
sudiang 2021.09.06 15:00 
 

Personally, I like the stand alone version better. But this dashboard help me alot not to open many chart and stay all the time infront of laptop to monitor the opportunity. Just use it with the main trend and TF > 30, and it give low RR and many potential setup.

Bernhard Schweigert
82279
개발자의 답변 Bernhard Schweigert 2021.09.07 20:44
Thanks for the feedback! 🙏👍
George Palcau
21
George Palcau 2021.03.15 21:09 
 

Supply and demand zones are dissapearing all the time and it is confusing when it broke that resistance, i did not knew that from that begining and i can't use this indicator in my trading. When i contacted the seller about refund he recommended to buy another indicator that could go better with this one. Signals and alarms are also not triggering often. Overall bad experience and i did not received any refund.

Bernhard Schweigert
82279
개발자의 답변 Bernhard Schweigert 2021.03.16 13:52
It is the design of the dashboard to give a quick overview of the market. If you want to see broken zones, you need to use Advanced Supply Demand indicator version. The whole mql5 website does not support refunds. You can try the free demo before buying to know how it works. Besides, you rent only 1 month, which is only intended for a test.
Zachary David Cox
928
Zachary David Cox 2021.02.28 14:38 
 

I've used a couple of this authors products and have had success so I decided to try this one. My experience with the other products made setup and understanding very easy. It is a very powerful indicator!

Bernhard Schweigert
82279
개발자의 답변 Bernhard Schweigert 2022.10.01 17:21
Thanks for the honest review! 👍
Zafer Cakar
201
Zafer Cakar 2021.02.24 21:04 
 

Very strong indicator , incredible.

elthandoriancox
62
elthandoriancox 2020.09.18 14:11 
 

This indicator makes visually easy to determine where the buyers and sellers are in the market, thereby allowing you to see where the market will turn and or go too, impressive Bernhard !!!

a.hanson
226
a.hanson 2020.09.12 12:36 
 

I only have this indicator for 3 weeks but already I find it very useful in determining where to get out of a trade. Very good indicator, I am still getting used to it Bernhard's support is great like with all his other indicators, keep up the good job work.Thanks

Mark Taylor
2078
Mark Taylor 2020.08.27 11:30 
 

I have a few SD indicators and this one is by far the best, easy to read at a quick glance.

teapeak
75
teapeak 2020.08.05 13:21 
 

Best SD indicator I ever saw in Forex for Mt4. Hat off. Thank you.

SENMAO ZHANG
730
SENMAO ZHANG 2020.07.15 07:46 
 

This is the best support pressure indicator I've ever used, and it's my fifth Bernhard product.

stev18
136
stev18 2020.07.10 15:42 
 

I have been using some of the indicators from Bernhard. The quality of his products is very commendable. This indicator is a great tool. It plots accurate supply and demand zones on the chart and also displays them on a dashboard. With the dashboard, one can easily spot zones of interest, that can be traded with high probability of success. It also displays a lot of information that will help the trader make better trading decisions. I find it very useful. Thank you Bernhard and keep up the good work.

Oliver Henry
613
Oliver Henry 2020.06.16 13:01 
 

As a long time user of Bernhard's stand alone Supply and demand indicator I know just how accurate this indicator is. Being able to receive alerts for multiple pairs and monitor from a single dashboard is next level trading! Using this in conjunction with his other indicators makes for some very reliable signals. Many thanks

prestonmay3
215
prestonmay3 2020.02.22 20:19 
 

I have been using s/d as trade entry and exit now with a lot of success . The problem is that I spent most of my day looking for trades and charting . Instead of charting all 28 pairs , I use this to send me alerts , then I do technical analysis . Most free ones will only tell you when price enters a zone and not when it breaks and exit. I like this so much that I will purchase the Advance Standalone version and the Exotic ACS system. I have wasted 2000 on systems and indicators in the past year - This system paid for itself within the first week. The developer is an A plus guy also. Always answers questions in a fast manner .

valera123
172
valera123 2019.11.05 20:58 
 

Very good and high-quality product!

daniela maria lazzi
514
daniela maria lazzi 2019.10.16 12:41 
 

사용자가 평가에 대한 코멘트를 남기지 않았습니다

12
리뷰 답변
버전 4.1 2024.10.22
Please update to Version 4.1!

We've made several improvements to ensure compatibility with the latest Metatrader version, enhancing both performance and user experience.

Keep your indicators up to date—updating is quick and easy, with just 5 clicks. And best of all, it's free!

Happy trading!
버전 4.0 2024.08.22
Top-Rated Suppy and Demand Dashboard in the Market.

We've made significant improvements to enhance your trading experience.

Update now—it's free!
버전 3.9 2024.07.08
We are thrilled to announce the release of version 3.9 of our top-rated Supply and Demand Dashboard, packed with powerful new features to enhance your trading experience!

New Features and Enhancements:

Added a Quick Access Button: I've added a convenient button that allows you to quickly open a chart with the symbol and timeframe of the latest signal. This new button is prominently displayed at the top of the sub-window for easy access.

Improved Chart Integration: For seamless chart management, we recommend opening the signal in a target chart. Simply go to the "Other Settings 1" in the input list and set "Charts open in new window" to true. Once the target chart is open, re-add the dashboard with your customized settings, but setting the symbol list to 0 and "Popup Alerts" to false.

Happy trading and kill the market!
버전 3.8 2024.06.25
Best-Rated Supply and Demand Dashboard in the Market! Now Featuring Enhanced Detection for Gold and Indices!

**Update Now to the Latest Version!**

We are excited to introduce the latest update for our highly acclaimed Supply and Demand DASHBOARD PRO. This new version brings several significant enhancements designed to improve your trading experience:

**Compatibility Improvements:** Optimized for the latest Metatrader version, ensuring seamless functionality and better performance.

**Advanced Zone Detection:** Improved detection of nested supply and demand zones, providing more accurate and reliable data for better trading decisions.

**Enhanced Alerts:** Four special alerts are now included:
- A new zone appeared.
- Price entered a zone.
- Price left the zone.
- The zone is broken.

**Graphic Dashboard:** Now includes an extra arrow to move the table if needed for better visualization and customization.

Don't miss out on these enhancements! Keeping your indicators up to date ensures you benefit from the latest features and improvements. Updating is free, simple, and guarantees you always have the best tools at your disposal.

Thank you for your continued support and trust in our products.

**Get the Latest Version Now!**

---

For more details and to download the update, visit:
https://www.CurrencyStrength28.com
버전 3.7 2024.04.25
Best rated Supply and Demand Dashboard in the Market.
Important improvements.
Please update.
버전 3.6 2024.02.21
Various improvements for new Metatrader version.
버전 3.5 2023.12.26
Unlock Your Trading Potential with the Latest Upgrade!

Seize the opportunity for a trading revolution! Elevate your strategies with the latest enhancements to the Supply and Demand DASHBOARD PRO. Upgrade now and trade with newfound confidence. Don't miss out on these essential improvements—your journey to successful trading begins here.
버전 3.4 2023.10.25
We've just released an exciting update for our indicator, packed with enhancements that take your trading to the next level.

Upgrading your indicator is a smart move. It ensures you're leveraging the latest features, giving you a competitive edge in the market. Don't miss out!

Should you have questions or need help with the update, our team is here for you. Reach out anytime; we're committed to your success.

www.CurrencyStrength28.com
버전 3.3 2023.08.24
Upgrade to Version 3.3 for Enhanced Trading Insights

+ We're thrilled to introduce Version 3.3, featuring the industry's highest-rated Supply and Demand DASHBOARD PRO. Elevate your trading strategy with this powerful tool, designed to help you identify critical price reversal areas.

+ What's New in Version 3.3:
- Seamlessly compatible with the latest Metatrader version.
- Empowered by advanced algorithmic enhancements, offering unparalleled accuracy in Supply and Demand multi-timeframe analysis.

+ Don't miss out on these exciting updates. Keep your indicators up to date effortlessly and at no cost. By staying current with our latest version, you're ensuring that your trading arsenal remains at the cutting edge of the market.

+ Upgrade to Version 3.3 now and access the best-rated Supply and Demand DASHBOARD PRO available. With the new Price Label feature, trading on higher timeframes becomes even more insightful. Join the community of savvy traders who are enhancing their strategies with our free, top-notch tools.
버전 3.2 2023.06.25
We are thrilled to announce the highly anticipated release of Version 3.2 of our Supply and Demand Dashboard PRO – the top-rated tool for traders like you. With its advanced capabilities, this powerful indicator will revolutionize your trading strategy by identifying critical price reversal areas, giving you a significant edge in the market.

Discover the latest enhancements we have made to ensure seamless compatibility with the newest Metatrader version. By upgrading to Version 3.2, not only do you gain access to cutting-edge features, but you also stay ahead of the competition. And the best part? These updates are completely free, so you can maximize your trading potential without any additional cost.

Upgrade now to Version 3.2 and experience firsthand the unparalleled benefits of our top-rated Supply and Demand Dashboard PRO. Take control of your trading journey, make informed decisions, and elevate your profitability. Don't miss out on this opportunity to improve your trading strategy – all for free.
버전 3.1 2023.04.23
We're excited to announce the release of Version 3.1, featuring the best-rated Supply and Demand Zone Dashboard on the market. This powerful tool helps you spot key areas of price reversal, giving you an edge in your trading strategy.

Our team has made various improvements to ensure compatibility with the latest Metatrader version, so you can take advantage of new features and stay ahead of the competition. Plus, keeping your indicators up to date is completely free and ensures that you're always using the most advanced tools available.

Upgrade now to Version 3.1 and experience the benefits of our best-rated Supply and Demand Zone Dashboard. Stay ahead of the competition and improve your trading strategy with the latest updates, all for free.
버전 3.0 2023.02.20
Please update to Version 3.0 of the Supply and Demand Zone Dashboard Indicator, the best rated indicator of its kind in the market, with various improvements.

Some traders have reported that the zones in smaller time frames can be overlapped by the full rectangle of the current time frame. We have found a solution to this issue.

Now, you can choose to display the current time frame zone as an empty rectangle with a thicker border, so that the zones in smaller time frames are still visible.

There are two new input parameters available:

Full Rectangles Current Chart TF (default = true)
Rectangle Width Current TF (if not full 1-5) (default = 5)
We have not changed the previous display, so if you want to use the new function, you need to set the "Full Rectangles Current Chart TF" parameter to "false".
버전 2.9 2022.12.31
This is a small adjustment to yesterday's version with the new buttons.
This allows a practical navigation through the dashboard.
버전 2.8 2022.12.30
Added more improvements.
Updating is recommended.

2 buttons have been added to move the dashboard right/left or up/down. There may be symbols outside the visible chart if there are many symbols used. A click on the button will move the diagram by a number of rows or columns.

New input added:
+ Scroll number of rows list (1-10)
버전 2.7 2022.12.19
Various improvements.
Please update.
버전 2.6 2022.10.23
Various improvements.
Please update.
버전 2.5 2022.08.20
A useful feature has been added at the request of a trader.
It is possible for a trader to only have preferences for only buying or selling an instrument. Choose the alarms you want to set. The graph and alert for "entering a zone" and "new zone appearing" remain unaffected.

==== General Alert Settings ====
New input:
+ Traders preference alerts buy-sell-both

There was an issue with M1-alerts that has been fixed.

Please update.
버전 2.4 2022.07.02
Various improvements for new Metatrader version.
버전 2.3 2021.09.19
IMPORTANT UPDATE !!!

Due to new Metatrader versions, we need a corrective input to draw objects in a subwindow. If you use MT4 build 1341+, add the subwindow number (1 for the first subwindow, 2 for the second...). 0 means automatic.

New input at the end of the list:

+ Force objects to subwindow number (0=auto)
버전 2.2 2021.06.02
Various improvements.
버전 2.1 2021.04.25
Various improvements.
버전 2.0 2020.10.22
MAJOR UPDATE 2020
==================

Added optional: Supply and Demand zones with ENGULFING BARS pattern at the beginning of the zone.
Use reversal candle color for bar 1 or bar 2 (the one before). Use either one or both.
Use a true engulfing pattern for the above-mentioned bars. (Must choose above.)

By default the use is false. To use the function you must set the new inputs = true (The selection is copied to all timeframes).

New inputs:
==== Candle pattern
+ use reversal candle color bar 1
+ use reversal candle color bar 2 (both or either)
+ use true engulfing pattern (choose above)

MODIFICATION FOR ZONE SIZE
It was added optionally: Including a wick for the width of the supply and demand zones.
New input:
+ Include wick 1 for the zone size

By default, the function is not used. To use the function, you must set the new input = true (The selection is copied to all timeframes).
Since the zones will be wider, some zones could be filtered. You may want to use lower XY factors.
버전 1.9 2020.10.16
Various improvements.
버전 1.8 2020.06.23
Various improvements.
Optimized signal export to EAs.
버전 1.7 2020.05.21
New graphical feature added. We organize different time frames. Now you can display all time frame names on the right side of each square.

New input:
+ display all TF names right
버전 1.6 2020.01.16
Various improvements.
버전 1.5 2019.05.30
A new filter for alerts has been added to do alerts only if the zone is new or untouched. (Excluding break alert.)

New input:
+ alert only new zones (excluding breaks) (default = false)
To activate the filter set above input to true.
If false, the info will anyway be included into the alerts.
Example Alert: EURUSD H4 Demand-Zone (untested) entered at 1.11333 nested D1

버전 1.4 2019.04.23
Added a description on chart for higher S/D zones to know better the timeframe.
And diverse other improvements.
버전 1.3 2019.04.08
Made some changes to minimum Zone Drop to be align with Advanced Supply Demand indicator.
버전 1.2 2019.04.07
Re-activated the function for pivot and yesterdays high-low-open lines.
버전 1.1 2019.04.06
Added a message print on screen for last alert with time of alert.
You can choose if the time shows broker time or your PC time.
New input
+ Last Signal time is Local or broker time

Added an option to show less digital points.
New input
+ show prices with less digits (0-2) (0=all digits)