Cointegration Pair Trading Indicator
- 지표
- Lucas Baesso
- 버전: 1.43
- 업데이트됨: 2 4월 2019
- 활성화: 5
Cointegration Pair Trading Indicator
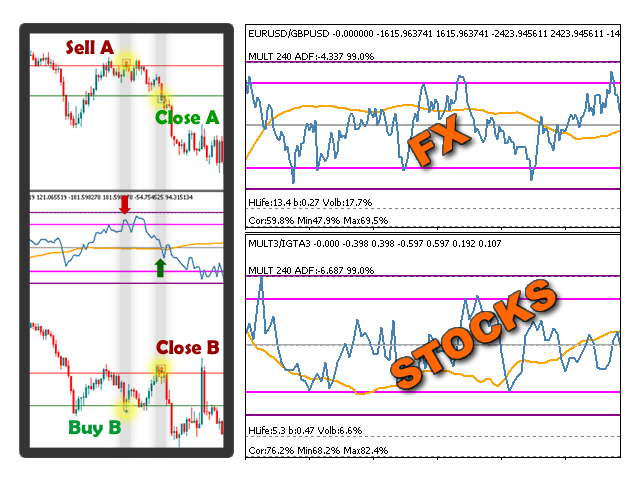
Indicator for statistical and quantitative pair trading strategies. You can perform Long&Short or Long&Long/Short&Short between two different assets.The indicator performs a series of statistical tests between the assets and shows whether the pair is cointegrated or not.
Suggested Usage Strategies
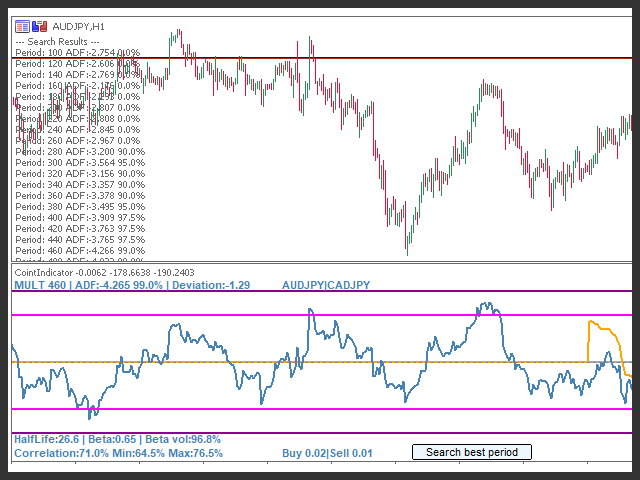
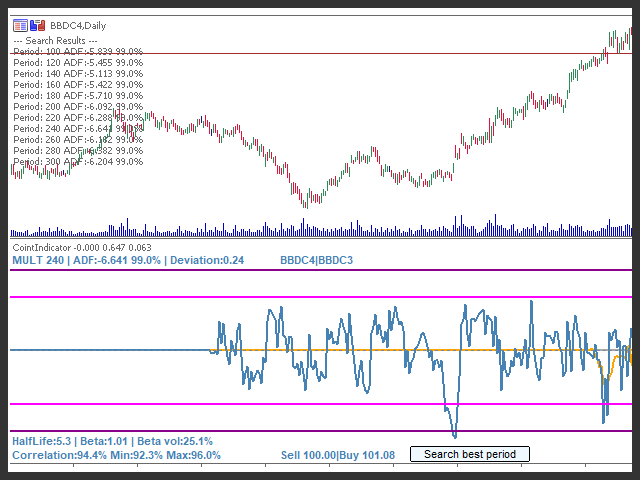
(a) Verify if that the pair is cointegrated by the ADF test (Augmented Dickey-Fuller Test). 0% means the pair is not cointegrated; 90% 95% 97.5% and 99% means it is cointegrated (the greater the better).
(b) Check if beta is positive or negative and the pair correlation.
If beta is positive check if the correlation is positive (Fisher test always greater than zero, Min > 0%).
If beta is negative check if the correlation is negative (Fisher test always lesser than zero, Max < 0%).
When the residual line (blue) reaches the bottom band buy the main asset and sell the secondary asset (expecting a reversal to normality).
When the residual line (blue) reaches the bottom band buy the main asset and buy the secondary asset (expecting a reversal to normality).
Lot Size Proportion
The lot size proportion is given by beta. To know secondary asset lot size just multiply primary asset lot by beta.
Ex: For beta 0.5 and primary lot = 10 secondary lot size would be 5.
Parameter list
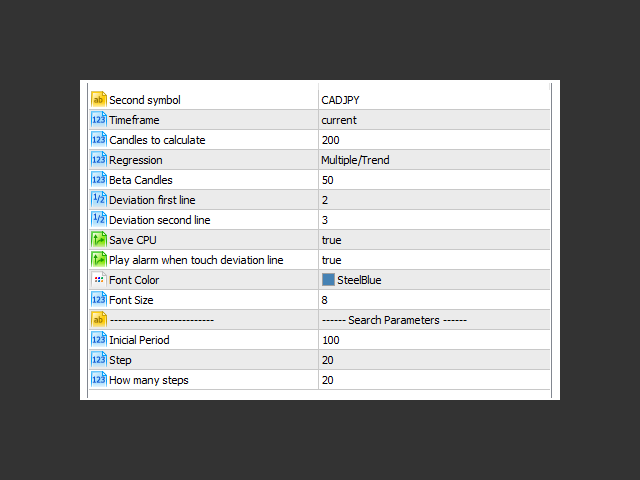
Second symbol: Second Asset
Timeframe: What timeframe to use in calculations
Candles to calculate: How many candles to run the tests (ADF, Fisher)
Regression: Linear regression type, simple or multiple (with trend)***
Beta candles: How many candles calculate beta variation/beta rotation (yellow line)
Deviation first line: Standard deviations to plot first line
Deviation second line: Standard deviations to plot second line
Save CPU: Recalculate only when closing a candle (and not on any price change)
Play Alarm: Play alarm when residual is beyond first deviation line
Important! AxB cointegration is different than BxA
Its correlation (ratio and Fisher) is the same but
not the cointegration (ADF test and the linear regression to calculate
normality and residual standard deviations).
So, AxB may not be cointegrated and not recommended for trading but BxA may be cointegrated
and triggering a trade.
*** Warning: to calculate a multiple linear regression is a CPU hungry process. This
is impossible to change and the code is already optimized to its maximum. If
“Beta Candles” is set to 50, 100 multiple linear regressions will be calculated
to compared each linear regression individual beta. When calculating, a CPU
usage spike is to be expected, especially if using the indicator on multiple
pairs. If indicator became too slow, try to reduce beta candles.





A very good communication with Lucas allowed me to understand and use his Cointegration Pair trading at best.