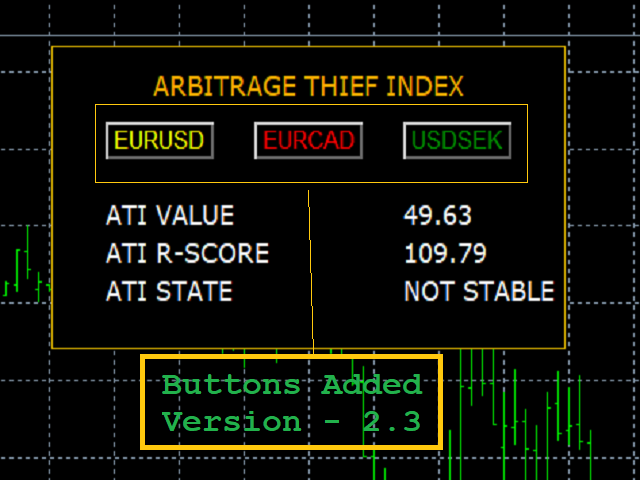
Arbitrage Thief Index
- 지표
- Philip Pankaj Suthagar
- 버전: 2.90
- 업데이트됨: 14 3월 2023
- 활성화: 10
"It's not about how much you do, but how much love you put into what you do that counts." - Mother Teresa
Unlock the ultimate trading advantage today with the Arbitrage Thief Index. Throughout my successful trading career, this powerful indicator has been my secret weapon for securing perfect entry and exit points, ensuring consistent and safe profits. Now, I'm excited to share this revolutionary strategy with you. Top fund managers diversify their trades across multiple instruments to build a winning portfolio, and now you can too.
Recommended TimeFrame:
- M30 & H1
Why Choose Arbitrage Thief Index?
- Perfect for both novice and experienced traders.
- Low-risk entries that maximize your profit potential.
- Reliable performance with no repainting.
- Comprehensive solution with no need for additional indicators.
- A complete trading strategy in one tool.
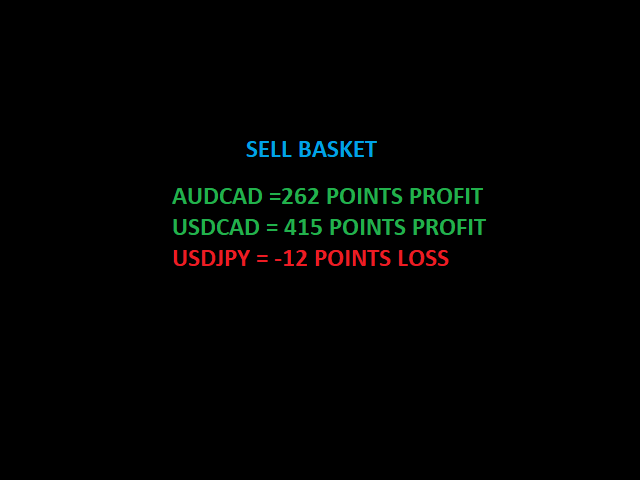
- Ideal for scalping basket trades with precision.
- User-friendly and easy to use.
- Effective in both trending and non-trending markets.
- Real-time alerts via popup, push notification, and email.
- Seamless integration with Expert Advisors.
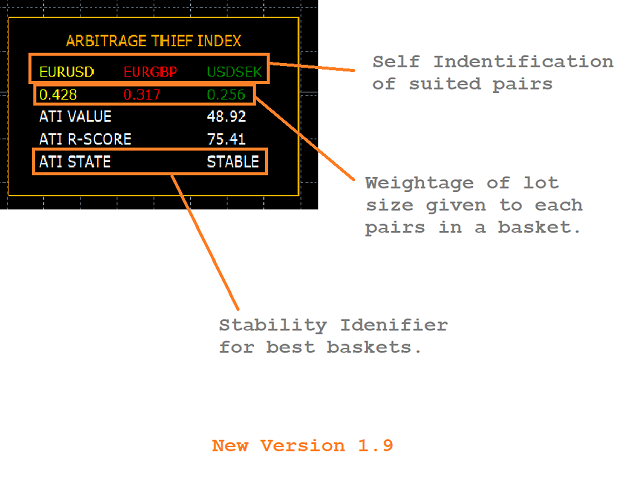
- Quickly identifies the best arbitrage opportunities with customizable parameters.
- Monitors multiple correlated currencies to pinpoint the optimal entry points.
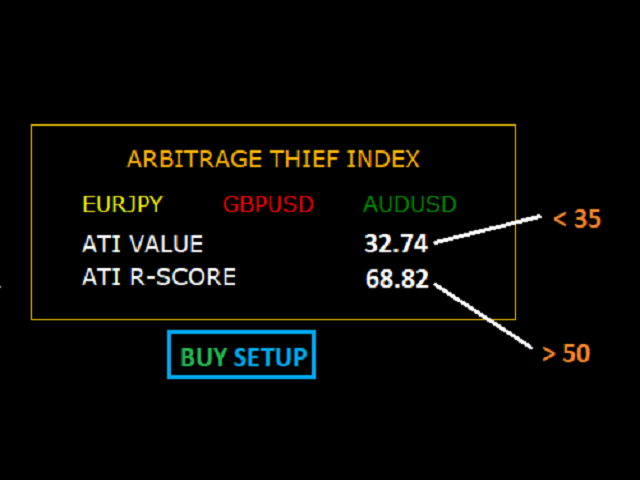
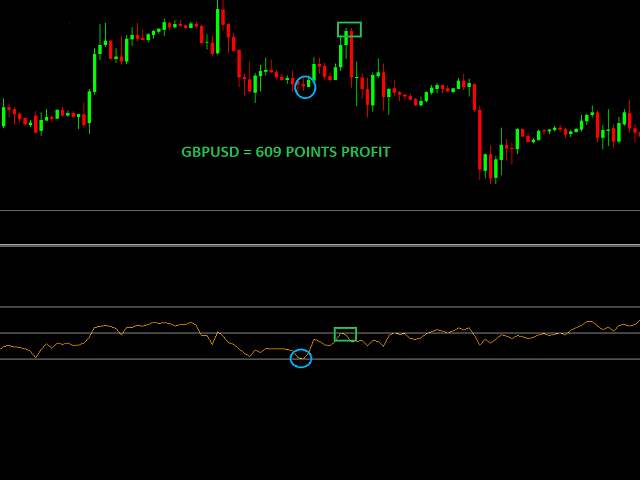
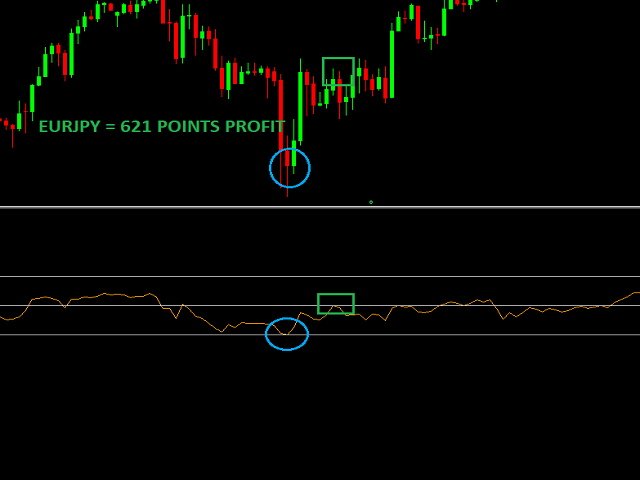
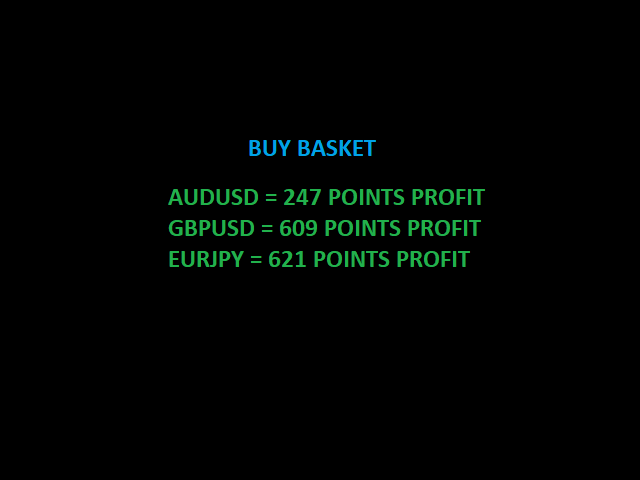
BUY Trade Condition:
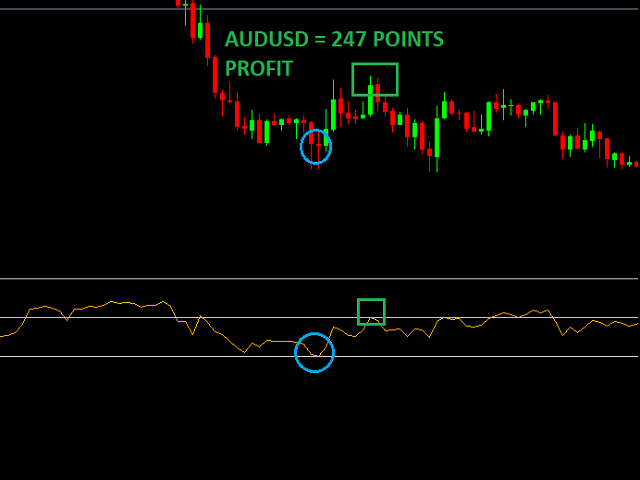
- Buy all three currency pairs when ATI drops below 35 and ATI R-SCORE exceeds 50.
- Secure your profits by closing trades when ATI reaches 50.
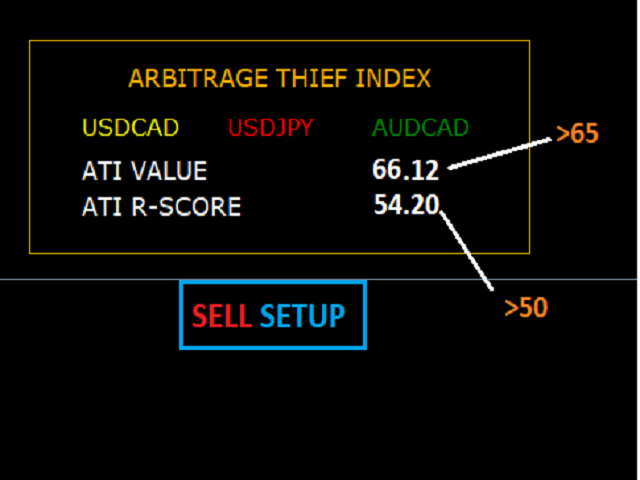
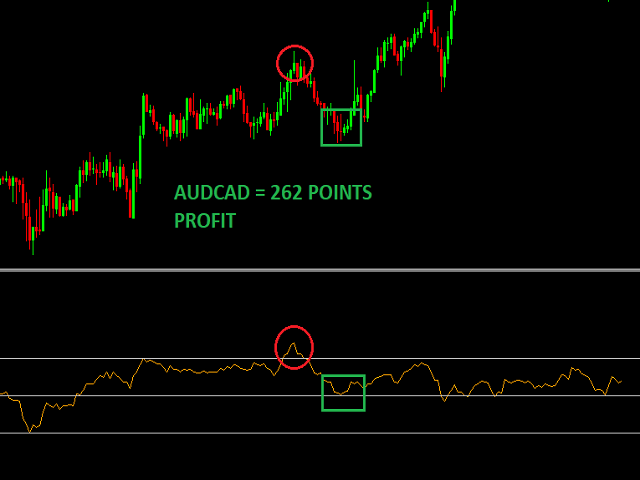
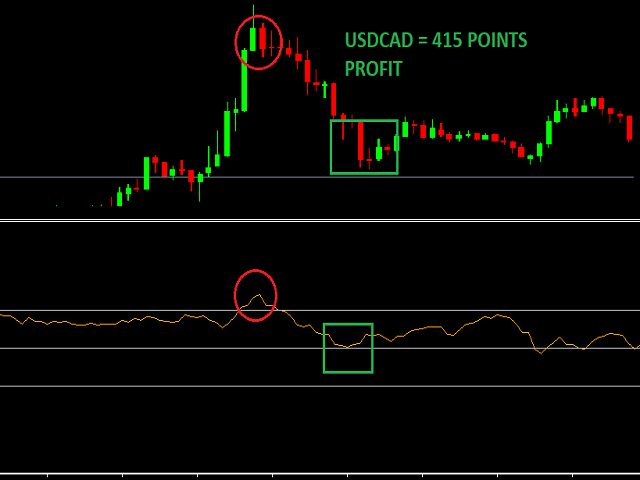
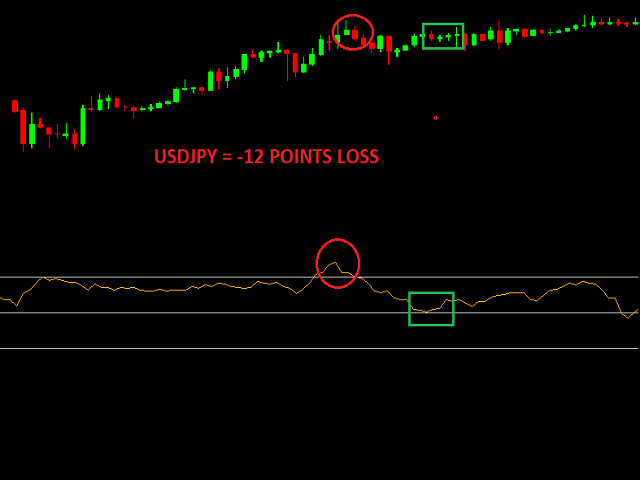
SELL Trade Condition:
- Sell all three currency pairs when ATI exceeds 65 and ATI R-SCORE is above 50.
- Close trades when ATI touches 50.
Exclusive Features:
- Instant popup alerts
- Timely email notifications
- Convenient push notifications
Combine the Arbitrage Thief Index with other indicators to craft your unique trading strategy. Avoid trading during high-volatility/news events to maximize your success. Master this indicator to unlock its full potential. Practice your strategy in a demo account before going live for best results.
Act now to elevate your trading game. The Arbitrage Thief Index is designed to bring you consistent profits and peace of mind.
[CHECK OUT THE VIDEO DEMONSTRATION BELOW] - FOR SELECTING THE PERFECT BASKET OF CURRENCY SYMBOLS


Excellent indicator, excellent support from author