• 미리보기
  • 리뷰 (8)
  • 코멘트
  • 새 소식

Chaikin Volatility Indicator

4.33

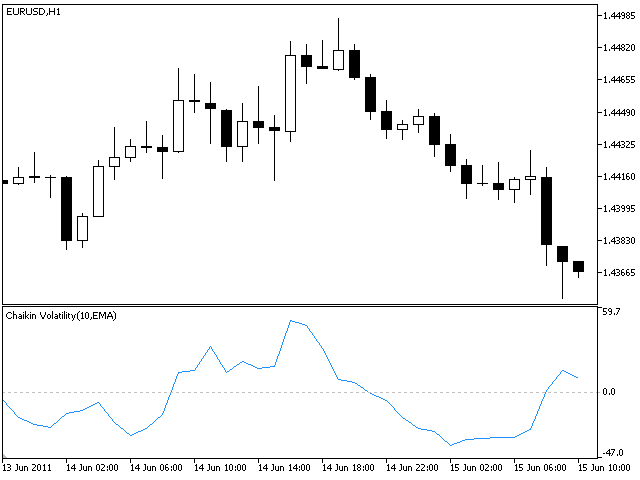
Chaikin's volatility indicator calculates the spread between the maximum and minimum prices. It judges the value of volatility basing on the amplitude between the maximum and the minimum. Unlike Average True Range, Chaikin's indicator doesn't take gaps into account.

According to Chaikin's interpretation, a growth of volume indicator in a relatively short space of time means that the prices approach their minimum (like when the securities are sold in panic), while a decrease of volatility in a longer period of time indicates that the prices are on the peak (for example, in the conditions of a mature bull market).

추천 제품
BoxInside MT5
Evgeny Shevtsov
5 (3)
This indicator calculates the volume profile and places labels that correspond to the VAH, VAL and POC levels, for each candle individually. Indicator operation features The indicator works on the timeframes from M3 to MN, but it uses the history data of smaller periods: M1 - for periods from M3 to H1, M5 - for periods from H2 to H12, M30 - for the D1 period, H4 - for the W1 period, D1 - for the MN period. The color and location of the VAL, VAH and POC labels on the current candle are consider
FREE
Value Chart Candlesticks
Flavio Javier Jarabeck
4.75 (8)
The idea of a Value Chart indicator was presented in the very good book I read back in 2020 , " Dynamic Trading Indicators: Winning with Value Charts and Price Action Profile ", from the authors Mark Helweg and David Stendahl. The idea is simple and the result is pure genius: Present candlestick Price analysis in a detrended way! HOW TO READ THIS INDICATOR Look for Overbought and Oversold levels. Of course, you will need to test the settings a lot to find the "correct" one for your approach.
FREE
AvgVolumes
Marco Montemari
5 (1)
This indicator is based on Volumes standard indicator, calculates the average of Volumes based on the last N bars set by users, and if the value of the volume is bigger then a set % respect the average a different color will be used. The indicator is shown in a separate indicator window. This version has now a limitation in setting the % about the threshold. If you are interested to set threshold consider to buy the PRO version ( https://www.mql5.com/en/market/product/35925 ) If you want to use
FREE
Dual RSI
Paul Conrad Carlson
Indicator alerts for Dual Relative strength index rsi. Large rsi preset at 14 is below 30 small rsi preset at 4 is below 10 for buy bullish signals . Large rsi preset are 14 is above 70 small rsi preset at 4 is above 90 for sell bearish signals . Includes mobile and terminal alerts. draws lines when alerts. This indicator can help identify extremes and then the tops or bottoms of those extremes .
FREE
Indicators are professional data statistics, position orders, historical order analysis->>>>>> <This version is in Chinese -> English version please move> Necessary for traders: tools and indicators Waves automatically calculate indicators, channel trend trading Perfect trend-wave automatic calculation channel calculation , MT4 Perfect trend-wave automatic calculation channel calculation , MT5 Local Trading copying Easy And Fast Copy , MT4 Easy And Fast Copy , MT5 Local Trading copying For DE
FREE
Original MACD
Kirill Paskhin
5 (5)
Moving Average Convergence/Divergence — схождение/расхождение скользящих средних — технический индикатор, разработанный Джеральдом Аппелем (Gerald Appel), используемый в техническом анализе для проверки силы и направления тренда, а также определения разворотных точек. Встроенный в MetaTrader 5 индикатор MACD не соответствует задумке автора (Gerald Appel): -линия MACD графически изображена в виде гистограммы, однако гистограммой отражается разница между линией MACD и сигнальной линией;  -сигнал
FREE
Follow The Line MT5
Oliver Gideon Amofa Appiah
4.48 (27)
This indicator obeys the popular maxim that: "THE TREND IS YOUR FRIEND" It paints a GREEN line for BUY and also paints a RED line for SELL. (you can change the colors). It gives alarms and alerts of all kinds. IT DOES NOT REPAINT and can be used for all currency pairs and timeframes. Yes, as easy and simple as that. Even a newbie can use it to make great and reliable trades. NB: For best results, get my other premium indicators for more powerful and reliable signals. Get them here: https://www.m
FREE
Zona de Consolidacao
Edilson Domingos
5 (1)
It makes it easier to see where there have been consolidation zones for previous prices and allows you to highlight the histogram where there is the biggest consolidation zone. Input parameters Intervalo de preço Is the price between the histograms Periodo Number of candle sticks to be analyzed Porcentagem Highlights the histogram where there is minimal consolidation in relation to the analyzed period
FREE
Price Momentum
Flavio Javier Jarabeck
5 (8)
Value Chart indicator presents the Price evolution in a new form. This indicator, Price Momentum , was developed taking all the calculations presented in the book " Dynamic Trading Indicators " by Mark W. Helweg and David Stendahl (2002). The technique involves de-trended Prices from a user-defined Period of analysis and the addition of a Volatility index correction. The result is an Oscillator with 3 zones: Fair Price Value, Overbought/Oversold and Extremely Overbought/Oversold zones. Adding th
FREE
Matrix Arrow Indicator Multi Timeframe Panel MT5 는 Matrix Arrow Indicator MT5 를 위한 무료 추가 기능이자 훌륭한 자산입니다. 5개의 사용자 맞춤형 타임프레임과 총 16개의 수정 가능한 기호/기기에 대한 현재 매트릭스 화살표 표시기 MT5 신호를 보여줍니다. 사용자는 Matrix Arrow Indicator MT5 로 구성된 10개의 표준 표시기를 활성화/비활성화할 수 있습니다. Matrix Arrow Indicator MT5 에서와 같이 10개의 모든 표준 지표 속성도 조정 가능합니다. 매트릭스 화살표 표시기 다중 시간 프레임 패널 MT5는 16개의 수정 가능한 기호 버튼 중 하나를 클릭하여 첨부된 현재 차트를 변경할 수 있는 옵션도 제공합니다. 이렇게 하면 다른 기호 간에 훨씬 빠르게 작업할 수 있고 다시는 거래 기회를 놓치지 않을 수 있습니다. 이 무료 Matrix Arrow Indicator Multi Time
FREE
LT Weis Waves
Thiago Duarte
5 (9)
The Weis Wave first takes the market volume and then organizes it with the price into Wave charts. It is the only software that will present the true picture of the market before you. If anyone of you, has watched an intraday price movement then you must know that it unfolds in a series of selling as well as buying waves-a procedures tearing down and building up. Wave analysis is an integral part of the trading method. The indicator helps to deal with today’s volatile market. Moreover, it works
FREE
PZ The Zone MT5
PZ TRADING SLU
5 (1)
This indicator displays buy or sell signals according to Bill Williams' definition of the Trading Zone. [ Installation Guide | Update Guide | Troubleshooting | FAQ | All Products ] Easy to use and understand Avoid trading flat markets Deterministic indicator with clear rules The indicator is non-repainting It implements alerts of all kinds It has straightforward trading implications. A blue arrow is a buy signal A red arrow is a sell signal According to Bill Williams trading in the zone helps t
FREE
Laguerre Filter
Fernando Lahude Ritter
Laguerre Indicator with Gamma Input Overview: The Laguerre Indicator is a sophisticated financial analysis tool designed to provide traders and investors with a dynamic and responsive method to track market trends. Its core functionality is centered around a unique algorithm that adapts to market volatility, offering clearer insights compared to traditional indicators. Key Feature - Gamma Input: Gamma: The sole input for the Laguerre Indicator, 'gamma,' plays a pivotal role in calibrating the i
FREE
Tick Bars
Henrique Helmuth Kreutz Pfeifer
Indicator that show candlestick bars with an different sampling method than time fixed. Real time data is sourced to the indicator and it may be used as substitute of the default graph. Each bar is formed when a predefined amount of ticks is received, showing in the graph the OHLC of this clusteri of ticks. The input variable is the amount of ticks of each bar. It's a different approach of sampling, the amount of bars is proportional to the amount of negotiations insted of a sample in a fixed am
FREE
FractalEfficiencyIndicator   A ratio between 0 and 1 with the higher values representing a more efficient or trending market,  It is used in the calculation of Perry J. Kaufman Adaptive Moving Average (KAMA), dividing the price change over a period by the absolute sum of the price movements that occurred to achieve that change. The Fractal Efficiency or also known as Efficiency Ratio was first published by Perry J. Kaufman in his book   ‘Smarter Trading‘. This is mostly considered a filter for v
FREE
Aggression Volume
Flavio Javier Jarabeck
4.14 (14)
Aggression Volume Indicator is the kind of indicator that is rarely found in the MQL5 community because it is not based on the standard Volume data provided by the Metatrader 5 platform. It requires the scrutiny of all traffic Ticks requested on the platform... That said, Aggression Volume indicator requests all Tick Data from your Broker and processes it to build a very special version of a Volume Indicator, where Buyers and Sellers aggressions are plotted in a form of Histogram. Additionally,
FREE
Cumulative Delta MT5
Evgeny Shevtsov
4.5 (48)
The indicator analyzes the volume scale and splits it into two components - seller volumes and buyer volumes, and also calculates the delta and cumulative delta. The indicator does not flicker or redraw, its calculation and plotting are performed fairly quickly, while using the data from the smaller (relative to the current) periods. The indicator operation modes can be switched using the Mode input variable: Buy - display only the buyer volumes. Sell - display only the seller volumes. BuySell -
FREE
Smart Depth Of Market
Evgeny Shevtsov
4.25 (16)
The indicator displays the orders book, as well as increases its depth, remembering the location of orders that have gone beyond the current "window" view. Indicator capability Display the levels of open positions. Simulation of placing/cancelling/editing pending orders directly in the displayed orders book. Indicator features The orders book display works only on those trading symbols for which it is broadcast by the broker. To reset the information about the rows that were recorded in the
FREE
SSACD - Singular Spectrum Average Convergence/Divergence This is an analogue of the MACD indicator based on the Caterpillar-SSA ( Singular Spectrum Analysis ) method. Limited version of the SSACD Forecast indicator. Limitations include the set of parameters and their range. Specificity of the method The Caterpillar-SSA is an effective method to handle non-stationary time series with unknown internal structure. The method allows to find the previously unknown periodicities of the series and mak
FREE
MACD Colored ZeroLag
Farzin Sadeghi Bonjar
4 (3)
It is the MQL5 version of zero lag MACD that was available for MT4 here: https://www.mql5.com/en/code/9993 Also there was a colored version of it here but it had some problems: https://www.mql5.com/en/code/8703 I fixed the MT4 version which has 95 lines of code. It took me 5 days to write the MT5 version.(reading the logs and testing multiple times and finding out the difference of MT5 and MT4!) My first MQL5 version of this indicator had 400 lines of code but I optimized my own code again and n
FREE
Mitimom
Danil Poletavkin
The indicator is based on Robert Miner's methodology described in his book "High probability trading strategies" and displays signals along with momentum of 2 timeframes. A Stochastic oscillator is used as a momentum indicator. The settings speak for themselves period_1 is the current timeframe, 'current' period_2 is indicated - the senior timeframe is 4 or 5 times larger than the current one. For example, if the current one is 5 minutes, then the older one will be 20 minutes The rest of the
FREE
TrendBox Indicator MT5
Ivan Grachev
5 (7)
The indicator looks for consolidation (flat) in the market at a certain time, builds a box-channel and marks levels indented from it for a breakdawn. After crossing one of the levels, the indicator marks the zone for take profit and calculates the corresponding profit or loss in the direction of this entry on the panel. Thus, the indicator, adjusting to the market, finds a flat area of the market, with the beginning of a trend movement to enter it. Version for MT4: https://www.mql5.com/en/market
FREE
OsMA DA
Vitaly Dodonov
5 (1)
Что такое OsMA DA?   Индикатор OsMA DA – это осциллятор, который построен на показаниях другого осциллятора – MACD. OsMA DA показывает расхождение между сигнальной линией MACD и его гистограммой. Момент пересечения гистограммы и линии – это нулевая отметка OsMA.   Если гистограмма MACD поднимается выше линии, то гистограмма самого OsMA DA поднимается выше нулевой отметки. В обратной ситуации OsMA DA демонстрирует отрицательные значения.   OsMA DA более узконаправленный индикатор, чем MACD. OsMA
FREE
MACD with Histogram Color Change
Tiago Azevedo Amorim Martins
This Indicator works as a momentum oscillator however it is most used to surf the trends. Despite of being an oscillator, MACD (Moving Average Convergence/Divergence) doesn't work with over limit conditions (such as OverBought or OverSold). Graphically it's shown as two lines and an histogram with the diference of them. Standard metatrader has this indicator, however with only the two lines and without the histogram. This way it is much easier to read and uderstand it.
FREE
RelicusRoad MACD v2 MT5
Relicus LLC
4.86 (7)
이동 평균 수렴 발산(MACD) 거래 전략은 추세와 흐름 방향의 변화를 식별하는 데 사용되는 인기 있는 기술 분석 도구입니다. MACD는 12기간의 지수 이동 평균(EMA)에서 26기간의 EMA를 빼서 계산됩니다. "신호 선"이라고 불리는 9기간의 EMA는 MACD 위에 표시되어 매수 및 매도 신호를 트리거로 작용합니다. MACD 선이 신호 선 위에 있으면 매수 트렌드로 간주되고, 신호 선 아래에 있으면 매도 트렌드로 간주됩니다. 거래자들은 종종 이 정보를 사용하여 잠재적인 매수 및 매도 기회를 파악합니다. MACD는 다양한 방식으로 사용될 수 있는 다재다능한 지표입니다. 일반적으로 사용되는 몇 가지 방법은 다음과 같습니다. 교차: MACD 선이 신호 선 위로 크로스되면 매수 교차가 발생하고, MACD 선이 신호 선 아래로 크로스되면 매도 교차가 발생합니다. 발산: MACD가 새로운 고점을 형성하면서 기초 자산이 그렇지 않은 경우 매수 발산이 발생하고, MACD가 새로운 저점을 형성
FREE
Donchian Pro
Paulo Henrique Faquineli Garcia
5 (2)
The Donchian Channel Channels are among the most popular tools of technical analysis, as they visually convey to the analyst the limits within which most price movement tends to occur. Channel users know that valuable information can be obtained at any time, whether prices are in the central region of a band or close to one of the border lines. One of the best known techniques to explore these concepts is Bollinger Bands. However, John Bollinger was not the only one to research the applicatio
FREE
Curver Arrows
Francis Dube
3.75 (4)
This indicator is a straight port of a well known MetaTrader 4 indicator that is freely available on the Internet. It does not redraw at all. It implements a type of breakout strategy. The arrows indicate market direction. Use the indicator on M15 charts and higher. The indicator draws two bands near price action and generates signals when the price closes below the lower band and also above the upper band. The indicator uses periodic highs and lows to calculate upper and lower threshold bands.
FREE
Aggression Wave RSJ
JETINVEST
4.83 (6)
This indicator sums up the difference between the sells aggression and the buys aggression that occurred in each Candle, graphically plotting the waves of accumulation of the aggression volumes.   Through these waves an exponential average is calculated that indicates the direction of the business flow. Note: This indicator DOES NOT WORK for Brokers and/or Markets WITHOUT the type of aggression (BUY or SELL).   Be sure to try our Professional version with configurable features and alerts:  Agr
FREE
FRB Support and Resistance
Fernando Baratieri
5 (2)
FRB Trader - Our mission is to provide the best support to customers through conted and tools so that they can achieve the expected results FRB Support and Resistance - Indicator places lines on the chart to show Support and Resistance regions. - You can choose the timeframe you want to calculate, as well as the colors of the lines. - Algorithm calculates the points where the strengths of the asset are considered and are extremely important for decision making.
FREE
True Volatility
Cristian Eriksson
5 (1)
ATR is an excellent indicator to visualize if volatility is increasing or decreasing. But what if you want to compare the volatility to another pair or instrument? Since each pair with different quote currency has different pip value, the output of the ATR doesn't really say that much. Comparing pairs to other instruments is even harder.  What you as a trader care about is how much the pair has moved up or down in percentage, therefore normalizing ATR to percent would make things much easier.  T
FREE
이 제품의 구매자들이 또한 구매함
Atomic Analyst MT5
Issam Kassas
4.5 (16)
우선적으로 언급할 점은이 거래 지표가 다시 그리지 않고 지연되지 않으며 이를 통해 수동 및 로봇 거래 모두에 이상적이라는 점입니다. 사용자 매뉴얼: 설정, 입력 및 전략. Atomic Analyst는 가격의 강도와 모멘텀을 활용하여 시장에서 더 나은 이점을 찾는 PA Price Action Indicator입니다. 고급 필터를 장착하여 잡음과 거짓 신호를 제거하고 거래 잠재력을 높이는 데 도움이 됩니다. 복잡한 지표의 다중 레이어를 사용하여 Atomic Analyst는 차트를 스캔하고 복잡한 수학적 계산을 간단한 신호와 색상으로 변환하여 초보 트레이더가 이해하고 일관된 거래 결정을 내릴 수 있도록합니다. "Atomic Analyst"는 새로운 및 경험이 풍부한 트레이더를위한 종합적인 거래 솔루션입니다. 프리미엄 지표와 최고 수준의 기능을 하나의 거래 전략에 결합하여 모든 종류의 트레이더에 대한 다재다능한 선택지가되었습니다. 인트라데이 거래 및 스캘핑 전략 : 빠르고 정확한
우선 이 거래 시스템이 리페인팅, 리드로잉 및 레이그 인디케이터가 아니라는 점을 강조하는 것이 중요합니다. 이는 수동 및 로봇 거래 모두에 이상적인 것으로 만듭니다. 온라인 강좌, 설명서 및 프리셋 다운로드. "스마트 트렌드 트레이딩 시스템 MT5"은 새로운 및 경험이 풍부한 트레이더를 위해 맞춤형으로 제작된 종합적인 거래 솔루션입니다. 10개 이상의 프리미엄 인디케이터를 결합하고 7개 이상의 견고한 거래 전략을 특징으로 하여 다양한 시장 조건에 대한 다목적 선택이 가능합니다. 트렌드 추종 전략: 효과적인 트렌드 추이를 타기 위한 정확한 진입 및 손절 관리를 제공합니다. 반전 전략: 잠재적인 트렌드 반전을 식별하여 트레이더가 범위 시장을 활용할 수 있게 합니다. 스캘핑 전략: 빠르고 정확한 데이 트레이딩 및 단기 거래를 위해 설계되었습니다. 안정성: 모든 인디케이터가 리페인팅, 리드로잉 및 레이그가 아니므로 신뢰할 수 있는 신호를 보장합니다. 맞춤화: 개별 거래 선호도를 고려한 맞춤
Atbot
Zaha Feiz
5 (18)
AtBot: 작동 방식 및 사용 방법 ### 작동 방식 MT5 플랫폼용 "AtBot" 지표는 기술 분석 도구의 조합을 사용하여 매수 및 매도 신호를 생성합니다. 01:37 단순 이동 평균(SMA), 지수 이동 평균(EMA), 평균 진폭 범위(ATR) 지수를 통합하여 거래 기회를 식별합니다. 또한 Heikin Ashi 캔들을 사용하여 신호의 정확성을 향상시킬 수 있습니다. 구매 후 리뷰를 남기면 특별 보너스 선물을 받게 됩니다. ### 주요 기능: - 비재표시: 신호는 플로팅 후 변경되지 않습니다. - 비재작성: 신호는 일관되며 변경되지 않습니다. - 지연 없음: 지연 없이 시기적절한 신호를 제공합니다. - 다양한 시간대: 거래 전략에 맞게 모든 시간대에서 사용할 수 있습니다. ### 운영 단계: #### 입력 및 설정: - firstkey (TrendValue): 추세 감지의 민감도를 조정합니다. - Secondkey (SignalValue): 매수/매도 신호 생성의 민감도를 정의
TPSproTREND PrO MT5
Roman Podpora
4.89 (9)
TPSpro TREND PRO  - is a trend indicator that automatically analyzes the market and provides information about the trend and each of its changes, as well as giving signals for entering trades without redrawing! The indicator uses each candle, analyzing them separately. referring to different impulses - up or down impulse. Exact entry points into transactions for currencies, crypto, metals, stocks, indices!  Version MT4               DETAILED DESCRIPTION               R ecommended to use with an
TPSpro RFI Levels MT5
Roman Podpora
4.63 (8)
Reversal First Impulse levels (RFI)      INSTRUCTIONS        RUS       -       ENG              R ecommended to use with an indicator   -   TPSpro  TREND PRO -  Version MT4                 A key element in trading is zones or levels from which decisions to buy or sell a trading instrument are made. Despite attempts by major players to conceal their presence in the market, they inevitably leave traces. Our task was to learn how to identify these traces and interpret them correctly. Main functi
Gold Stuff mt5
Vasiliy Strukov
4.9 (125)
Gold Stuff mt5는 금을 위해 특별히 설계된 추세 지표이며 모든 금융 상품에서도 사용할 수 있습니다. 표시기가 다시 그려지지 않고 지연되지 않습니다. 권장 기간 H1. 설정 및 개인 보너스를 받으려면 구매 후 즉시 저에게 연락하십시오!     강력한 지원 및 트렌드 스캐너 표시기의 무료 사본을 받으실 수 있습니다. 메시지를 보내주세요. 나!   설정 화살표 그리기 - 켜기 끄기. 차트에 화살표 그리기. 경고 - 가청 경고를 끕니다. 이메일 알림 - 켜기 끄기. 이메일 알림. Puch-notification - 켜기 끄기. 푸시 알림. 다음으로 색 영역을 조정합니다. Gold Stuff mt5는 금을 위해 특별히 설계된 추세 지표이며 모든 금융 상품에서도 사용할 수 있습니다. 표시기가 다시 그려지지 않고 지연되지 않습니다. 권장 기간 H1. 설정 및 개인 보너스를 받으려면 구매 후 즉시 저에게 연락하십시오!   설정 화살표 그리기 - 켜기 끄기. 차트에
Quantum Trend Sniper
Bogdan Ion Puscasu
4.78 (46)
소개       Quantum Trend Sniper Indicator는   추세 반전을 식별하고 거래하는 방식을 변화시키는 획기적인 MQL5 지표입니다! 13년 이상의 거래 경험을 가진 숙련된 트레이더 팀이 개발한       Quantum Trend Sniper 표시기       매우 높은 정확도로 추세 반전을 식별하는 혁신적인 방법으로 거래 여정을 새로운 차원으로 끌어올리도록 설계되었습니다. ***Quantum Trend Sniper Indicator를 구입하면 Quantum Breakout Indicator를 무료로 받을 수 있습니다!*** Quantum Trend Sniper Indicator는 추세 반전을 식별하고 세 가지 이익실현 수준을 제안할 때 경고, 신호 화살표를 제공합니다. 초보자 거래자와 전문 거래자 모두에게 적합합니다. Quantum EA 채널:       여기를 클릭하세요 MT4 버전:       여기를 클릭하세요
Trend Screener Pro MT5
STE S.S.COMPANY
4.86 (56)
트렌드 표시기, 트렌드 트레이딩 및 필터링을 위한 획기적인 고유 솔루션, 하나의 도구 안에 내장된 모든 중요한 트렌드 기능! Forex, 상품, 암호 화폐, 지수 및 주식과 같은 모든 기호/도구에 사용할 수 있는 100% 다시 칠하지 않는 다중 시간 프레임 및 다중 통화 표시기입니다. Trend Screener는 차트에 점이 있는 화살표 추세 신호를 제공하는 효율적인 지표 추세 추종 지표입니다. 추세 분석기 표시기에서 사용할 수 있는 기능: 1. 트렌드 스캐너. 2. 최대 이익 분석이 있는 추세선. 3. 추세 통화 강도 측정기. 4. 경고가 있는 추세 반전 점. 5. 경고가 있는 강력한 추세 점. 6. 추세 화살표 Trend Screener Indicator가 있는 일일 분석 예, 일일 신호 성능...등은 여기에서 찾을 수 있습니다. 여기를 클릭하십시오. LIMITED TIME OFFER : Trend Screener Indicator는 100$ 및 평생 동안만 사용할 수 있습니
FX Power MT5 NG
Daniel Stein
5 (4)
모닝 브리핑 여기 mql5 와 텔레그램에서 FX Power MT5 NG 는 오랫동안 인기 있는 통화 강도 측정기인 FX Power의 차세대 버전입니다. 이 차세대 강도 측정기는 무엇을 제공합니까? 기존 FX Power에서 좋아했던 모든 것 PLUS GOLD/XAU 강도 분석 더욱 정밀한 계산 결과 개별 구성 가능한 분석 기간 더 나은 성능을 위한 사용자 정의 가능한 계산 한도 특별 멀티더 많은 것을보고 싶은 사람들을위한 특별한 다중 인스턴스 설정 모든 차트에서 좋아하는 색상을위한 끝없는 그래픽 설정 수많은 알림 옵션, 중요한 것을 다시는 놓치지 않도록 Windows 11 및 macOS 스타일의 둥근 모서리가 있는 새로운 디자인 마법처럼 움직이는 인디케이터 패널 FX 파워 키 특징 모든 주요 통화의 완전한 강세 이력 모든 시간대에 걸친 통화 강세 이력 모든 브로커 및 차트에서 고유 계산 결과 100% 신뢰할 수있는 실시간100 % 신뢰할 수있는 실시간 계산-> 다시 칠하지 않음
FX Volume MT5
Daniel Stein
5 (12)
모닝 브리핑을 통해 세부 정보와 스크린샷으로 매일 시장 업데이트를 받으세요 여기 mql5 및 텔레그램에서 FX 거래량은 브로커의 관점에서 시장 심리에 대한 실제 통찰력을 제공하는 최초이자 유일한 거래량 지표입니다. 브로커와 같은 기관 시장 참여자가 외환 시장에서 어떤 포지션을 취하고 있는지에 대한 훌륭한 통찰력을 COT 보고서보다 훨씬 빠르게 제공합니다. 차트에서 이 정보를 직접 확인하는 것은 트레이딩의 진정한 판도를 바꾸고 획기적인 솔루션입니다. 다음과 같은 고유한 시장 데이터 인사이트의 이점 비율 는 통화의 매수/매도 포지션 비율을 백분율로 표시 비율 변화 는 선택한 기간 내 매수 비율과 비율 변화를 표시 총 거래량 는 해당 통화의 총 거래량(롱 및 숏)을 로트 단위로 보여줍니다 Volumes Long 는 해당 통화의 모든 롱 포지션의 거래량을 보여줍니다 Volumes Short 는 해당 통화의 모든 숏 포지션의 거래량을 보여줍니다 Net Long 는 순 롱 포지션의 거래량
PZ Divergence Trading MT5
PZ TRADING SLU
3.75 (4)
Unlock hidden profits: accurate divergence trading for all markets Special Offer: Purchase now to receive free bonuses worth $90! (Read more for details) Tricky to find and scarce in frequency, divergences are one of the most reliable trading scenarios. This indicator finds and scans for regular and hidden divergences automatically using your favourite oscillator. [ Installation Guide | Update Guide | Troubleshooting | FAQ | All Products ] Easy to trade Finds regular and hidden divergences S
Entry Points Pro for MT5
Yury Orlov
4.32 (93)
다시 색을 칠하지 않고 거래에 진입할 수 있는 정확한 신호를 제공하는 MT5용 지표입니다. 외환, 암호화폐, 금속, 주식, 지수 등 모든 금융 자산에 적용할 수 있습니다. 매우 정확한 추정값을 제공하고 매수와 매도의 가장 좋은 시점을 알려줍니다. 하나의 시그널로 수익을 내는 지표의 예와 함께 비디오 (6:22)시청하십시오! 대부분의 거래자는 Entry Points Pro 지표의 도움으로 첫 거래 주 동안 트레이딩 결과를 개선합니다. 저희의   Telegram Group 을 구독하세요! Entry Points Pro 지표의 좋은점. 재도색이 없는 진입 신호 신호가 나타나고 확인되면(시그널 캔들이 완성된 경우) 신호는 더 이상 사라지지 않습니다. 여타 보조지표의 경우 신호를 표시한 다음 제거되기 때문에 큰 재정적 손실로 이어집니다. 오류 없는 거래 게시 알고리즘을 통해 트레이드(진입 또는 청산)를 할 이상적인 순간을 찾을 수 있으며, 이를 통해 이를 사용하는 모든 거래자의
우선적으로, 이 거래 도구는 전문적인 거래에 이상적인 비-다시 그리기 및 지연되지 않는 지표입니다.  온라인 강좌, 사용자 매뉴얼 및 데모. 스마트 가격 액션 컨셉트 인디케이터는 신규 및 경험 많은 트레이더 모두에게 매우 강력한 도구입니다. Inner Circle Trader Analysis 및 Smart Money Concepts Trading Strategies와 같은 고급 거래 아이디어를 결합하여 20가지 이상의 유용한 지표를 하나로 결합합니다. 이 인디케이터는 스마트 머니 컨셉트에 중점을 두어 대형 기관의 거래 방식을 제공하고 이동을 예측하는 데 도움을 줍니다.  특히 유동성 분석에 뛰어나 기관이 어떻게 거래하는지 이해하는 데 도움을 줍니다. 시장 트렌드를 예측하고 가격 변동을 신중하게 분석하는 데 탁월합니다. 귀하의 거래를 기관 전략에 맞추어 시장의 동향에 대해 더 정확한 예측을 할 수 있습니다. 이 인디케이터는 시장 구조를 분석하고 중요한 주문 블록을 식별하
RelicusRoad Pro MT5
Relicus LLC
5 (13)
이제 $ 147 (몇 가지 업데이트 후 $ 499 증가) - 무제한 계정 (PCS 또는 MACS) RelicusRoad 사용 설명서 + 교육 비디오 + 비공개 Discord 그룹 액세스 + VIP 상태 시장을 보는 새로운 방법 RelicusRoad는 외환, 선물, 암호화폐, 주식 및 지수에 대한 세계에서 가장 강력한 거래 지표로서 거래자에게 수익성을 유지하는 데 필요한 모든 정보와 도구를 제공합니다. 우리는 초보자부터 고급까지 모든 거래자가 성공할 수 있도록 기술적 분석 및 거래 계획을 제공합니다. 미래 시장을 예측할 수 있는 충분한 정보를 제공하는 핵심 거래 지표입니다. 우리는 차트에서 말이 안 되는 여러 지표 대신 완전한 솔루션을 믿습니다. 타의 추종을 불허하는 매우 정확한 신호, 화살표 + 가격 조치 정보를 표시하는 올인원 표시기입니다. 강력한 AI를 기반으로 하는 RelicusRoad는 누락된 정보와 도구를 제공하여 교육하고 성공적인 트레이더인 트레이딩 전문
IX Power MT5
Daniel Stein
4 (5)
IX Power는   마침내 FX Power의 탁월한 정밀도를 외환이 아닌 기호에도 적용했습니다. 좋아하는 지수, 주식, 원자재, ETF, 심지어 암호화폐까지 단기, 중기, 장기 추세의 강도를 정확하게 파악할 수 있습니다. 단말기가 제공하는   모든 것을 분석할   수 있습니다. 사용해 보고 트레이딩   타이밍이 크게 향상되는   것을 경험해 보세요. IX Power 주요 특징 단말기에서 사용 가능한 모든 거래 심볼에 대해 100% 정확한 비재도장 계산 결과 제공 사전 구성 및 추가적으로 개별 구성 가능한 강도 분석 기간의 드롭다운 선택 가능 이메일, 메시지, 모바일 알림을 통한 다양한 알림 옵션 제공 EA 요청을 위한 액세스 가능한 버퍼 더 나은 성능을 위한 사용자 지정 가능한 계산 한도 더 많은 것을 보고 싶은 사용자를 위한 특별 다중 인스턴스 설정 모든 차트에서 좋아하는 색상을 위한 무한한 그래픽 설정 가능 Windows 11 및 macOS 스타일의 둥
PZ Support Resistance MT5
PZ TRADING SLU
3.75 (4)
Unlock key market insights with automated support and resistance lines Special Offer: Purchase now to receive free bonuses worth $75! (Read more for details) Tired of plotting support and resistance lines? This is a multi-timeframe indicator that detects and plots supports and resistance lines in the chart with the same precision as a human eye would. As price levels are tested over time and its importance increases, the lines become thicker and darker, making price leves easy to glance and ev
가격이 역전되고 후퇴함에 따라 시장 구조가 변경됩니다. 시장 구조 반전 경고 표시기는 추세 또는 가격 움직임이 고갈에 가까워지고 반전할 준비가 되었음을 식별합니다. 일반적으로 반전이나 큰 하락이 일어나려고 할 때 발생하는 시장 구조의 변화를 알려줍니다. 지표는 가능한 고갈 지점 근처에서 새로운 고점 또는 저점이 형성될 때마다 초기에 돌파와 가격 모멘텀을 식별합니다. 표시기는 반대쪽에 있는 마지막 촛불에 직사각형을 그립니다. 그런 다음 현재의 단기 추세에서 계속 움직이기 때문에 가격과 함께 직사각형을 따라갈 것입니다. 가격이 사각형 위나 아래로 다시 닫힐 정도로 약해지면 시장 구조에 잠재적인 변화가 일어나고 있음을 나타냅니다. 그런 다음 표시기는 방향의 잠재적인 이동과 추세 또는 주요 하락의 가능한 반전 시작에 대해 경고합니다. 작동 방식을 보려면 아래의 작동 표시기를 참조하십시오! 모든 쌍 및 주요 기간을 모니터링하는 대시보드: https://www.mql5.com/
Golden Spikes Premium
Kwaku Bondzie Ghartey
Golden Spikes Detector Acknowledgement and Dedications:  The name of this indicator was Inspired by an Original; Mr Grant Koopman; a Knowledgeable and experienced Synthetics trader. I dedicate this indicator to Mr Grant.  Overview: The Golden Spikes Premium is a groundbreaking trading indicator meticulously crafted for the Boom and Crash indices on the Deriv market. Tailored to meet the needs of discerning traders, this powerful tool operates exclusively on the one-minute timeframe, providin
ICT, SMC, SMART MONEY CONCEPTS, SMART MONEY, Smart Money Concept, Support and Resistance, Trend Analysis, Price Action, Market Structure, Order Blocks, BOS/CHoCH,   Breaker Blocks ,  Momentum Shift,   Supply&Demand Zone/Order Blocks , Strong Imbalance,   HH/LL/HL/LH,    Fair Value Gap, FVG,  Premium  &   Discount   Zones, Fibonacci Retracement, OTE, Buy Side Liquidity, Sell Side Liquidity, BSL/SSL Taken, Equal Highs & Lows, MTF Dashboard, Multiple Time Frame, BigBar, HTF OB, HTF Market Structure
Auto Order Block with break of structure based on ICT and Smart Money Concepts (SMC) Futures Break of Structure ( BoS )             Order block ( OB )            Higher time frame Order block / Point of Interest ( POI )    shown on current chart           Fair value Gap ( FVG ) / Imbalance   -  MTF      ( Multi Time Frame )    HH/LL/HL/LH  -  MTF      ( Multi Time Frame )  Choch  MTF      ( Multi Time Frame )  Volume Imbalance     ,  MTF          vIMB Gap’s Power of 3 Equal High
Easy Buy Sell Signal Alert
Franck Martin
4.33 (6)
Easy By Sell is a market indicator for opening and closing positions. It becomes easy to track market entries with alerts. It indicates trend reversal points when a price reaches extreme values ​​and the most favorable time to enter the market. it is as effective as a Fibonacci to find a level but it uses different tools such as an algorithm based on ATR indicators and Stochastic Oscillator. You can modify these two parameters as you wish to adapt the settings to the desired period. My othe
Support And Resistance Screener는 하나의 지표 안에 여러 도구를 제공하는 MetaTrader에 대한 하나의 레벨 지표입니다. 사용 가능한 도구는 다음과 같습니다. 1. 시장 구조 스크리너. 2. 완고한 후퇴 영역. 3. 약세 후퇴 영역. 4. 일일 피벗 포인트 5. 주간 피벗 포인트 6. 월간 피벗 포인트 7. 고조파 패턴과 볼륨에 기반한 강력한 지지와 저항. 8. 은행 수준 구역. LIMITED TIME OFFER : HV 지원 및 저항 표시기는 50 $ 및 평생 동안만 사용할 수 있습니다. ( 원래 가격 125$ ) MQL5 블로그에 액세스하면 분석 예제와 함께 모든 프리미엄 지표를 찾을 수 있습니다. 여기를 클릭하십시오. 주요 특징들 고조파 및 볼륨 알고리즘을 기반으로 하는 강력한 지원 및 저항 영역. Harmonic 및 Volume 알고리즘을 기반으로 한 강세 및 약세 풀백 영역. 시장 구조 스크리너 일간, 주간 및 월간 피벗 포인트. 실제
Gartley Hunter Multi
Siarhei Vashchylka
5 (8)
Gartley Hunter Multi - An indicator for searching for harmonic patterns simultaneously on dozens of trading instruments and on all possible timeframes. Manual (Be sure to read before purchasing) | Version for MT4 Advantages 1. Patterns: Gartley, Butterfly, Shark, Crab. Bat, Alternate Bat, Deep Crab, Cypher 2. Simultaneous search for patterns on dozens of trading instruments and on all possible timeframes 3. Search for patterns of all possible sizes. From the smallest to the largest 4. A
Trend Hunter MT5
Andrey Tatarinov
5 (1)
Trend Hunter 는 Forex, 암호화폐 및 CFD 시장에서 작업하기 위한 추세 지표입니다. 이 지표의 특별한 특징은 가격이 추세선을 약간 돌파할 때 신호를 변경하지 않고 자신있게 추세를 따른다는 것입니다. 표시기는 다시 그려지지 않으며 막대가 닫힌 후에 시장 진입 신호가 나타납니다. 추세를 따라 이동할 때 표시기는 추세 방향에 대한 추가 진입점을 표시합니다. 이러한 신호를 바탕으로 작은 StopLoss로 거래할 수 있습니다. Trend Hunter 는 정직한 지표입니다. 표시 신호 위로 마우스를 가져가면 신호의 잠재적 이익과 가능한 중지가 표시됩니다. 새로운 신호가 나타나면 다음 알림을 받을 수 있습니다. 알리다 푸시 알림 이메일로 알림 텔레그램 알림 차트 스크린샷도 텔레그램으로 전송되므로 거래 결정을 내리기 위해 단말기를 열 필요가 없습니다. 표시 신호는 텔레그램 채널 https://www.mql5.com/ko/market/product/11085#!tab
The 1 2 3 Pattern Scanner MT5
Reza Aghajanpour
5 (13)
** All Symbols x All Timeframes scan just by pressing scanner button ** ***Contact me after purchase to send you instructions and add you in "123 scanner group" for sharing or seeing experiences with other users. After 17 years of experience in the markets and programming, Winner indicator is ready. I would like to share with you! Introduction The 123 Pattern Scanner indicator with a special enhanced algorithm is a very repetitive common pattern finder with a high success rate . Interestingly,
Blahtech Supply Demand MT5
Blahtech Limited
4.54 (13)
Was: $299  Now: $99   Supply Demand uses previous price action to identify potential imbalances between buyers and sellers. The key is to identify the better odds zones, not just the untouched ones. Blahtech Supply Demand indicator delivers functionality previously unavailable on any trading platform. This 4-in-1 indicator not only highlights the higher probability zones using a multi-criteria strength engine, but also combines it with multi-timeframe trend analysis, previously confirmed swings
ATrend
Zaha Feiz
ATREND: 작동 방식 및 사용 방법 ### 작동 방식 MT5 플랫폼을 위한 "ATREND" 지표는 기술 분석 방법론의 조합을 활용하여 트레이더에게 강력한 매수 및 매도 신호를 제공하도록 설계되었습니다. 이 지표는 주로 변동성 측정을 위해 평균 진폭 범위(ATR)를 활용하며, 잠재적인 시장 움직임을 식별하기 위한 트렌드 탐지 알고리즘과 함께 사용됩니다. 구매 후 메시지를 남기면 특별 보너스 선물을 받게 됩니다. 39달러에 8부 남았습니다. ### 주요 특징: - 동적 트렌드 탐지: 이 지표는 시장 트렌드를 평가하고 신호를 조정하여 트레이더가 현재 시장 상황에 맞춰 전략을 조정할 수 있도록 돕습니다. - 변동성 측정: ATR을 사용하여 시장의 변동성을 측정하며, 이는 최적의 손절매(SL) 및 이익 실현(TP) 수준을 결정하는 데 중요합니다. - 신호 시각화: 이 지표는 차트에 매수 및 매도 신호를 시각적으로 표시하여 트레이더의 의사 결정을 향상시킵니다. ### 운영 단계 ###
Matrix Arrow Indicator MT5
Juvenille Emperor Limited
5 (10)
매트릭스 화살표 표시기 MT5 는 외환, 상품, 암호 화폐, 지수, 주식과 같은 모든 기호/도구에 사용할 수 있는 100% 다시 칠하지 않는 다중 기간 표시기를 따르는 고유한 10 in 1 추세입니다.  Matrix Arrow Indicator MT5 는 다음과 같은 최대 10개의 표준 지표에서 정보와 데이터를 수집하여 초기 단계에서 현재 추세를 결정합니다. 평균 방향 이동 지수(ADX) 상품 채널 지수(CCI) 클래식 하이켄 아시 캔들 이동 평균 이동 평균 수렴 발산(MACD) 상대 활력 지수(RVI) 상대 강도 지수(RSI) 포물선 SAR 스토캐스틱 오실레이터 윌리엄스의 백분율 범위 모든 지표가 유효한 매수 또는 매도 신호를 제공하면 강력한 상승/하락 추세를 나타내는 다음 캔들/막대가 시작될 때 해당 화살표가 차트에 인쇄됩니다. 사용자는 사용할 표시기를 선택하고 각 표시기의 매개변수를 개별적으로 조정할 수 있습니다. 매트릭스 화살표 표시기 MT5는 선택한 표시기에서만 정보를 수
Step into the realm of Forex trading with confidence and precision using XQ, a cutting-edge Forex indicator designed to elevate your trading game to unprecedented heights. Whether you're a seasoned trader or just stepping into the world of currency exchange, XQ Forex Indicator empowers you with the insights and signals needed to make informed trading decisions. The signal conditions are a combination of three indicators, and XQ Forex Indicator only display  medium and long-term trends . The ind
PZ Day Trading MT5
PZ TRADING SLU
2.4 (5)
Effortless trading: non-repainting indicator for accurate price reversals Special Offer: Purchase now to receive free bonuses worth $60! (Read more for details) This indicator detects price reversals in a zig-zag fashion, using only price action analysis and a donchian channel. It has been specifically designed for short-term trading, without repainting or backpainting at all. It is a fantastic tool for shrewd traders aiming to increase the timing of their operations. [ Installation Guide | Upd
제작자의 제품 더 보기
Reversal Composite Candles
MetaQuotes Ltd.
3.62 (13)
The idea of the system is to indentify the reversal patterns using the calculation of the composite candle. The reversal patterns is similar to the "Hammer" and "Hanging Man" patterns in Japanese candlestick analysis. But it uses the composite candle instead the single candle and doesn't need the small body of the composite candle to confirm the reversal. Input parameters: Range - maximal number of bars, used in the calculation of the composite candle. Minimum - minimal size of the composite can
FREE
Three Moving Averages
MetaQuotes Ltd.
3.18 (22)
The trade strategy is based on three moving averages. To determine the trend, it uses three exponentially smoothed moving averages: FastEMA, MediumEMA and SlowEMA. Trade signals: Buy signal: FastEMA>MediumEMA>SlowEMA (upward trend). Sell signal: FastEMA<MediumEMA<SlowEMA (downward trend). Input parameters: Inp_Signal_ThreeEMA_FastPeriod = 8; Inp_Signal_ThreeEMA_MediumPeriod = 38; Inp_Signal_ThreeEMA_SlowPeriod = 48; Inp_Signal_ThreeEMA_StopLoss = 400; Inp_Signal_ThreeEMA_TakeProfit = 900; I
FREE
MA Crossover ADX
MetaQuotes Ltd.
3.78 (9)
The strategy is based on price crossover with Moving Average indicator, confirmed by ADX indicator. The trade signals: Buy: closing price of the last completed bar is higher than moving average, the moving average increases at the current and last completed bars. Sell: closing price of the last completed bar is lower than moving average, the moving average decreases at the current and last completed bars. To filter the false signal, it checks the trend power (ADX>ADXmin) and trend direction usin
FREE
Expert Alligator
MetaQuotes Ltd.
3.17 (6)
The strategy is based on the Alligator technical indicator, described by Bill Williams in "Trading Chaos". The system is based on three moving averages (Lips, Teeth and Jaw lines), and oscillators, calculated using the difference between them. The trading signals are generated after crossover of the Alligator lines, depending on trend, determined by order of these lines. In the case of upward trend the Lips line (with minimal period) is the highest, the next is the Teeth line, and the lowest i
FREE
ColorBars Indicator
MetaQuotes Ltd.
3.67 (3)
The ColorBars Indicator paints bars with different colors depending on the volume changes. If the volume has increased, the color is green, overwise the color is red.
FREE
ColorCandlesDaily
MetaQuotes Ltd.
3 (1)
The indicator ColorCandlesDaily draw candles with different colors depending on the day of the week.
FREE
ColorLine Indicator
MetaQuotes Ltd.
3 (1)
The ColorLine indicator shows the line of the price moving average on the chart. The line has diffrent colors (100 bars have the same color). The color settings of the line is changing every 5 ticks, there are 3 color schemes.  Indicator for demonstrating the DRAW_COLOR_LINE style. Draws a line at Close prices in colored pieces of 20 bars. The thickness, style and color of the line sections are changed randomly. The indicator code is published in the MQL5 Documentation in the section Indicator S
FREE
TradeHistoryParsing
MetaQuotes Ltd.
2 (1)
The TradeHistoryParsing is a utility for working with the trade history obtained from the MetaTrader 5 terminal. The product is based on the " RegularExpressions in MQL5 " library. It allows to quickly get the required data on your trading history. The filtering results are displayed as a table, a summary of mathematical statistics is provided below the table. Working with the tool Export the trade report as an html file and place it into the "sandbox". After that, when launching the EA, speci
FREE
The script illustrates the usage of the OBJPROP_XOFFSET and OBJPROP_YOFFSET properties. It displays the specified fragment of the .BMP image.
FREE
RegularExpressionsExamples — is an expert, which contains the graphical interface for running examples from the " RegularExpressions in MQL5 " library. The codes of these examples can be found in the library itself. These examples are for demonstration purposes only. They serve only to evaluate the library operation and its capabilities. They can also be found on the official Microsoft‎ website, in the descriptions of classes in the System.Text.RegularExpressions namespace. Each example can be
FREE
The script ObjChartSample.mql5 illustrates control of chart properties using the classes from the Standard Library .
FREE
The script SphereSample.mq5 illustrates control of graphic objects using the classes from the Standard Library (Base class of objects array CArrayObj , CChartObjectText ).
FREE
필터:
Wan Ping Fei
1690
Wan Ping Fei 2020.09.21 12:36 
 

사용자가 평가에 대한 코멘트를 남기지 않았습니다

[삭제] 2019.01.14 07:27 
 

사용자가 평가에 대한 코멘트를 남기지 않았습니다

Gennadiy Voltornist
11909
Gennadiy Voltornist 2018.01.18 17:14 
 

사용자가 평가에 대한 코멘트를 남기지 않았습니다

Daniel Andrejczuk
5596
Daniel Andrejczuk 2017.11.09 14:03 
 

사용자가 평가에 대한 코멘트를 남기지 않았습니다

Ali irwan
5135
Ali irwan 2017.07.27 12:25 
 

사용자가 평가에 대한 코멘트를 남기지 않았습니다

Rodrigo da Silva Boa
7136
Rodrigo da Silva Boa 2016.03.12 22:19 
 

사용자가 평가에 대한 코멘트를 남기지 않았습니다

Vadim Strelkov
7710
Vadim Strelkov 2014.04.03 14:01 
 

사용자가 평가에 대한 코멘트를 남기지 않았습니다

Alexey Da
4210
Alexey Da 2012.04.26 10:52 
 

사용자가 평가에 대한 코멘트를 남기지 않았습니다

리뷰 답변
버전 1.21 2020.03.31
Скомпилирован в MetaEditor build 2372