Divergence dashboard MT5
- 지표
- Jan Flodin
- 버전: 2.7
- 업데이트됨: 26 8월 2024
- 활성화: 10
I recommend you to read the product's blog (manual) from start to end so that it is clear from the beginning what the indicactor offers.
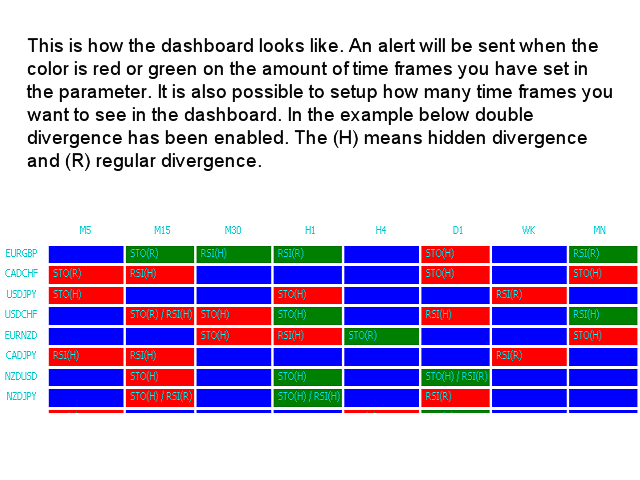
This multi time frame and multi symbol divergence dashboard indicator sends an alert when one or two different divergences have been identified. It can be used with all time frames from M1 to MN. Maximum 9 time frames can be shown in the dashboard at the same time. It is possible to enable moving average, RSI or Bollinger bands trend filter to filter out only the strongest setups. It should be combined with your own confirmation rules, techniques and indicators. Then this indicator will allow you to create (or enhance) your own powerful system.
Features
- Can detect divergences for following oscillators/indicators: MACD, Stochastics, OsMA, RSI, CCI, Awesome, OBV, ADX, ATR, MFI, Momentum, Accelerator and Constance Brown Composite index.
- It is possible to select up to 9 time frames to be used.
- Continuously performs a divergence rank sorting within the dashboard.
- By clicking inside a rectangle a new chart will be opened with the symbol and time frame in question.
- The indicator can write the signals to global variables which can be used by an Expert Advisor for auto trading.
It is enough to place the indicator on one chart and you will receive an alert from any symbol of your choice.
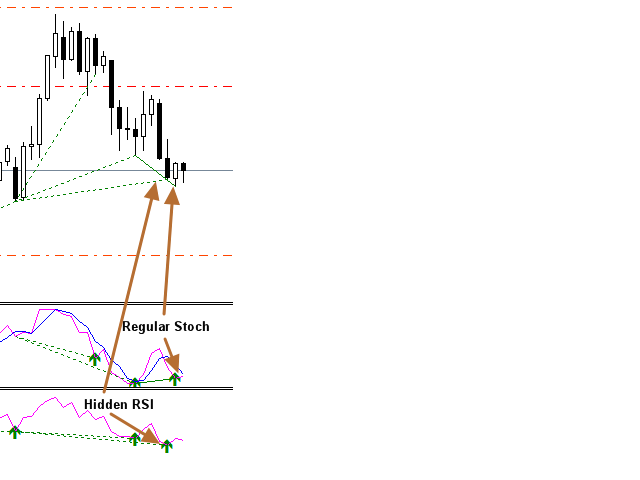
Both regular/classical (trend reversal) and hidden (trend continuation) divergences will be taken into consideration. Hence there could be a regular divergence and at the same time a hidden divergence on another time frame. Please see screenshot #3 below. The example is showing divergences from 2 indicators but it could also be from one and the same indicator. It is possible though to set if to use only regular or only hidden divergences by changing a parameter.
Input parameters
Please note that this indicator is not supported in the strategy tester. It will also not draw lines and arrows or sell and buy advice on any chart.
The indicator must be put on a M5 chart. A clean (empty) chart without any other indicators or Expert Advisors on it which could interfere with the dashboard. The dashboard will be loaded in an indicator window which you can then expand to cover the whole chart.


nice