Binary MACD
- 지표
- Bogdan Kupinsky
- 버전: 1.0
- 활성화: 5
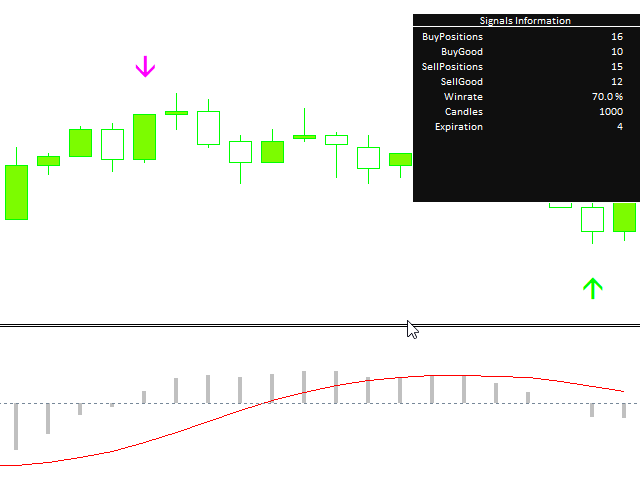
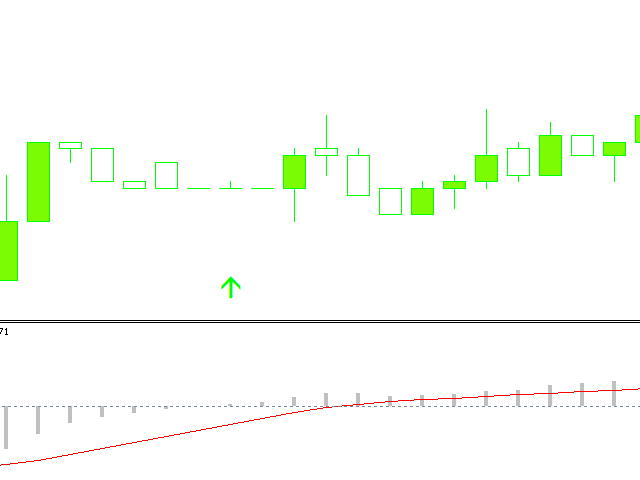
Индикатор, показывающий момент преодоления нулевой отметки индикатора MACD. Подходит для бинарной торговли, т.к. имеется возможность посчитать точность сигналов, в зависимости от времени экспирации.
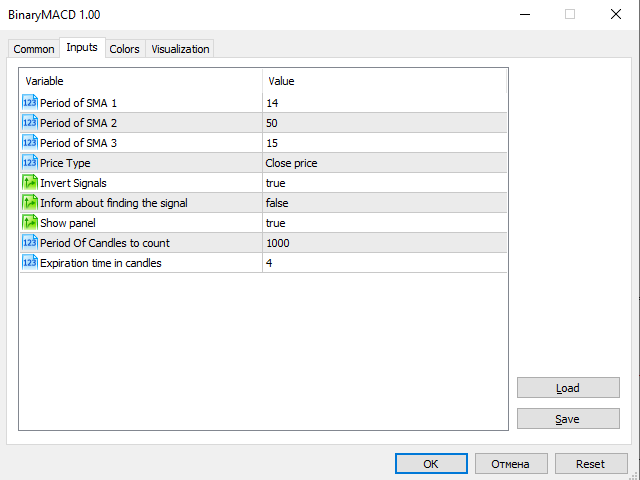
Входные параметры
- Period of SMA1 - Период 1 скользящей средней
- Period of SMA2 - Период 2 скользящей средней
- Period of SMA3 - Период 3 скользящей средней
- Price Type - Тип цены, используемый индикатором MACD
- Invert signals - Возможность давать инвертированные сигналы (для работы по тренду)
- Inform about finding the signal - подавать уведомление, при нахождении сигнала
- Show Panel - Показать/ скрыть панель
- Period of candles to count - Период (кол- во свечей), для просчета точности сигналов
- Expiration time in candles - Время экспирации в свечах
Особенности :
- Имеется возможность инвертировать сигналы индикатора, для торговли по тренду
- Есть панель для просчета точности сигналов, в зависимости от времени экспирации
- Стрелочный индикатор отлично подходит для работы бинарными опционами
- Есть возможность уведомлять о найденном сигнале