Monthly OHLC MA
- 지표
- Sattiraju Kottapalli
- 버전: 1.0
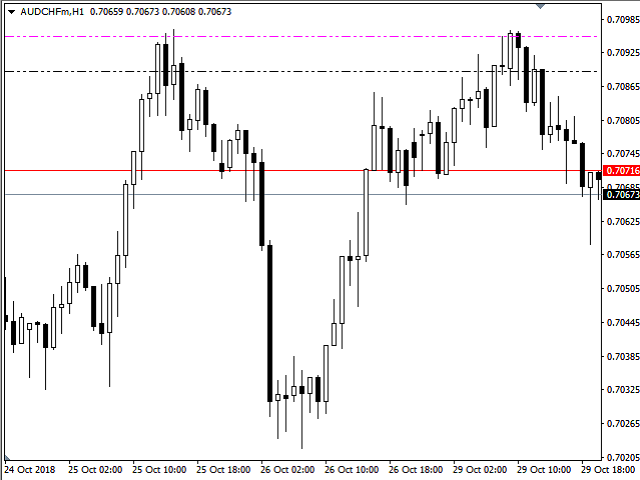
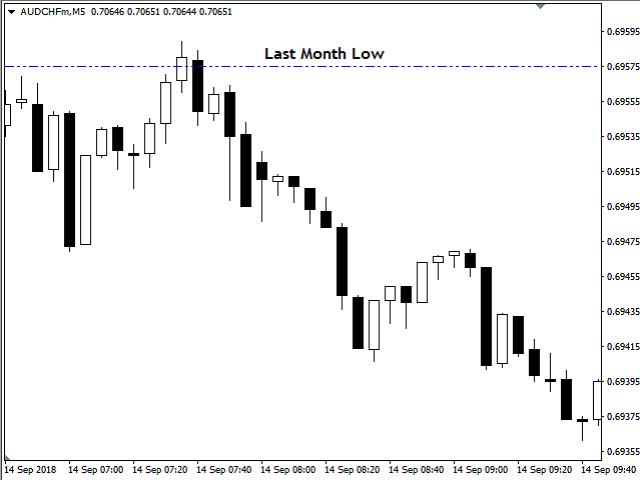
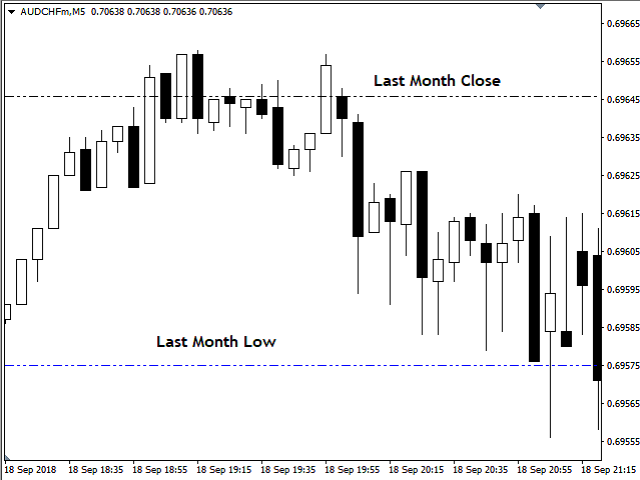
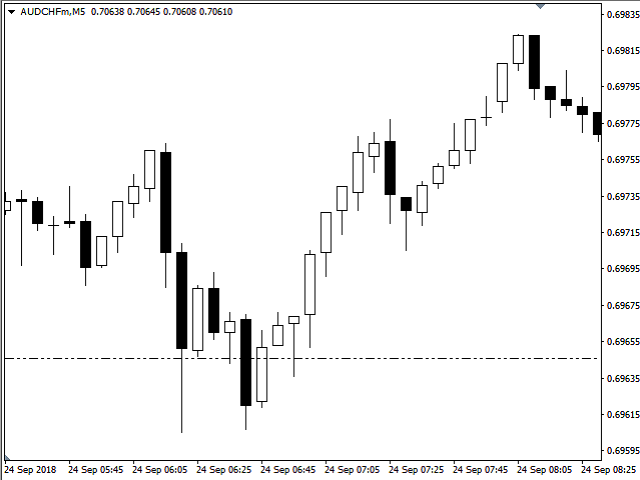
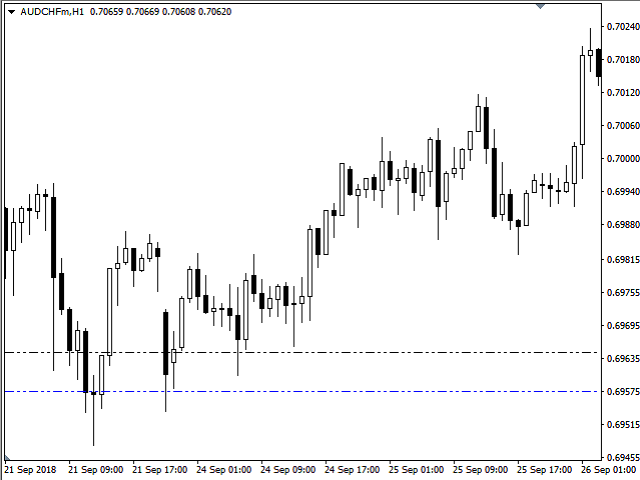
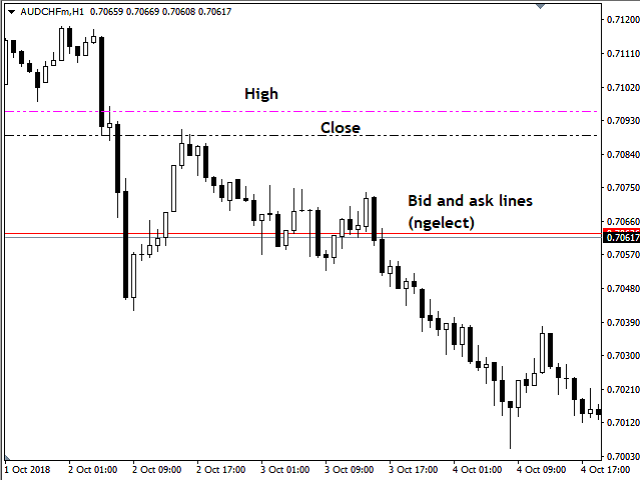
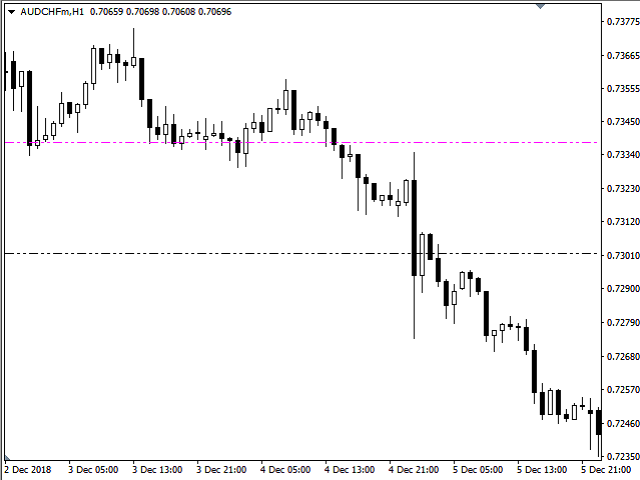
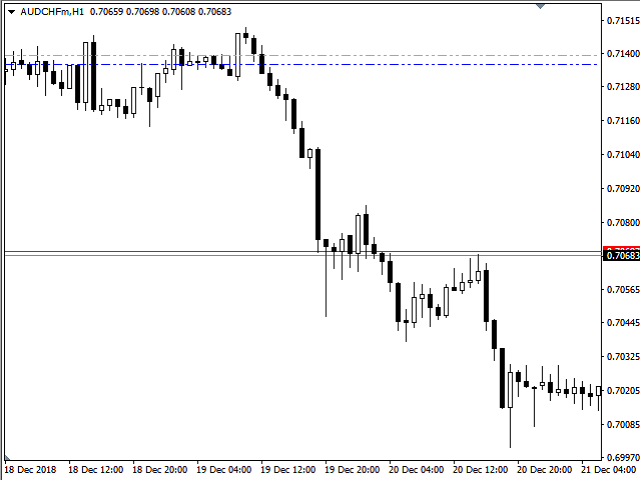
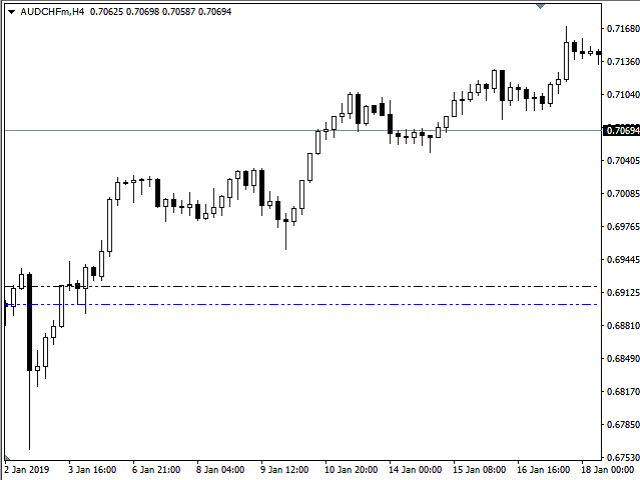
This indicator Plots Open, High, Low and Close levels of previous month, on current month's lower time frames.
These levels act as good support and resistance levels.
Most of the time price oscillates within the levels.
wait for price to reach these levels and act accordingly.
Pay special attention to confluence of levels.
According to my observation if Close (White) level is in confluence with any other levels, High probability of break out or bounce back.
Scroll back to previous months and observe price Action at these levels for better understanding.
Input Parameters
No input parameters
Open= Color Spring Green
High = Color Magenta
Low = Color Dark Khaki
Close = Color White
Enjoy the indicator.












사용자가 평가에 대한 코멘트를 남기지 않았습니다