Diamond Pattern
- 지표
- Ugur Oezcan
- 버전: 1.10
- 업데이트됨: 3 4월 2019
- 활성화: 5
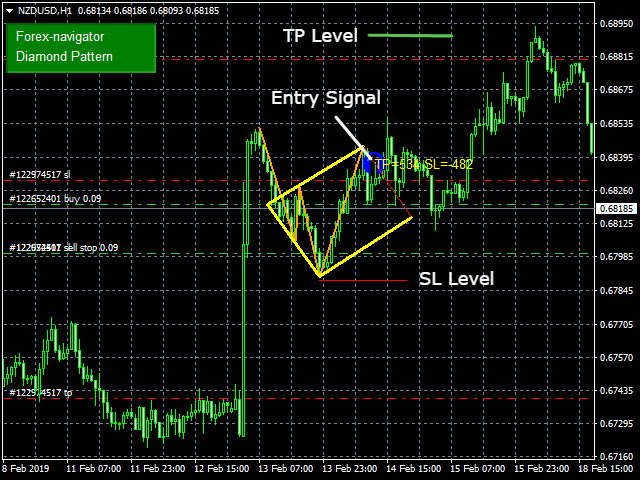
The diamond top and bottom are reversal patterns. It represents a rally to a new high with a drop to a support level followed by a rally to make a new high and a quick decline, breaking the support level to make a higher low. The bounce from the higher low is then followed by a rally, but making a lower high instead. Once this behavior is identified, prices then break the trend line connecting the first and second lows and start to decline further.
You can find MT5 version hier
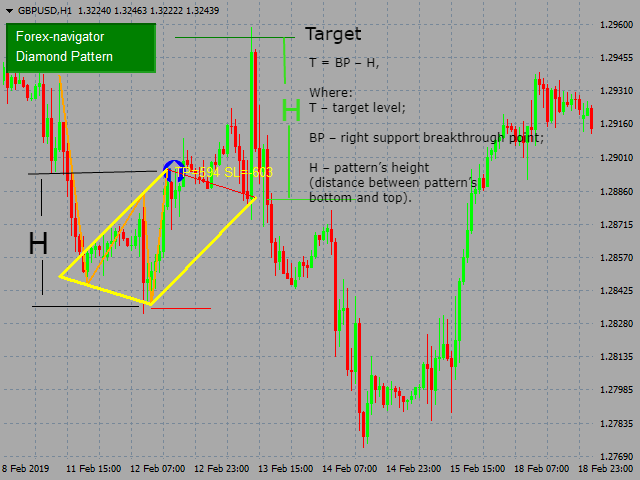
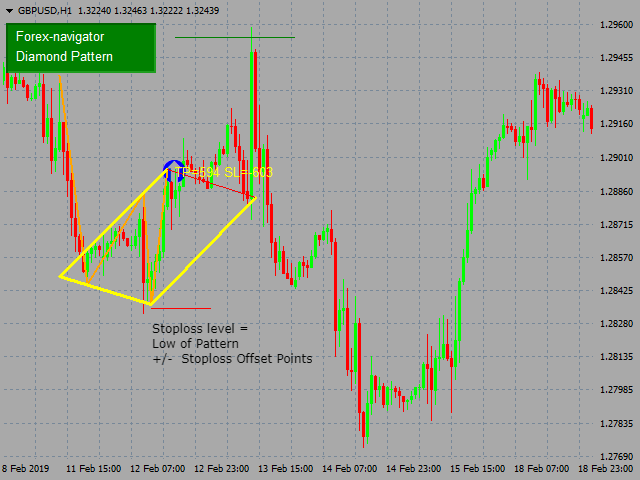
Indicator shows you target level and stop loss level. Stoploss level can be adjusted depending on your risk tolerance.
The following alert types are available:
- Popup alert,
- Email ( Settings in metatrader 4 stations necessary: instruction ),
- Notification to mql5 app ( Settings in mql5.com profile necessary: instruction ),
- sound,
- Comment at screen,
- log at expert tab
INPUT PARAMETERS
*** Pattern setup
Min Points - Min points between resistance / Support prices
Trend Move Min Bars - min trending bars before checking pattern
Trend Move Max Bars - max trending bars before checking pattern
Enable reversal signal - Enable reversal signal
Enable continuation signal - Enable continuation signal
*** Trade setup
Stoploss Offset Points - Stoploss offsett of from pattern high/low point
*** Visualisation
Panel Offset - Panel vertical position offset from above
Alert Type - choose alert type

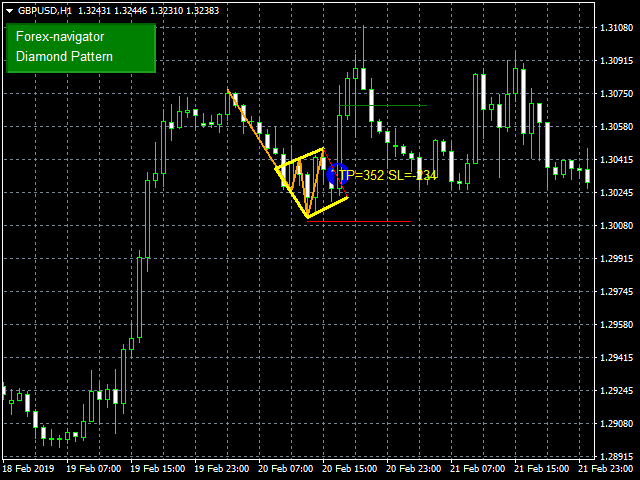
Nicely done. This indicator shows pattern, levels to trade and the best part is confirmation arrow showing direction.