NewsCatcher Free
- Experts
- Evgeniy Scherbina
- 버전: 3.1
The advisor NewsCatcher Free opens trades when the price makes a reversal move from support and resistance levels. Market entries should be confirmed by the Relative Strength Index (RSI). The RSI is implemented as a tachometer.
It is recommended to use this advisor in a highly volatile market after a political event or a release of major economic data.
You can use this advisor in the semi-automated mode (the RSI performs an information role) or in the fully automated mode (the RSI decides when to enter the market). The timeframe for the semi-automated mode should not be bigger than 30 minutes, for the fully automated mode - H1 (1 hour).
It turns out that the semi-automated mode, when you locate the major support and resistance levels visually, yields a better result.
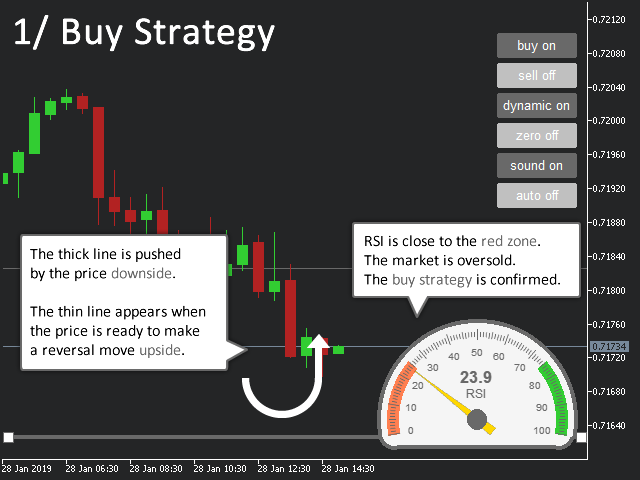
You can move the thick line (the level chased by the price). The price must touch the thick line at least once for a trade to be possible. After that, a thin line appears. When the price crosses the thin line a trade is opened. Keep in mind that the advisor opens a buy only in a bullish bar, and a sell in a bearish bar.
You can change the timeframe to see how the current level looks like in other timeframes. The advisor keeps the current level. To drop the current level, switch off the buy or sell button.
There are 2 strategies:
1) The Buy Strategy.
The price moves downside and reaches the oversold zone. As you may know, it is better to buy at the lowest point. But the price may go even lower. How do you know when the price should make a reversal move? This is when the advisor NewsCatcher Free comes in handy. If the price continues to fall, the advisor pushes the thick line (support level) lower. The advisor waits for the price to make a definitive reversal move upside and cross the thin line. Only then it opens a buy.
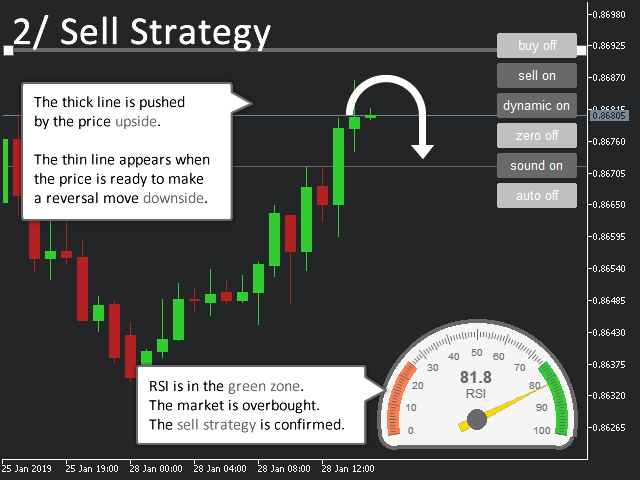
2) The Sell Strategy.
The price moves upside and reaches the overbought zone. As you may know, it is better to sell at the highest point. As in the buy strategy, the advisor pushes the thick line (resistance level) higher until the price makes a definitive reversal move downside. When the price crosses the thin line, the advisor opens a sell.
The Advisor Properties:
Color preset - you can choose among three available color schemes.
Distance - a distance from the current level for a trade to be opened.
Magic - your magic number.
Volume - use either a fixed value (ex: 0.1) or a percentage of equity (ex: 0.03%).
Stop loss - use points not pips.
Take profit - use points not pips.
Trail - use points not pips.
RSI >> Period of calculation
RSI >> Prices series
RSI >> Bottom level
RSI >> Top level
Comments to the buttons in the chart:
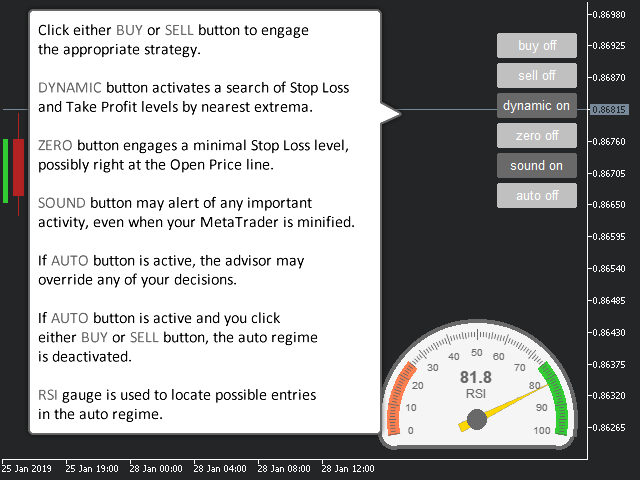
buy - activates the buy strategy. The price should be in the oversold zone, the RSI tachometer in the red zone.
sell - activates the sell strategy. The price should be in the overbought zone, the RSI tachometer in the green zone.
dynamic - activates a search of stop loss and take profit levels by the nearest bar extrema. These levels may not be closer then the values of stoploss and takeprofit currently set.
zero - a stoploss is going to be set at the open price line as soon as the trade gets profitable.
sound - activates sounds of a new thin line (a trade is possible), a new trade, a trail move, and a closed trade.
auto - activates the auto mode. In this mode, the advisor buys when the RSI is in the red zone, and sells in the green zone. The auto mode switches on and off the other buttons as required. If you click the buy or sell button in the auto mode, the auto mode deactivates.
































EXCELENTE !!! siempre me gustaron los robots de Noticias y este es de los mejores , MUY RECOMENDABLE , felicitaciones