Time Scale for MT5
- 지표
- Taras Slobodyanik
- 버전: 1.80
- 업데이트됨: 22 8월 2023
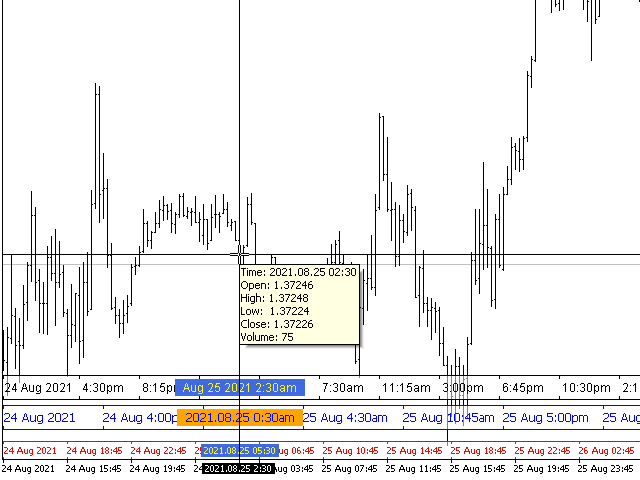
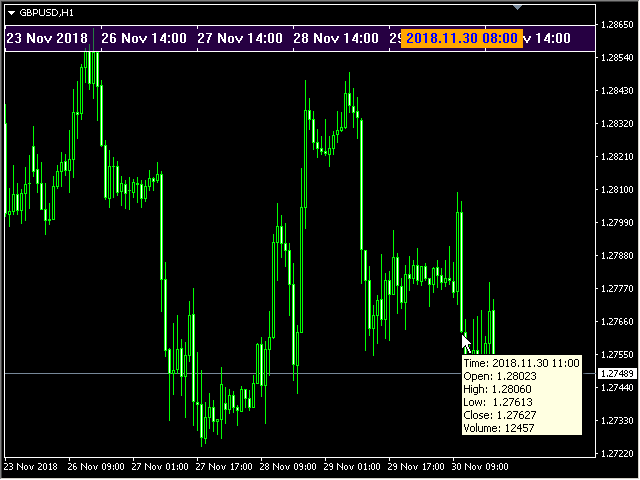
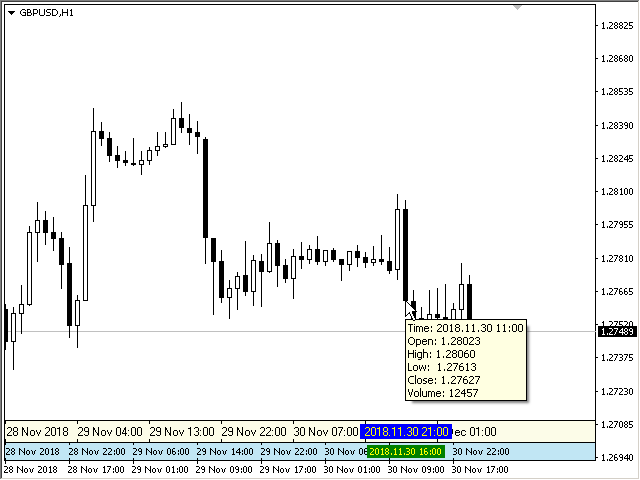
The indicator draws the time scale on the chart. You can specify the time offset, adjust the size and font to display on the chart (it is displaying your local time on your chart instead of MT time). You can also select the desired format for displaying the date and time.
You may be interested in my other product, which contains a more advanced version of the Time Scale.
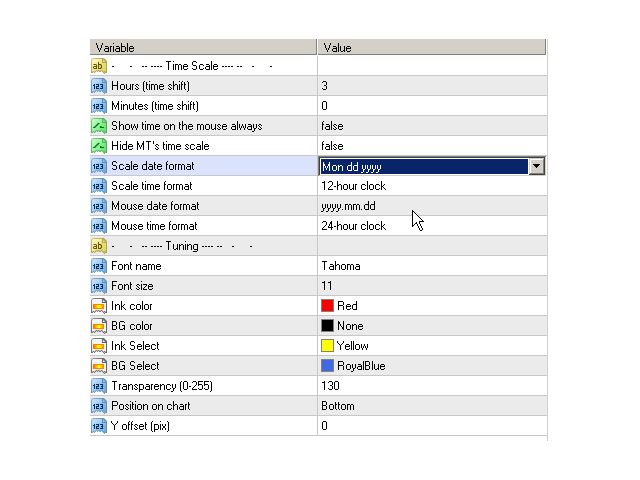
Parameters
- Hours (time shift) — time shift (hours);
- Minutes (time shift) — time shift (minutes);
- Show time on mouse — show time under the pointer;
- Precise time scale — calculate the time between bars;
- Hide MT's time scale — hide the standard scale;
- Scale date format — format for the date on the scale;
- Scale time format — format for time on the scale;
- Mouse date format — format for the date under the mouse pointer;
- Mouse time format — format for the time under the mouse pointer;
- Font name — choose a font;
- Font size — font size;
- Ink color — color of the ink of scale;
- BG color — color of the background of scale;
- Ink Select — font color for the selected date;
- BG Select — background color for the selected date;
- Transparency (0-255) — transparency of the background of the scale;
- Position on chart — position on the chart;
- Y offset (pix) — scale shift on the chart vertically.


Muito bom , ajudou muito com o horário no Brasil.