• 미리보기
  • 리뷰 (1)
  • 코멘트
  • 새 소식

Analytic System

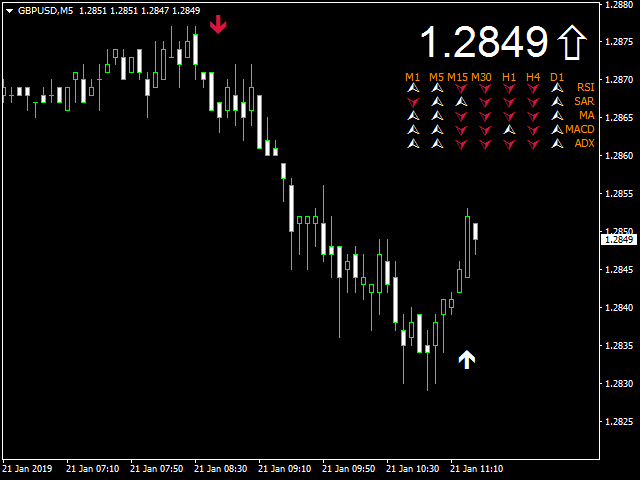
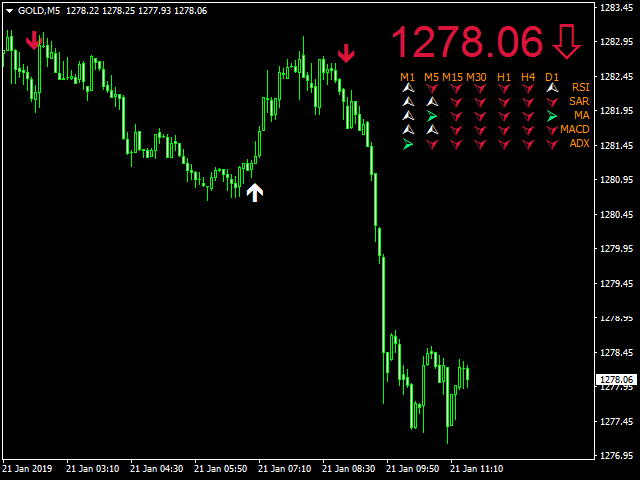
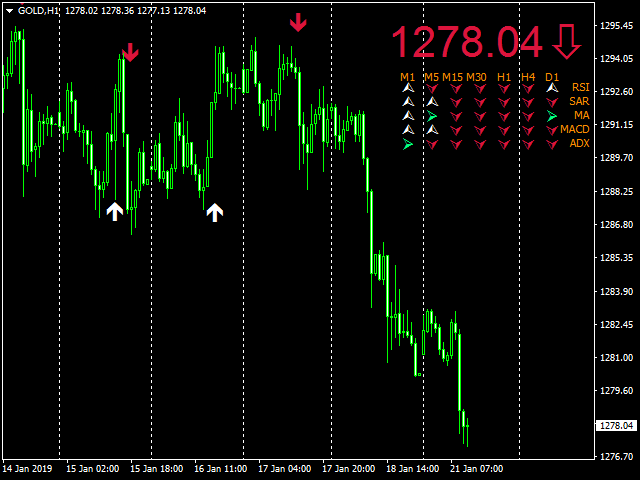
Индикатор Analytic System - это полноценная торговая система. Он состоит из 2 частей:

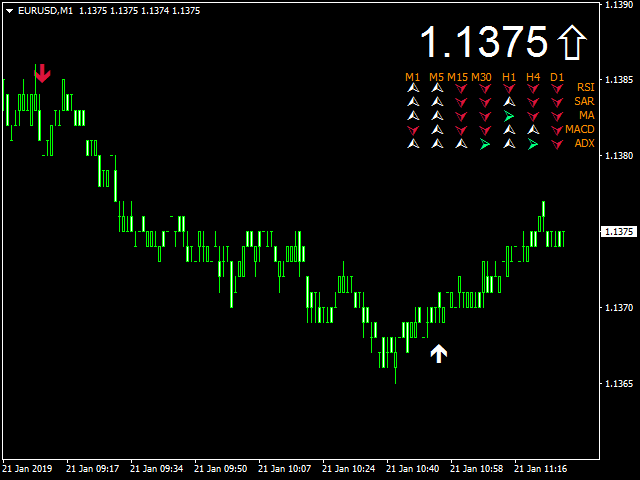
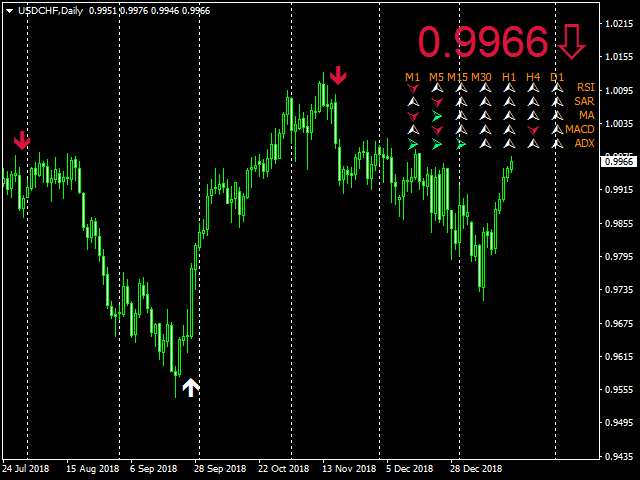
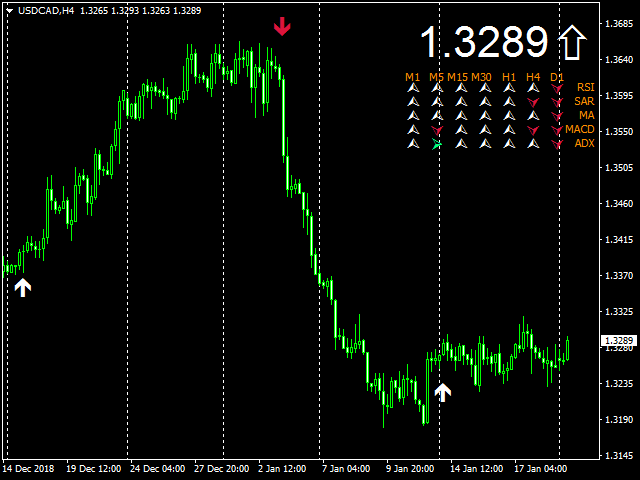
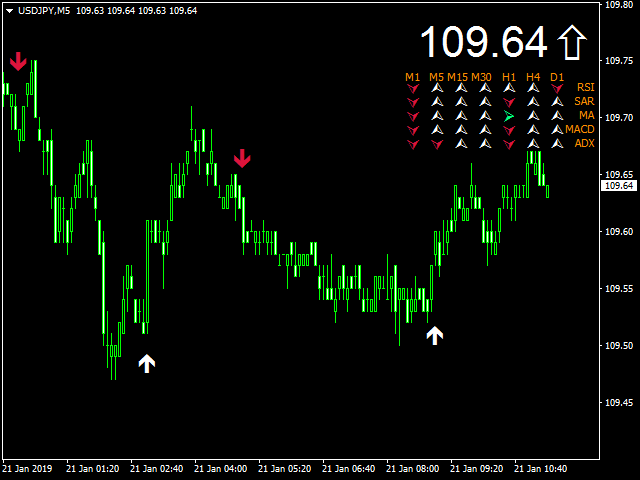
Первая - это стрелочки, показывающие наиболее оптимальные точки открытия и закрытия сделок. Стрелка вверх - сигнал на покупку,стрелка вниз - на продажу. Индикатор использует сложные аналитические алгоритмы, при помощи которых система определяет моменты входов и выходов.

Вторая - это информационная панель в правом верхнем углу. Крупным шрифтом обозначена цена, справа от неё показано текущее направление тренда (в виде стрелочки). Далее показаны данные с множества технических индикаторов (RSI, SAR, MA, MACD,ADX) на семи периодах данной валютной пары (M1, M5, M15, M30, H1, H4. D1). Этот блок дает информацию о ситуации на валютной паре на всех периодах на основании нескольких индикаторов.

Индикатор свои значения не перерисовывает.


Параметры

  • Strength - период индикатора
  • Alerts - использовать ли звуковой сигнал при появлении сигнала
  • Show_info - показывать/не показывать информацию
  • EmailAlerts - отправлять ли сообщение на электронную почту при появлении сигнала
  • MobileAlerts - отправлять ли сообщение на мобильный терминал при появлении сигнала
추천 제품
VR Cub
Vladimir Pastushak
VR Cub 은 고품질 진입점을 얻는 지표입니다. 이 지표는 수학적 계산을 용이하게 하고 포지션 진입점 검색을 단순화하기 위해 개발되었습니다. 지표가 작성된 거래 전략은 수년 동안 그 효율성을 입증해 왔습니다. 거래 전략의 단순성은 초보 거래자라도 성공적으로 거래할 수 있다는 큰 장점입니다. VR Cub은 포지션 개시 지점과 이익 실현 및 손절매 목표 수준을 계산하여 효율성과 사용 편의성을 크게 높입니다. 간단한 거래 규칙을 이해하려면 아래 전략을 사용한 거래 스크린샷을 살펴보세요. 설정, 세트 파일, 데모 버전, 지침, 문제 해결 등은 다음에서 얻을 수 있습니다. [블로그] 다음에서 리뷰를 읽거나 작성할 수 있습니다. [링크] 버전 [MetaTrader 5] 진입점 계산 규칙 포지션 개설 진입점을 계산하려면 VR Cub 도구를 마지막 최고점에서 마지막 최저점까지 늘려야 합니다. 첫 번째 지점이 두 번째 지점보다 빠른 경우, 거래자는 막대가 중간선 위에서 마감될 때까지 기다립니다
Supply and Demand zones
Makarii Gubaydullin
Supply / demand zones: observable areas where price has approached many times in the past. My   #1 Utility:  65+ features, including this indicator  |   Contact me  for any questions  |  MT5 version The indicator shows where the price could potentially be reversed again. Usually, the more times the price has been rejected from the level, the more significant it is. In the input settings   you can adjust: Enable or disbale Weak zones; Show or hide zone description; Font size; Set the basic color
Skalpex
Andrey Kozak
Skalpex is a system indicator for wave diagnostic analysis of the early phases of a market condition. The indicator lags exactly 1 bar. It shows the exact price reversals, does not redraw its values, but is 1 bar late. This is due to the fact that the last (zero bar) has not yet been formed before closing, which means that no one ever knows where it will go exactly and where it will close. We can assume. In order not to try to play fortune-telling, the Skalpex indicator is late by one candle an
Insider Scalper Binary This tool is designed to trade binary options. for short temporary spends. to make a deal is worth the moment of receiving the signal and only 1 candle if it is m1 then only for a minute and so in accordance with the timeframe. for better results, you need to select well-volatile charts.... recommended currency pairs eur | usd, usd | jpy .... the indicator is already configured, you just have to add it to the chart and trade .... The indicator signals the next candle.
Indicador Taurus All4
Fabio Oliveira Magalhaes
Taurus All4 Taurus All4 is a high-performance indicator, it will tell you the strength of the trend, and you will be able to observe the strength of the candle. Our indicator has more than 4 trend confirmations. It is very simple and easy to use. Confirmation Modes Candle Trend Confirmations: When the candle switches to light green the trend is high. When the candle switches to light red the trend is reverting down. When the candle changes to dark red the trend is low. Trendline Trend Confirm
Nice Trade Point
Muhammed Emin Ugur
This    Nice Trade Point     indicator is designed for signal trading. This indicator generates trend signals. It uses many algorithms and indicators to generate this signal. It tries to generate a signal from the points with the highest trend potential. This indicator is a complete trading product. This indicator does not need any additional indicators. The indicator certainly does not repaint. The point at which the signal is given does not change.     Features and Suggestions Time Frame
PABT Pattern Indicator - it's classical system one of the signal patterns. Indicator logic - the Hi & Lo of the bar is fully within the range of the preceding bar, look to trade them as pullback in trend. In the way if indicator found PABT pattern it's drawing two lines and arrow what showing trend way.  - First line - it's entry point and drawing at: 1. On the high of signal bar or on middle of the signal bar (depending from indicator mode) for buy; 2. On the low of signal bar or on middle of t
Smooth price for Monarch MT4
Konstantin Gruzdev
3.67 (3)
The Smooth Price technical indicator is used for plotting a smoothed line as close to the price of the financial instrument as possible, and serves to eliminate its noise components. The indicator is part of the Monarch trading system, but here it is presented as an independent technical analysis tool. The indicator is based on the cluster digital filter , which, unlike the ClusterSMA , is applied directly to the price time series. Smooth Price does not redraw (except the very last, zero bar) an
Fourteen plus nine TD Sequential
MOHAMMED IMAD HUSSEIN BASSEE
Fourteen plus nine What is it for? Applying Tom DeMark’s TD Sequential serves the purpose of identifying a price point where an uptrend or a downtrend exhausts itself and reverses. . What are the main components of TD Sequential? TD Sequential has two parts – TD Setup and TD Countdown. The first phase of TD Sequential starts with a TD Setup and is completed with a 9 count. When the 9 count is completed, it is at that point, a price pause, price pullback, or reversal is likely. It is also at tha
Infinity Trend Pro
Yaroslav Varankin
1 (1)
This is a trend indicator without redrawing Developed instead of the binary options strategy (by the color of the Martingale candlestick) Also works well in forex trading When to open trades (binary options) A signal will appear in the place with a candle signaling the current candle It is recommended to open a deal for one candle of the current timeframe M1 and M5 When a blue dot appears, open a deal up When a red dot appears, open a trade down. How to open trades on Forex. When a signal is rec
Trend Signal System   indicator is designed for trend and signal trading. This indicator generates trend signals.  It uses many algorithms and indicators to generate this signal. It tries to generate a signal from the points with the highest trend potential. This indicator is a complete trading product. This indicator does not need any additional indicators.  You can only trade with this indicator. The generated signals are displayed on the graphical screen.  Thanks to the alert features you can
MasterArrow
Pavel Krysanov
5 (1)
Correct market entries and exits are essential for any Forex trader. MasterArrow indicator addresses this issue. It has no redundant elements and draws only buy/sell arrows. The up arrow is a BUY signal, while the down arrow is a SELL one. The indicator is simple to configure. Change the Strength parameter to configure the signals frequency. The product is based on standard indicators (MA, RSI, ATR, etc.). But it also features the custom algorithm allowing to combine them into a single tool and
The Extreme point indicator helps in determining the probable price reversal points on the chart. The indicator facilitates the search for points to enter the market with greater accuracy. The indicator displays certain impulses, after which there is a high probability of the price continuing its movement in the same direction. The indicator can be used in conjunction with other indicators for a more accurate detection of the position entry points. The indicator can also be used independently. F
Market Follower
Alexey Surkov
5 (1)
The Market Follower indicator displays two types of potential entry points on the chart (by trend and absolute reversal points). The entry point by the trend is displayed by a circle. The indicator qualifies the presence of a trend at a certain interval by a certain algorithm. Then it displays a potential entry point after a rollback (correction). For the successful use of these entry points, it is recommended to use at least M30 timeframe with a confirmation on smaller timeframes. The Absolute
Alpha Trend
Evgeny Belyaev
3.33 (3)
Alpha Trend is a trend indicator for the MetaTrader 4 platform; it has been developed by a group of professional traders. The Alpha Trend indicator finds the most probable tendency reversal points, which allows making trades at the very beginning of a trend. This indicator features notifications, which are generated whenever a new signal appears (alert, email, push-notification). This allows you to open a position in a timely manner. Alpha Trend does not redraw, which makes it possible to evalua
Reverse Spot
Stefano Cocconi
Check My Product Contact me to discover all my services  Reverse Spot is an indicator that can help you find and identify possible price reverse zones.   This indicator can be used both as a trend continuation signal after a small period of consolidation or retracement and as a trend change signal. Reverse spot is a very easy to use indicator and thanks to the signals it sends with the arrows it is easy for the trader to identify moments in which to evaluate his own operations. Reverse Spot
Trend with Momentum
Waseem Ejaz
5 (1)
FIRST 10 COPIES AT 30 USD, NEXT PRICE WOULD BE 50 USD HAWA MOMENTUM & TREND PRO (MT4) Advanced trading indicator with proper pre-defined entry and exit levels with almost 80% win rate.  Its smart and advanced algorithm detects trend and trend strength using momentum for maximum profits and send signals after filtering out market noise. SETTINGS: Please make sure all inputs are NOT "false" in indicator properties otherwise it will not display identified trades. Directory Location: Download fil
This unique multi-currency strategy simultaneously determines the end of the trend, entry points and the expected take profit levels for each trade. The indicator can determine entry points on any trading period from M1 to D1. For the convenience of users, the indicator renders the entry point (in the form of an arrow), recommended take profit levels (Fast Take Profit, Middle Take Profit, Main Take Profit, Global Take Profit) and the Stop Loss level. The detailed guide on how to use the indicato
SRP Pro
Farhad Kia
5 (1)
Strong Retracement Points Pro edition! SRP (Strong Retracement/Reversal Points) is a powerful and unique support and resistance indicator. It displays the closest important levels which we expect the price retracement/reversal! If all level are broken from one side, it recalculates and draws new support and resistance levels, so the levels might be valid for several days depending on the market! If you are still hesitating to start using this wonderful tool, you can check this link to see how ef
Introducing the "Extreme Exhaustion Levels": A powerful tool for traders looking to identify market exhaustion and potential trend reversals. The Exhaustion Indicator is an advanced technical analysis tool that helps traders identify when markets are overbought or oversold, potentially indicating an imminent reversal in the trend. With a unique combination of price action, moving averages, and Bollinger Bands, the Exhaustion Indicator provides traders with a comprehensive view of market condit
Big Trend Signal   indicator is designed for trend and signal trading. This indicator generates trend signals.  It uses many algorithms and indicators to generate this signal. It tries to generate a signal from the points with the highest trend potential. This indicator is a complete trading product. This indicator does not need any additional indicators.  You can only trade with this indicator. The generated signals are displayed on the graphical screen.  Thanks to the alert features you can ge
Master scalping M1
Nataliia Marchuk
Master Scalping M1 is an innovative indicator that uses an algorithm to quickly and accurately determine the trend.The indicator calculates the time of opening and closing positions, the indicator's algorithms allow you to find the ideal moments to enter a deal (buy or sell an asset), which increase the success of transactions for most traders. Benefits of the indicator: Easy to assemble, does not overload the chart with unnecessary information. Can be used as a filter for any strategy. Works on
The indicator displays a matrix of indicators across multiple timeframes with a sum total and optional alert. Custom indicators can also be added to the matrix, in a highly configurable way. The alert threshold can be set to say what percentage of indicators need to be in agreement for an alert to happen. The alerts can turned on/off via on chart tick boxes and can be set to notify to mobile or sent to email, in addition to pop-up. The product offers a great way to create an alert when multiple
Breakout Impulse indicator for MT4
Renaud Herve Francois Candel
Breakout Impulse IndicatorBreakout Impulse Indicator is a pattern recognition indicator for Forex, Stocks, Indices, Futures, Commodities and Cryptos. The Breakout Impulse is a multi-bar pattern. The purpose of the pattern is to identify a fast change in momentum. This type of change can announce the start of a big directional move. Inputs of the indicator are: Distance: distance in pixel relative to top or bottom of candle to display the arrow symbol MaxBars: number of bars back used to calcula
Trendiness Index
Libertas LLC
5 (3)
"The trend is your friend" is one of the best known sayings in investing, because capturing large trendy price movements can be extremely profitable. However, trading with the trend is often easier said than done, because many indicators are based on price reversals not trends. These aren't very effective at identifying trendy periods, or predicting whether trends will continue. We developed the Trendiness Index to help address this problem by indicating the strength and direction of price trend
Crazy Cloud MT4
Stefanus Nigel
I make this indicator to help you for setting effective stoploss and getting more signals from following trends. This indicator helps to tell the trends and sideway, when 2 lines stand above of blue cloud, it means uptrend. When 2 lines stand above red cloud, it means down trend, the other else, it means sideway market. For taking order, you have to wait the arrows. You also need to see the cloud position, if the cloud's res, you have to wait the yellow arrow for selling order. If the cloud's bl
DayTradeKing
Thomas Bradley Butler
This indicator is good for small time frames like 1 and 5 minutes and made for day trading. The indicator never repaints or recalculates. The indicator works is for trading swing points in day trading, following bulls or bears.  Its a simple to use, non cluttered indicator with a high success rate.  This indicator works well to capture ranges.  All indicators come with limitations and no indicator or system is always accurate. Use money management for long term trading success.   Place in backte
DivirgentMAX
Mikhail Bilan
Indicator without redrawing Divergent MAX The DivirgentMAX indicator is a modification based on the MACD. The tool detects divergence based on OsMA and sends signals to buy or sell (buy|sell), taking into account the type of discrepancies detected. Important!!!! In the DivirgentMAX indicator, the optimal entry points are drawn using arrows in the indicator's basement. Divergence is also displayed graphically. In this modification of the MACD, the lag problem characteristic of its predecessor i
Mast
Sergei Zakhariia
The MT4 trend arrow indicator is a powerful tool for technical analysis that will help traders determine the direction of the trend in financial markets. This indicator is based on the use of several mathematical algorithms and methods of price analysis, which allows you to give accurate and transparent signals to enter the market. The working timeframe is H1.  The description of the indicator includes up and down arrows that indicate the future direction of price movement. In addition, the i
Sneaky Busters 4
Mushfiq Faysal
5 (2)
Unveil Market Secrets with Sneaky Busters on MetaTrader 4! Delve deeper into the intricate world of trading with the Sneaky Busters indicator, specifically crafted to spotlight the sophisticated maneuvers of smart money and uncover hidden market trends. Comprehensive Features: 1. Smart Money Accumulation & Distribution Detection: Accurate Analysis: Identify key zones where smart money collects and disperses assets. These insights help you understand market sentiment and potential turning points.
이 제품의 구매자들이 또한 구매함
Gann Made Easy
Oleg Rodin
4.8 (116)
Gann Made Easy 는 mr.의 이론을 사용하여 최고의 거래 원칙을 기반으로 하는 전문적이고 사용하기 쉬운 Forex 거래 시스템입니다. W.D. 간. 이 표시기는 Stop Loss 및 Take Profit Levels를 포함하여 정확한 BUY 및 SELL 신호를 제공합니다. PUSH 알림을 사용하여 이동 중에도 거래할 수 있습니다. 구매 후 연락주세요! 내 거래 팁과 훌륭한 보너스 지표를 무료로 공유하겠습니다! 아마도 Gann 거래 방법에 대해 이미 여러 번 들었을 것입니다. 일반적으로 Gann의 이론은 초보자 거래자뿐만 아니라 이미 거래 경험이 있는 사람들에게도 매우 복잡한 것입니다. Gann의 거래 방식은 이론적으로 적용하기 쉽지 않기 때문입니다. 나는 그 지식을 연마하고 Forex 지표에 최고의 원칙을 적용하기 위해 몇 년을 보냈습니다. 표시기는 적용하기가 매우 쉽습니다. 차트에 첨부하고 간단한 거래 권장 사항을 따르기만 하면 됩니다. 지표는 지속적으로 시장 분석 작업
현재 20% 할인 ! 초보자 또는 전문가 트레이더를 위한 최고의 솔루션! 이 대시보드 소프트웨어는 28개의 통화 쌍에서 작동합니다. 2가지 주요 지표(Advanced Currency Strength 28 및 Advanced Currency Impulse)를 기반으로 합니다. 전체 Forex 시장에 대한 훌륭한 개요를 제공합니다. 고급 통화 강도 값, 통화 이동 속도 및 모든(9) 시간대의 28 Forex 쌍에 대한 신호를 보여줍니다. 추세 및/또는 스캘핑 기회를 정확히 파악하기 위해 차트의 단일 지표를 사용하여 전체 시장을 볼 수 있을 때 거래가 어떻게 개선될지 상상해 보십시오! 잠재적인 거래를 식별하고 확인하면서 강력한 통화와 약한 통화를 더욱 쉽게 식별할 수 있도록 이 지표에 기능을 내장했습니다. 이 표시기는 통화의 강세 또는 약세가 증가 또는 감소하는지 여부와 모든 시간대에서 수행되는 방식을 그래픽으로 보여줍니다. 추가된 새로운 기능은 현재 시장 조건 변화에 적응하는
Scalper Inside PRO
Alexey Minkov
4.76 (63)
!SPECIAL SALE! An exclusive indicator that utilizes an innovative algorithm to swiftly and accurately determine the market trend. The indicator automatically calculates opening, closing, and profit levels, providing detailed trading statistics. With these features, you can choose the most appropriate trading instrument for the current market conditions. Additionally, you can easily integrate your own arrow indicators into Scalper Inside Pro to quickly evaluate their statistics and profitability
Dynamic Forex28 Navigator
Bernhard Schweigert
5 (5)
Dynamic Forex28 Navigator - 차세대 외환 거래 도구. 현재 49% 할인. Dynamic Forex28 Navigator는 오랫동안 인기 있는 지표의 진화형으로, 세 가지의 힘을 하나로 결합했습니다. 고급 통화 Strength28 지표(695개 리뷰) + 고급 통화 IMPULSE with ALERT(520개 리뷰) + CS28 콤보 신호(보너스). 지표에 대한 자세한 정보 https://www.mql5.com/en/blogs/post/758844 차세대 Strength 지표는 무엇을 제공합니까?  원래 지표에서 좋아했던 모든 것이 새로운 기능과 더 높은 정확도로 강화되었습니다. 주요 기능: 독점적인 통화 Strength 공식.  모든 시간대에 걸쳐 부드럽고 정확한 강도선. 추세와 정확한 진입을 식별하는 데 이상적입니다. 역동적인 시장 피보나치 수준(시장 피보나치).  이 지표에만 있는 고유한 기능. 가격 차트가 아닌 통화 강도에 피보나치가 적용됩니다.
Scalper Vault
Oleg Rodin
5 (29)
Scalper Vault 는 성공적인 스캘핑에 필요한 모든 것을 제공하는 전문 스캘핑 시스템입니다. 이 표시기는 외환 및 바이너리 옵션 거래자가 사용할 수 있는 완전한 거래 시스템입니다. 권장 시간 프레임은 M5입니다. 시스템은 추세 방향으로 정확한 화살표 신호를 제공합니다. 또한 상단 및 하단 신호와 Gann 시장 수준을 제공합니다.  이 시스템은 사용하기가 매우 쉽습니다. 원하는 시장 지역의 화살표만 따라가면 됩니다. 엑시트는 가격이 적정 수준에 도달하거나 시장의 고점 또는 저점 신호가 나타날 때 수행됩니다.  표시기는 PUSH 알림을 포함한 모든 유형의 경고를 제공합니다. 인디케이터 구매 후 연락주세요. 내 개인 거래 권장 사항과 훌륭한 보너스 지표를 무료로 공유합니다! 나는 당신에게 행복하고 유익한 거래를 기원합니다!
Golden Trend Indicator
Noha Mohamed Fathy Younes Badr
4.9 (10)
Golden Trend indicator  is The best indicator for predicting trend movement this indicator never lags and never repaints and never back paints    and give  arrow buy and sell    before the candle appear  and it will help you and  will make your trading decisions clearer its work on all currencies and  gold and crypto and all time frame This unique  indicator uses very secret algorithms to catch the  trends, so you can trade using this indicator and see the trend clear on charts  manual guide and
Easy Breakout
Mohamed Hassan
4.73 (11)
After your purchase, feel free to contact me for more details on how to receive a bonus indicator called VFI, which pairs perfectly with Easy Breakout for enhanced confluence!   Easy Breakout is a powerful price action trading system built on one of the most popular and widely trusted strategies among traders: the Breakout strategy ! This indicator delivers crystal-clear Buy and Sell signals based on breakouts from key support and resistance zones. Unlike typical breakout indicators, it levera
Enigmera
Ivan Stefanov
5 (7)
ENIGMERA: 시장의 핵심 중요: MQL5.com의 데모는 Strategy Tester에서 실행되며 Enigmera의 기능을 완전히 반영하지 못할 수 있습니다. 설명, 스크린샷 및 비디오를 확인하여 자세한 내용을 확인하십시오. 질문이 있으면 언제든지 메시지를 보내주세요! 인디케이터의 코드는 완전히 다시 작성되었습니다. 버전 3.0은 새로운 기능을 추가하고 인디케이터가 처음 출시된 이후 누적된 버그를 수정했습니다. 소개 이 인디케이터 및 거래 시스템은 금융 시장에 대한 주목할 만한 접근 방식입니다. ENIGMERA는 프랙탈 주기를 사용하여 정확하게 지원 및 저항 수준을 계산합니다. 실제 축적 단계를 보여주고 방향과 목표를 제공합니다. 트렌드와 수정 모두에서 작동하는 시스템입니다. 작동 방식 인디케이터의 대부분의 기능은 차트 왼쪽에 있는 버튼을 통해 제어되며, 이를 통해 다양한 시장 상황에 빠르게 대응할 수 있습니다. 버튼 ON/OFF – 인디케이터 전체를 표시하거나 숨깁니다.
Linear Trend Predictor - 진입 지점과 방향성 지원선을 결합한 추세 지표입니다. 고가/저가 채널을 돌파하는 원칙에 따라 작동합니다. 지표 알고리즘은 시장 노이즈를 걸러내고 변동성과 시장 역학을 고려합니다. 표시기 기능  평활화 방법을 사용하여 시장 추세와 BUY 또는 SELL 주문을 시작하기 위한 진입 시점을 보여줍니다.  모든 기간의 차트를 분석하여 단기 및 장기 시장 움직임을 파악하는 데 적합합니다.  어떠한 시장과 시간대에도 적용할 수 있으며, 입력 매개변수를 통해 거래자는 자신에게 맞게 지표를 독립적으로 사용자 지정할 수 있습니다.  설정된 지표 신호는 사라지거나 다시 그려지지 않습니다. 이는 캔들 마감 시 결정됩니다. 현재 캔들에 적용하여 신호를 더 일찍 받는 것도 가능하지만, 신호가 바뀔 수 있습니다.  여러 유형의 알림이 화살표와 결합되어 있습니다.  이 지표는 독립적인 거래 시스템으로 사용할 수도 있고, 다른 거래 시스템에 추가하는 용도로도 사용
Algo Pumping MT4
Ihor Otkydach
5 (4)
PUMPING STATION – 당신만을 위한 올인원(All-in-One) 전략 PUMPING STATION은 당신의 외환 거래를 더욱 흥미롭고 효과적으로 바꿔줄 혁신적인 인디케이터입니다. 단순한 보조 도구가 아니라, 강력한 알고리즘을 갖춘 완전한 거래 시스템으로서 보다 안정적인 트레이딩을 시작할 수 있도록 도와줍니다. 이 제품을 구매하시면 다음의 혜택을   무료로   받으실 수 있습니다: 전용 설정 파일: 자동 설정으로 최대의 퍼포먼스를 제공합니다. 단계별 동영상 가이드: PUMPING STATION 전략으로 거래하는 법을 배워보세요. Pumping Utility: PUMPING STATION과 함께 사용하도록 설계된 반자동 거래 봇으로, 거래를 더욱 쉽고 편리하게 만들어줍니다. ※ 구매 후 바로 저에게 메시지를 보내주세요. 추가 자료에 대한 접근 권한을 제공해드립니다. PUMPING STATION은 어떻게 작동하나요? 트렌드 컨트롤: 시장의 추세 방향을 즉시 파악합니다. 추세는
FX Power MT4 NG
Daniel Stein
4.94 (18)
FX Power: 통화 강세 분석으로 더 스마트한 거래 결정을 개요 FX Power 는 어떤 시장 상황에서도 주요 통화와 금의 실제 강세를 이해하기 위한 필수 도구입니다. 강한 통화를 매수하고 약한 통화를 매도함으로써 FX Power 는 거래 결정을 단순화하고 높은 확률의 기회를 발견합니다. 트렌드를 따르거나 극단적인 델타 값을 사용해 반전을 예측하고자 한다면, 이 도구는 귀하의 거래 스타일에 완벽히 적응합니다. 단순히 거래하지 말고, FX Power 로 더 스마트하게 거래하세요. 1. FX Power가 거래자에게 매우 유용한 이유 통화와 금의 실시간 강세 분석 • FX Power 는 주요 통화와 금의 상대적 강세를 계산하고 표시하여 시장 역학에 대한 명확한 통찰력을 제공합니다. • 어떤 자산이 앞서고 있고 어떤 자산이 뒤처지는지 모니터링하여 보다 현명한 거래 결정을 내릴 수 있습니다. 포괄적인 멀티 타임프레임 뷰 • 단기, 중기 및 장기 타임프레임에서 통화와 금의 강세를
FX Volume
Daniel Stein
4.6 (35)
FX Volume: 브로커 시각에서 바라보는 진짜 시장 심리 간단 요약 트레이딩 접근 방식을 한층 더 향상시키고 싶으신가요? FX Volume 는 소매 트레이더와 브로커의 포지션을 실시간으로 파악할 수 있게 해 줍니다. 이는 COT 같은 지연된 보고서보다 훨씬 빠릅니다. 꾸준한 수익을 추구하는 분이든, 시장에서 더 깊은 우위를 원하시는 분이든, FX Volume 을 통해 대규모 불균형을 찾아내고, 돌파 여부를 확인하며 리스크 관리를 정교화할 수 있습니다. 지금 시작해 보세요! 실제 거래량 데이터가 의사결정을 어떻게 혁신할 수 있는지 직접 경험해 보시기 바랍니다. 1. 트레이더에게 FX Volume이 매우 유익한 이유 탁월한 정확도를 지닌 조기 경보 신호 • 다른 사람들보다 훨씬 앞서, 각 통화쌍을 매수·매도하는 트레이더 수를 거의 실시간으로 파악할 수 있습니다. • FX Volume 은 여러 리테일 브로커에서 추출한 실제 거래량 데이터를 종합해 명확하고 편리한 형태로 제공하는
Grabber System MT4
Ihor Otkydach
3 (2)
탁월한 기술적 지표인 Grabber를 소개합니다. 이 도구는 즉시 사용 가능한 “올인원(All-Inclusive)” 트레이딩 전략으로 작동합니다. 하나의 코드 안에 강력한 시장 기술 분석 도구, 매매 신호(화살표), 알림 기능, 푸시 알림이 통합되어 있습니다. 이 인디케이터를 구매하신 모든 분들께는 다음의 항목이   무료로   제공됩니다: Grabber 유틸리티: 오픈 포지션을 자동으로 관리하는 도구 단계별 영상 매뉴얼: 설치, 설정, 그리고 실제 거래 방법을 안내 맞춤형 세트 파일: 인디케이터를 빠르게 자동 설정하여 최고의 성과를 낼 수 있도록 도와줍니다 다른 전략은 이제 잊어버리세요! Grabber만이 여러분을 새로운 트레이딩의 정점으로 이끌어 줄 수 있습니다. Grabber 전략의 주요 특징: 거래 시간 프레임: M5부터 H4까지 거래 가능한 자산: 어떤 자산이든 사용 가능하지만, 제가 직접 테스트한 종목들을 추천드립니다 (GBPUSD, GBPCAD, GBPCHF, AUDCAD
GOLD Impulse with Alert
Bernhard Schweigert
4.6 (10)
이 지표는 Advanced Currency IMPULSE with ALERT  +   Currency Strength Exotics  의 2가지 제품의 슈퍼 조합입니다. 그것은 모든 시간 프레임에 대해 작동하며 8개의 주요 통화와 하나의 기호에 대한 강약의 충동을 그래픽으로 보여줍니다! 이 표시기는 금, 이국적인 쌍, 상품, 지수 또는 선물과 같은 기호에 대한 통화 강도 가속을 표시하는 데 특화되어 있습니다. 금, 은, 오일, DAX, US30, MXN, TRY, CNH 등의 진정한 통화 강도 가속(충동 또는 속도)을 표시하기 위해 9번째 줄에 모든 기호를 추가할 수 있습니다. 새로운 기본 알고리즘을 기반으로 구축되어 잠재적인 거래를 훨씬 더 쉽게 식별하고 확인할 수 있습니다. 이는 통화의 강세 또는 약세가 가속되는지 여부를 그래픽으로 표시하고 가속 속도를 측정하기 때문입니다. 자동차의 속도계처럼 생각하면 됩니다. 가속화할 때 Forex 시장에서 동일한 일이 분명히 더 빠르
Lux Trend
Mohamed Hassan
5 (3)
After purchase, please contact me to get your trading tips + more information for a great bonus!   Lux Trend is a professional strategy based on using Higher Highs and Lower Highs to identify and draw Trendline Breakouts! Lux Trend  utilizes two Moving Averages to confirm the overall trend direction before scanning the market for high-quality breakout opportunities, ensuring more accurate and reliable trade signals. This is a proven trading system used by real traders worldwide, demonstrating
Max Min Cycle
Vitalyi Belyh
Cyclical indicator for trading and predicting the direction of the market. Shows the cyclical behavior of the price in the form of an oscillator. Gives signals for opening deals when rebounding from the upper and lower boundaries of the oscillator. In the form of a histogram, it shows the smoothed strength of the trend. Will complement any trading strategy, from scalping to intraday. The indicator does not redraw. Suitable for use on all symbols/instruments. Suitable time frames for short-term t
Advanced Supply Demand
Bernhard Schweigert
4.91 (294)
현재 33% 할인! 초보자나 전문 트레이더를 위한 최고의 솔루션! 이 보조지표는 우리가 다수의 독창적 기능과 새로운 공식을 통합한 독특하고 고품질이며 저렴한 거래 도구입니다. 이 업데이트를 통해 이중 시간대를 표시할 수 있습니다. 더 높은 TF를 표시할 수 있을 뿐만 아니라 차트 TF와 더 높은 TF 모두를 표시할 수 있습니다: 중첩 영역 표시. 모든 Supply Demand 트레이더들이 좋아할 것입니다. :) 중요한 정보 공개 Advanced Supply Demand의 잠재력을 극대화하려면 다음을 방문하십시오. https://www.mql5.com/ko/blogs/post/720245   진입 또는 목표의 명확한 트리거 포인트를 정확히 찾아냄으로 해서 거래가 어떻게 개선될지 상상해 보십시오. 새로운 알고리즘을 기반으로 매수자와 매도자 간의 잠재적인 불균형을 훨씬 더 쉽게 분간할 수 있습니다. 왜냐하면 가장 강한 공급영역과 가장 강한 수요 영역과 과거에 어떻게 진행 되었는지를(이전
Order Blocks ICT Multi TF MT4
Diego Arribas Lopez
5 (2)
[ MT5 Version ]  [ Kill Zones ]  [ SMT Divergences ] How to trade using Order Blocks:  Click here User Interface Performance:  During testing in the strategy tester, the UI may experience lag. Rest assured, this issue is specific to the testing environment and does not affect the indicator's performance in live trading. Elevate your trading strategy with the  Order Blocks ICT Multi TF  indicator, a cutting-edge tool designed to enhance your trading decisions through advanced order block analys
Gold Venamax MT4
Sergei Linskii
2 (1)
Gold Venamax   - 이것은 최고의 주식 기술 지표입니다. 지표 알고리즘은 자산의 가격 변동을 분석하고 변동성과 잠재적 진입 영역을 반영합니다.   표시기 기능: 이것은 편안하고 수익성 있는 거래를 위한 매직과 두 개의 추세 화살표 블록을 갖춘 슈퍼 지표입니다. 블록 전환을 위한 빨간색 버튼이 차트에 표시됩니다. 매직은 표시기 설정에서 설정되므로 서로 다른 블록을 표시하는 두 개의 차트에 표시기를 설치할 수 있습니다. Gold Venamax는 서로 다른 화살표 버퍼(GV 및 SD)를 사용하여 두 개의 차트에 배치할 수 있습니다. 이렇게 하려면 설정에서 다른 Magic을 선택해야 합니다. 예를 들어 하나는 Magic = 999이고 다른 하나는 Magic = 666입니다. 다음으로 차트의 빨간색 버튼으로 화살표 버퍼를 선택할 수 있습니다. 지표 설정의 각 화살표 버퍼(GV 및 SD)에는 편안하고 수익성 있는 거래를 위한 별도의 화살표 필터가 있습니다(UseFiltrGV = t
Volume Break Oscillator는 가격 움직임을 오실레이터 형태로 볼륨 추세와 일치시키는 지표입니다. 저는 볼륨 분석을 제 전략에 통합하고 싶었지만 OBV, Money Flow Index, A/D, Volume Weighted Macd 및 기타 여러 지표와 같은 대부분의 볼륨 지표에 항상 실망했습니다. 그래서 저는 이 지표를 직접 작성했고, 얼마나 유용한지 만족스러워서 시장에 공개하기로 결정했습니다. 주요 기능: 가격이 볼륨 증가(브레이크)로 지원되는 방향으로 움직이는 단계를 강조합니다. 볼륨 증가가 멈추고 시장이 수축되는 단계를 강조합니다. 특히 시간 프레임(<=15분)이 있는 일중 거래에서 가격이나 볼륨이 움직이지 않아 시장이 향후 상승에 대비하는 단계를 강조합니다. 볼륨 증가로 지원되지 않는 다른 전문가 자문가의 거짓 신호를 걸러냅니다. 추세와 범위 단계를 시각화하는 것이 매우 쉽습니다. 입력 매개변수: 계산 설정: 계산 유형: FAST, NORMAL, S
파동 동기화 장치 - 파동 분석의 시각적 표시기. 촛대 움직임 시퀀스를 결합하고 방향성 파동 패턴을 생성하여 시장과 동기화된 움직임을 생성합니다. 각 웨이브의 시작은 신호 화살표로 시작하며, 알림도 있습니다. 이 표시기는 과거 기록에 있는 화살표를 다시 그리거나 이동하지 않습니다. 캔들 마감 시점에 신호 화살표가 나타납니다. 모든 거래 수단 및 시간대에 맞게 조정 가능합니다. 사용 및 구성이 쉽고, 선택한 매개변수와 함께 사용할 시간 프레임 선택 및 MA 라인 계산 방법의 2가지 입력 매개변수만 포함합니다. 권장 매개변수는 1~2주기만큼 변경될 수 있습니다. 거래 자산을 매수하기 위한 빨간색 화살표 방향입니다. 거래 자산을 판매할 때의 파란색 화살표 방향입니다. -----------------------------------------------------------------
PZ Order Block
PZ TRADING SLU
간단하면서도 효과적인 포지션 트레이딩 전략인 Order Blocks의 개인적인 구현. 가격 범위가 브레이크 아웃의 반대 방향으로 위반되지 않은 경우 거래자는 시장에 진입하거나 마지막 주문 블록 방향으로 거래를 찾아야 합니다. 명확성을 위해 열린 블록은 그려지지 않습니다. [ 설치 가이드 | 업데이트 가이드 | 문제 해결 | 자주하는 질문 | 모든 제품 ] 강세 오픈 블록은 신시장 저점 이후의 첫 번째 강세 막대입니다. 약세 오픈 블록은 신시장 고점 이후 첫 번째 약세 막대입니다. 오픈 블록이 깨졌을 때 시그널이 나타나 오더 블록이 됨 오더블록이 반대편으로 깨지면 반전블록이 된다 표시기는 모든 종류의 경고를 구현합니다. 다시 칠하거나 다시 칠하지 않습니다. 입력 매개변수 기간: 새로운 고가 또는 저가를 생성하는 데 필요한 막대의 양입니다. 값이 작을수록 더 많은 신호가 발생합니다. 최소 ATR 필터: ATR의 승수로 표시되는 주문 블록 막대의 최소 본체 크기입니다. 최대 ATR 필
Legacy of Gann
Pavel Zamoshnikov
4.83 (12)
The indicator very accurately determines the levels of the possible end of the trend and profit fixing. The method of determining levels is based on the ideas of W.D.Gann, using an algorithm developed by his follower Kirill Borovsky. Extremely high reliability of reaching levels (according to K. Borovsky  - 80-90%) Indispensable for any trading strategy – every trader needs to determine the exit point from the market! Precisely determines targets on any timeframes and any instruments (forex, met
IQ FX Gann Levels
INTRAQUOTES
5 (1)
CONTACT US  after purchase to get the Indicator Manual. Try Now—Limited Discount for the next 10 Buyers! Download the  Metatrader 5 Version Read the product description carefully before purchasing the product.  Due to regulatory restrictions, our service is unavailable in certain countries such as India, Pakistan, and Bangladesh. Disclaimer: • Our products are available only on mql5.com. • We never contact anyone or sell our products privately. • We do not provide any personal trading advice.
TPSpro RFI Levels
Roman Podpora
4.85 (27)
주요 플레이어의 반전 구역 / 피크 볼륨 / 활성 구역 =       TS TPS프로시스템 지침 RUS       /       지침       영어       /     Version MT5   이 지표를 구매한 모든 구매자는 또한 다음을 무료로 받습니다. RFI SIGNALS 서비스의 거래 신호에 6개월 동안 액세스할 수 있습니다. TPSproSYSTEM 알고리즘에 따른 즉시 사용 가능한 진입 포인트입니다. 정기적으로 업데이트되는 교육 자료 - 전략에 푹 빠져서 전문가 수준을 높여보세요. 주중 24/5 지원 및 비공개 트레이더 채팅 이용 - 시장 상황에 대한 소통, 지원 및 분석. 저자가 설정한 파일 - 별도의 노력 없이 최대 결과를 얻을 수 있도록 지표를 자동으로 설정합니다. 주요 기능: 판매자와 구매자의 활동 영역을 표시합니다! 이 지표는 매수 및 매도에 대한 모든 올바른 첫 번째 임펄스 레벨/존을 표시합니다. 진입점 검색이 시작되는 이러한 레벨/존이 활성화되면 레벨의 색
Gold Trend 4
Sergei Linskii
금 추세   - 좋은 주식 기술 지표입니다. 인디케이터 알고리즘은 자산의 가격 움직임을 분석하고 변동성과 잠재적 진입 구간을 반영합니다. 최고의 지표 신호: - 매도 = 빨간색 히스토그램 + 빨간색 숏 포인터 + 같은 방향의 노란색 신호 화살표. - 매수 = 파란색 히스토그램 + 파란색 롱 포인터 + 같은 방향의 아쿠아 신호 화살표. 인디케이터의 장점 1. 표시기는 높은 정확도로 신호를 생성합니다. 2. 확인된 화살표 신호는 추세가 바뀔 때만 다시 그릴 수 있습니다. 3. 모든 브로커의 메타트레이더 4 거래 플랫폼에서 거래할 수 있습니다. 4. 모든 자산(통화, 금속, 암호화폐, 주식, 지수 등)을 거래할 수 있습니다. 5. H1 차트주기(중기 트레이딩)에서 거래하는 것이 좋습니다. 6. 지표 설정에서 개별 매개 변수(TF, 색상 등)를 변경할 수 있으므로 각 트레이더가 지표를 쉽게 사용자 지정할 수 있습니다. 7. 이 보조지표는 독립적인 트레이딩 시스템뿐만 아니라 트레
Candle Probability Scalper
Martin Alejandro Bamonte
Candle Probability Scalper 사용 가이드 이 지표는 스캘핑을 쉽고 100% 직관적으로 만듭니다. Candle Probability Scalper 는 실시간 으로 현재 캔들에서 매수자와 매도자의 강도 비율을 한눈에 보여줍니다. 비율은 각 틱마다 업데이트되므로, 매 순간 매수자와 매도자 대부분이 무엇을 하고 있는지 알 수 있으며, 지연이 없습니다. 이는 각 세력의 강도를 판단하거나 확인하고, 가격의 움직임을 예측하는 데 큰 도움이 됩니다. 다음은 사용 방법에 대한 명확한 가이드입니다: 1. M1의 매수자와 매도자 비율을 보고 다른 시간대(M5, M15)와 확인하십시오: M1에서 매수자 비율이 60% 이상 이고 M5 및 M15의 매수자 비율이 M1과 일치하여 60% 이상인 경우, 좋은 매수 신호 입니다. M1에서 매도자 비율이 60% 이상 이고 M5 및 M15의 매도자 비율이 M1과 일치하여 60% 이상인 경우, 좋은 매도 신호 입니다. 이것은 추세가 일시적인 것이
Volume by Price MT4
Brian Collard
4.67 (12)
Volume Profile, Footprint and Market Profile TPO (Time Price Opportunity). Volume and TPO histogram bar and line charts. Volume Footprint charts. TPO letter and block marker collapsed and split structure charts. Static, dynamic and flexible range segmentation and compositing methods with relative and absolute visualizations. Session hours filtering and segment concatenation with Market Watch and custom user specifications. Graphical layering, positioning and styling options to suit the user's a
KT Asian Breakout Indicator
KEENBASE SOFTWARE SOLUTIONS
KT Asian Breakout 지표는 아시아 세션의 중요한 부분을 분석하여 가격 돌파 방향에 따라 매수 및 매도 신호를 생성합니다. 가격이 세션 최고점을 돌파하면 매수 신호가 발생하며, 가격이 세션 최저점을 돌파하면 매도 신호가 발생합니다. 유의 사항 세션 박스의 높이가 너무 넓다면, 대부분의 가격 움직임이 이미 세션 내에서 발생했기 때문에 새로운 거래를 피하는 것이 좋습니다. 돌파 캔들이 너무 크면, 가격이 신호 방향으로 계속 진행하기 전에 일시적인 되돌림이 발생할 가능성이 높습니다. 기능 매수/매도 신호에 스톱로스 및 목표 이익 수준이 포함됩니다. KT Asian Breakout 지표는 첫 번째, 두 번째 또는 세 번째 목표 이익을 기준으로 성과를 지속적으로 확인합니다. 승/패 신호 수, 성공률, 신호당 평균 핍스와 같은 세 가지 주요 성과 지표를 표시합니다. 돌파 캔들이 너무 크면 차트에 경고 메시지가 표시됩니다. 추천 설정 시간 프레임: 15분. 통화쌍: 모든 JPY
Chart Patterns All in One
Davit Beridze
4.68 (19)
"Chart Patterns All in One"을 데모 모드에서 사용해보고 보너스를 받아보세요. 데모 모드에서 사용해본 후 메시지를 보내주시면 보너스를 드립니다. 구매 후 댓글을 남기시면 고품질의 인디케이터 8개를 보너스로 받으실 수 있습니다. Chart Patterns All-in-One 지표는 트레이더가 기술 분석에서 흔히 사용되는 다양한 차트 패턴을 시각화하는 데 도움을 줍니다. 이 지표는 잠재적인 시장 움직임을 식별하는 데 도움이 되지만, 수익성을 보장하지는 않습니다. 구매 전에 데모 모드에서 지표를 테스트하는 것이 좋습니다. 현재 할인 : "Chart Patterns All in One" 지표 50% 할인 중. 포함된 패턴 : 1-2-3 패턴 : 세 가지 주요 지점(고점 또는 저점)을 사용하여 시장 반전을 감지합니다. 매수 : 연속된 두 저점 이후, 이전 고점보다 낮은 고점이 발생할 때. 매도 : 연속된 두 고점 이후, 이전 저점보다 높은 저점이 발생할 때. 시각화 :
제작자의 제품 더 보기
ExactArrows
Pavel Krysanov
3.71 (7)
The main aim of this indicator lies in determining entry and exit points, that is why the ExactArrow indicator does not draw nothing but arrows which show entry and exit points. In spite of apparent simplicity of the indicator, it has complicated analytic algorithms which determine entry and exit points. The indicator generates exact and timely entry and exit signals which appear on the current candle. The indicator generates an average of 1-2 candles before its analogues do. The indicator is ve
MasterArrow
Pavel Krysanov
5 (1)
Correct market entries and exits are essential for any Forex trader. MasterArrow indicator addresses this issue. It has no redundant elements and draws only buy/sell arrows. The up arrow is a BUY signal, while the down arrow is a SELL one. The indicator is simple to configure. Change the Strength parameter to configure the signals frequency. The product is based on standard indicators (MA, RSI, ATR, etc.). But it also features the custom algorithm allowing to combine them into a single tool and
RightTrend
Pavel Krysanov
5 (3)
The RightTrend indicator shows the direction of trend and reversal points (market entry and exit points). It is very easy to use: open BUY deal when the up arrow appears and open SELL deal when the down arrow appears. The indicator generates accurate and timely signals for entering and exiting the market, which appear on the current candle while it is forming. In spite of apparent simplicity of the indicator, it has complex analytic algorithms which determine trend reversal points. Inputs stren
CorrectTrend
Pavel Krysanov
This indicator is designed to help traders in determining the market entry and exit points. It is very easy to use: open s BUY deal when the up arrow appears and open s SELL deal when the down arrow appears. The indicator is based on the basic indicators (MA, MACD, RSI) as well as original algorithms. The indicator does not redraw, arrows appear when a new candle opens. Input Parameters: strength - indicator period EnableAlerts - enable/disable alerts EmailAlert - send notifications to email wh
TraderHelp
Pavel Krysanov
5 (3)
The main goal of the indicator is to determine the most optimal points of entry and exit from a trade. The indicator consists of three parts. The first one is arrows displaying the most efficient market entry/exit points. The up arrow is a buy signal, the down arrow is a sell one. The indicator contains an analytical analysis algorithm that includes a set of standard indicator readings, as well as a custom algorithm. The second part is data in the upper right corner (works on М1-D1 timeframes) o
Analytic Trade
Pavel Krysanov
The Analytic Trade indicator is a complete trading system. It consists of 4 parts: The first part is the arrows showing the most optimal points for opening and closing orders. The up arrow is a buy signal, the down arrow is a sell one. The second part is the information panel in the upper right corner. The current price is shown in a larger font, above it are: the daily High, distance from the current price to the daily High, and the difference between the High and Low (in points). Below it are:
Smart Help
Pavel Krysanov
5 (2)
The 'Smart Help' indicator is an excellent assistant for beginners and experienced traders. It consists of 3 parts: The first part provides entry and exit signals in the form of arrows. The up arrow is a signal of an uptrend, the down arrow indicates a downward trend. The second part shows the direction and strength of the current trend. The third part provides information on the currency pair state. The current price is indicated at the top. Below it are: the daily Low and High, the point dista
DriverFx
Pavel Krysanov
Данный индикатор рисует на графике стрелки, которые являются сигнала на вход и выход из сделки, а также в качестве фильтра индикатор окрашивает каждую свечу в синий и красный цвет. Дополнительно ко всему в левом верхнем окне показывается сила тренда и его направление по основным парам. У индикатора новая логика, которая существенно отличает его от множества аналогов. Он дает ранние сигналы на вход и на выход, свои значения не перерисовывает — то есть, если индикатор дал сигнал на вход в сделку,
Trading Strategy
Pavel Krysanov
Индикатор Trading Strategy призван помочь трейдерам в поиске оптимальных входов в сделку и выходов из неё. В его основе лежат показания технических индикаторов (MA, RSI, ATR и др.), а также авторский алгоритм, связывающий их сигналы в единое целое. Индикатор даёт сигналы на покупку и продажу в виде стрелочек: стрелочка вверх — сигнал на покупку, вниз — на продажу.   В правом верхнем углу показаны сигналы индикатора на 6 таймфреймах (M1, M5, M15, M30, H1, H4) данной валютной пары.  Индикатор сво
Trend Predictor
Pavel Krysanov
This indicator is designed to identify trend reversal points. Its main difference from others is that it does not use moving indicators such as MA and built on its basis, namely, it does not show a trend reversal after the fact of a reversal, but tries to predict a trend reversal even BEFORE the reversal begins. The indicator is based on many different author's developments that allow you to minimize the number of false signals. The Trend Predictor indicator will be a very good helper in your
SmartStrategy
Pavel Krysanov
The Smart Strategy Indicator is a trading system that allows you to analyze the market in terms of several aspects of technical analysis. The first of them is a price channel, which is built automatically and allows the trader to see the main direction of price movement. It also makes it possible to analyze the market using a channel strategy (breakout and rebound from channel lines). Block 2 is the SAR system, which gives general information about the micro-movements in the market and this is
TrendCheck
Pavel Krysanov
The indicator has a new logic, which significantly distinguishes it from many analogues. It gives early entry and exit signals, does not redraw its values - that is, if the indicator gave a signal to enter a trade, then this signal will not disappear and will not move - it will remain where it appeared, and it also gives signals to opening a candle, which gives the trader a significant advantage in trading. The indicator is very easy to use. When a red line appears under the candles, you need
ExactArrows for MT5
Pavel Krysanov
3 (3)
The main objective of this indicator is to determine entry and exit points, that is why ExactArrow draws nothing but arrows showing entry and exit points. In spite of apparent simplicity of the indicator, it has complicated analytic algorithms which determine entry and exit points. The indicator generates exact and timely entry and exit signals which appear on the current candle. The indicator generates an average of 1-2 candles before its analogues do. The indicator is very easy to use. Open Bu
SmartArrows
Pavel Krysanov
5 (1)
For any trader, the result of market analysis is the correct identification of the market entry and exit points. The more correctly they are selected, the more profitable the trading. The SmartArrows indicator does not display any excessive information that may distract or confuse the trader, but only the mot important things. The indicator is very simple to use. When a down arrow appears, open a SELL trade, with an up arrow open BUY. Despite its seeming simplicity, the SmartArrows indicator con
TrendStar
Pavel Krysanov
This indicator is designed to help traders find the market entry and exit points. The indicator generates signals in the form of arrows, which is a simple and intuitive for use in trading. In spite of apparent simplicity of the indicator, it has complicated analytic algorithms which determine entry and exit points. Its operation is based on moving averages, RSI, candlestick patterns, as well as certain original developments. Open a Buy position when an upward arrow appears, and a Sell position w
ClearArrows MT5
Pavel Krysanov
For any trader, the result of market analysis is the correct determination of entry and exit points from the market. The ClearArrows indicator does not display any unnecessary information that may distract or mislead the trader, but only the most important thing. The indicator is very easy to use, when a down arrow appears, you need to open a SELL deal, when an up arrow appears you need to open a BUY deal. The ClearArrows indicator, despite its outward simplicity, has a large analytical algori
Основная цель индикатора заключается в определении наиболее оптимальных точек входа в сделку и выхода из нее. Индикатор состоит из трех частей. Первая – это стрелки, показывающие оптимальные точки входа в сделку и выхода из нее. Стрелка вверх – сигнал на покупку, стрелка вниз – на продажу. В индикаторе заложен алгоритм аналитического анализа, который включает в себя множество показаний стандартных индикаторов, а также авторский алгоритм. Вторая часть – это информация в правом верхнем углу (работ
AnalyticTrade
Pavel Krysanov
Индикатор Analytic Trade - это полноценная торговая система. Он состоит из 4 частей: Первая - это стрелочки, показывающие наиболее оптимальные точки открытия и закрытия ордеров. Стрелка вверх - сигнал на покупку, вниз - на продажу. Вторая - это информационная панель в правом верхнем углу. Крупным шрифтом обозначена текущая цена, над ней показаны: максимум дня, расстояние от текущей цены до него и разность максимума и минимума (в пунктах). Под ней расположены: минимум дня, расстояние до минимума,
Индикатор Trading Strategy призван помочь трейдерам в поиске оптимальных входов в сделку и выходов из неё. В его основе лежат показания технических индикаторов (MA, RSI, ATR и др.), а также авторский алгоритм, связывающий их сигналы в единое целое. Индикатор даёт сигналы на покупку и продажу в виде стрелочек: стрелочка вверх — сигнал на покупку, вниз — на продажу. В правом верхнем углу показаны сигналы индикатора на 6 таймфреймах (M1, M5, M15, M30, H1, H4) данной валютной пары. Индикатор свои з
SignalArrow
Pavel Krysanov
The main objective of this indicator is to determine entry and exit points, that is why ExactArrow draws nothing but arrows showing entry and exit points. In spite of apparent simplicity of the indicator, it has complicated analytic algorithms which determine entry and exit points. The indicator generates exact and timely entry and exit signals which appear on the current candle. The indicator generates an average of 1-2 candles before its analogues do. The indicator is very easy to use. Open Bu
필터:
Misha_82
67
Misha_82 2019.01.23 11:45 
 

사용자가 평가에 대한 코멘트를 남기지 않았습니다

리뷰 답변
버전 2.2 2019.08.06
Теперь панель индикатора на любом экране отображается одинаково