WindFlow MT5
- 지표
- Carmine Pinto
- 버전: 2.21
- 활성화: 15
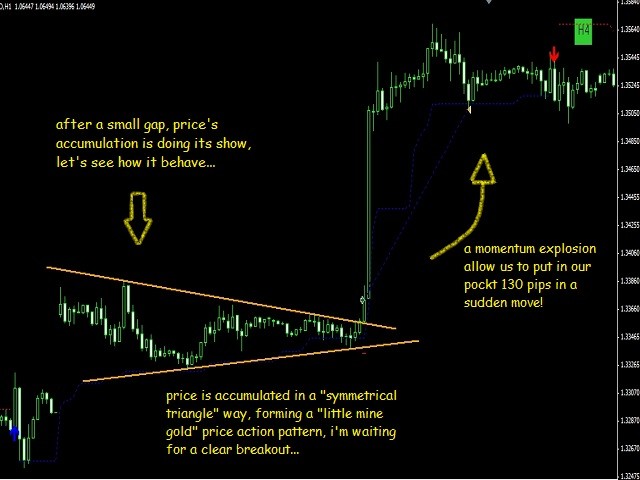
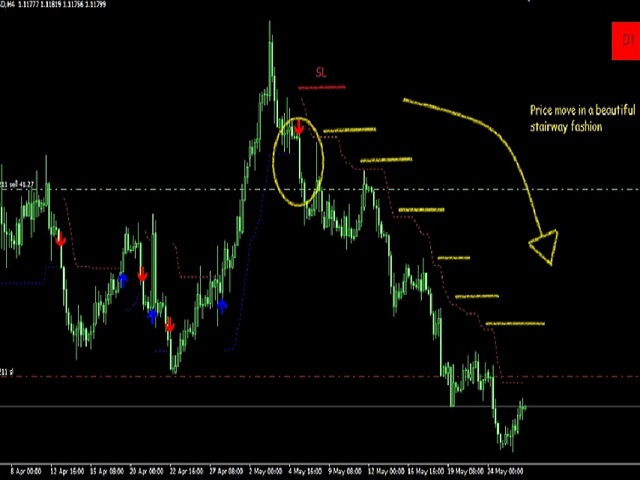
WindFlow is a powerful solution for manual traders that will drive your trading decisions in no time. I designed this indicator taking into account three main concepts: momentum, break of recent trend and volatility. Just like the wind's flow any trend can have small correction or major change in its direction based on the main trend's strength, so at glance you can have a very good idea on the next "wind's direction" when you look at your charts.
How to properly use WindFlow?
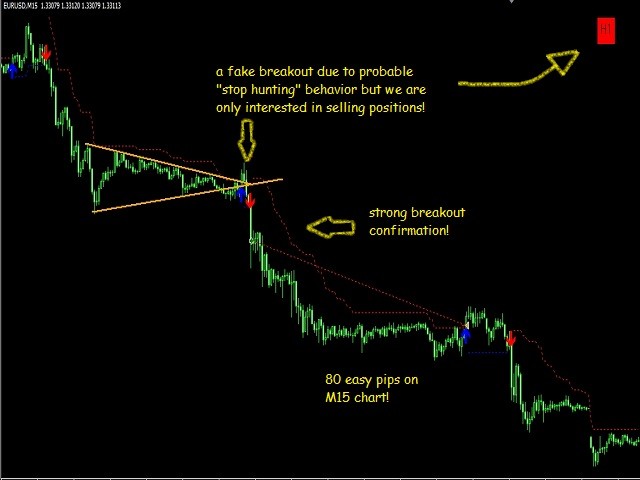
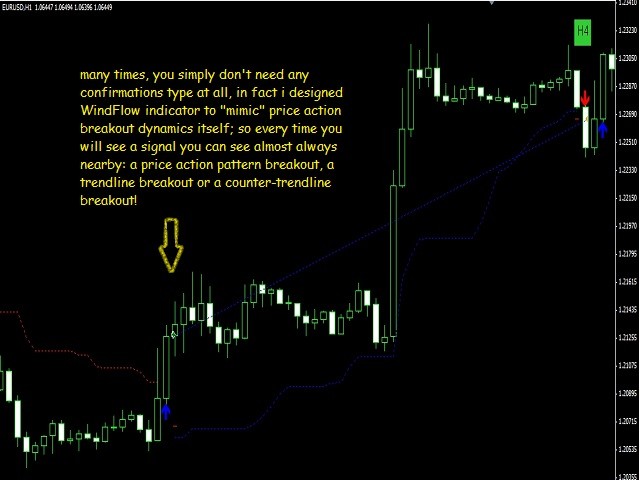
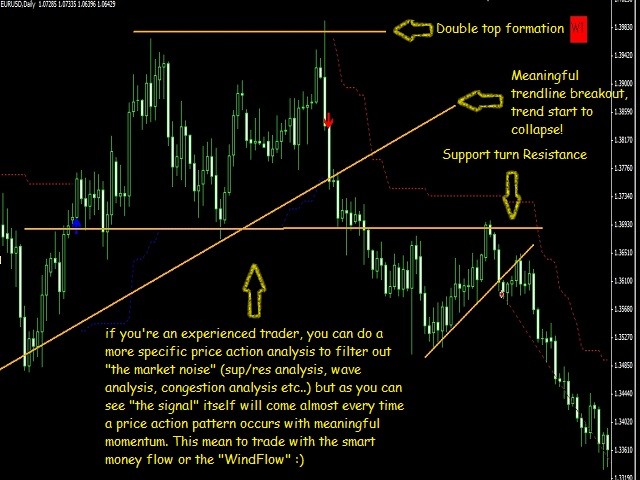
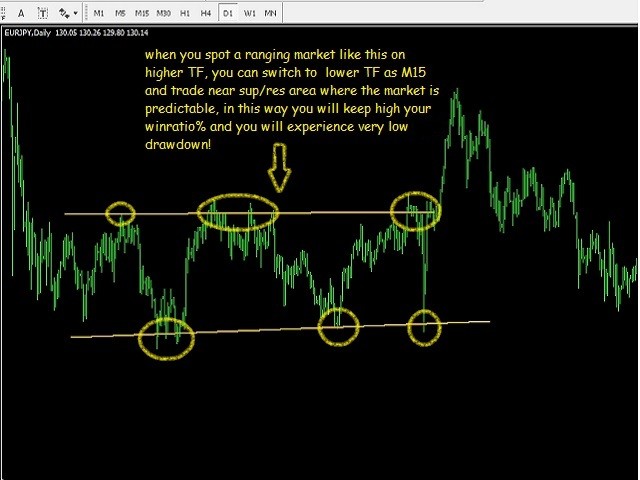
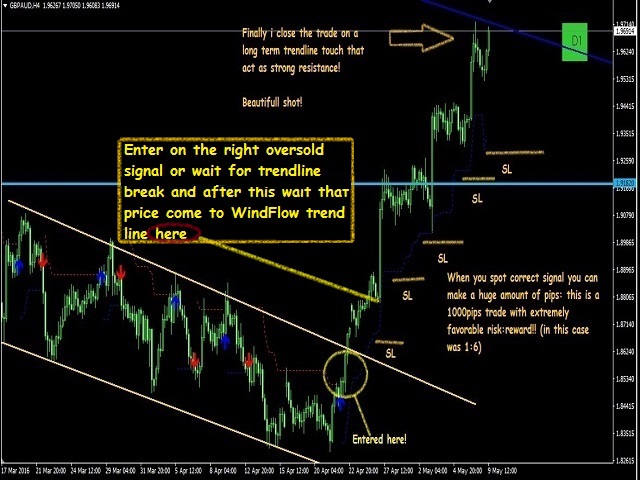
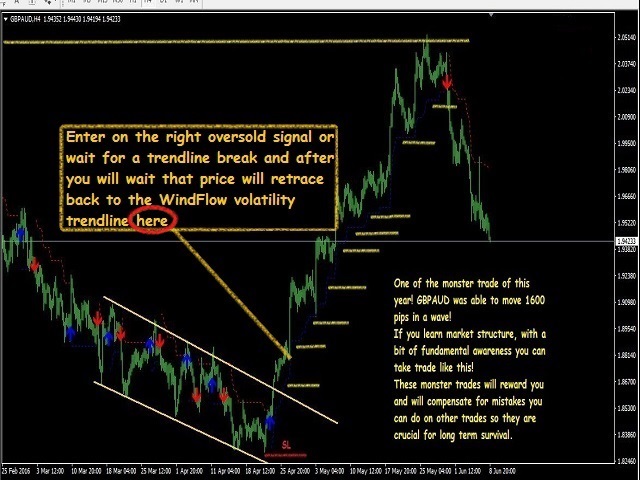
WindFlow is the perfect tool to have a very clear picture about the recent market dynamics, this because it is based on dynamic's concepts itself just like the wind is dynamic. When you see a new signal it is the time to take some action; if you are an experienced trader you can confirm this signal with your own analysis; if you are a newbie in the trading world you have found a great friend in this tool, i suggest to confirm the signals just looking at the higher time frame's waves formation (higher high-lower high for uptrend for example) and doing a simple support and resistance analysis. Often you will find that market is ranging on higher TF (you will spot this by sup/res analysis), in this case you can easily switch to lower timeframe as M5 or M15 and start to trade near the support and resistance only (that you have spot on higher TF) thanks to WindFlow's indications, in this way you will have great winratio% and your drawdown will be very low. So make sure to spot the correct market type if it is trending or ranging just like the professional traders are doing! As you can see I'm sharing a great and useful tool here that help me every day in my trading activity, you can do also very well in trading but it is all up to you; so if trading is you real passion i give you the sureness that you can succeed as a trader.
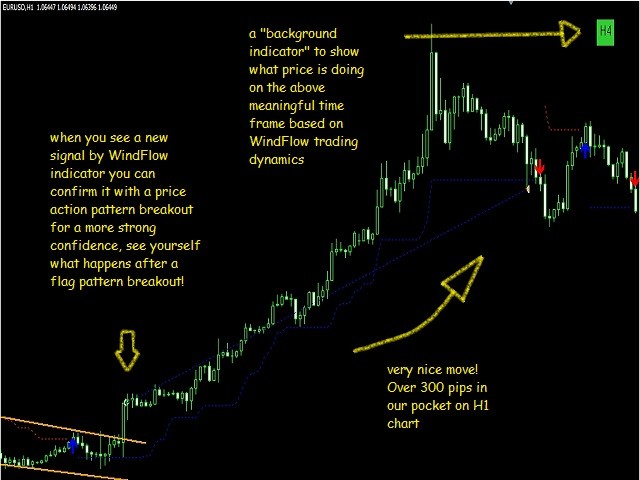
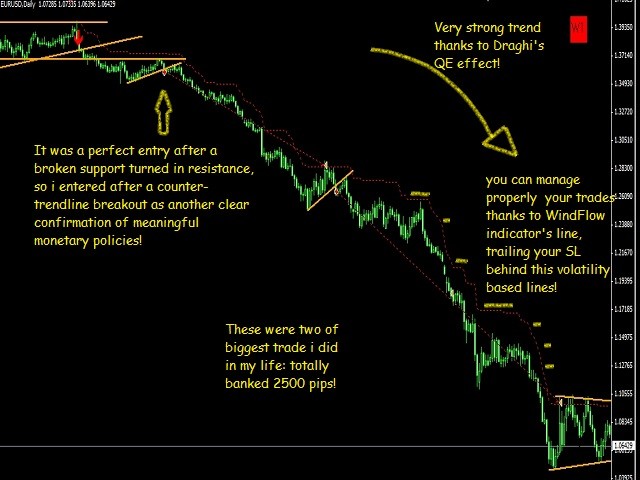
I also designed a simple tool that you can download for free, it will give you an idea on trend's background (it will show the trend on the above meaningful timeframe, as you probably know each TF is governed by its above TF) you will be amazed by this stressfree trading way, in fact you have also the possibility to do correct trade management thanks to the indicator's line that are very good places where trail your stop loss and protect your profit in a progressive manner without any doubts where to exit, in fact exits are much more important than entries to have a strong EDGE over the time (you will get a stop profit by contrary volatility or you can exit on opposite signals), i designed these tools to simplify my trading activity in these two main difficult tasks (especially from a psychological point of view): entry decisions and trade management.
Main Features:
- Never repaints
- Based on price action and volatility dynamics
- Extremely useful for technical analysis, entry signal and trade management task
- Works on every symbol and time frame
- Alert options like E-Mail and Notification Service for mobile devices
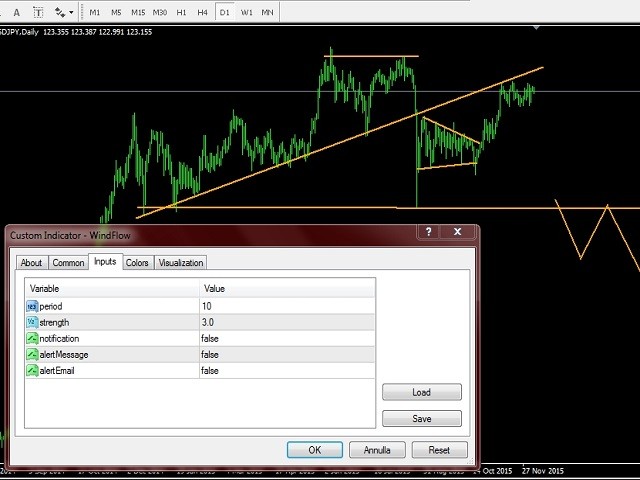
Inputs:
- period - indicator's period
- strength - indicator's strength signal
- notification - enable/disable notifications
- alertMessage - indicator's signals popup notify
- alertEmail - indicator's signals e-mail alerts