BeST Darvas Boxes MT5
- 지표
- Eleni Koulocheri
- 버전: 1.85
- 업데이트됨: 30 4월 2020
- 활성화: 10
BeST_Darvas Boxes is a Metatrader Indicator based on the trading method developed in the 50’s by the Hungarian Nicolas Darvas. BeST_Darvas Boxes indicator
- draws the Top and the Bottom of every Darvas Box that can be confirmed on the current Chart
- draws Buy and Sell Arrows for every confirmed Upwards or Downwards Breakout of the above levels
- draws always only after the bar closing and so is non-repainting or backpainting
- it can be used as a standalone trading system/method
Inputs
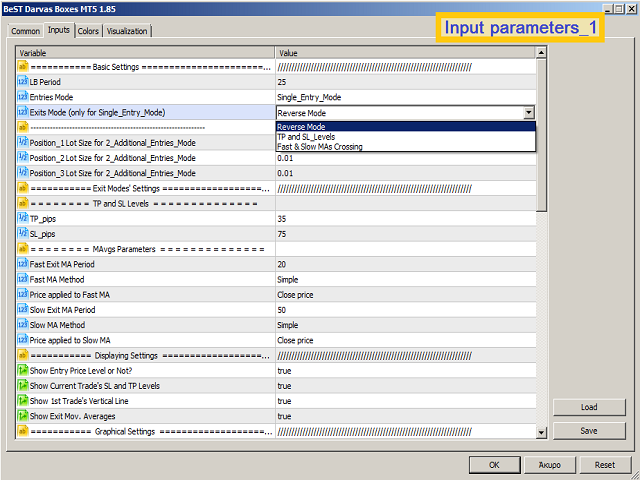
Basic Settings
- LB Period - LB # of bars for calculating the Darvas Boxes
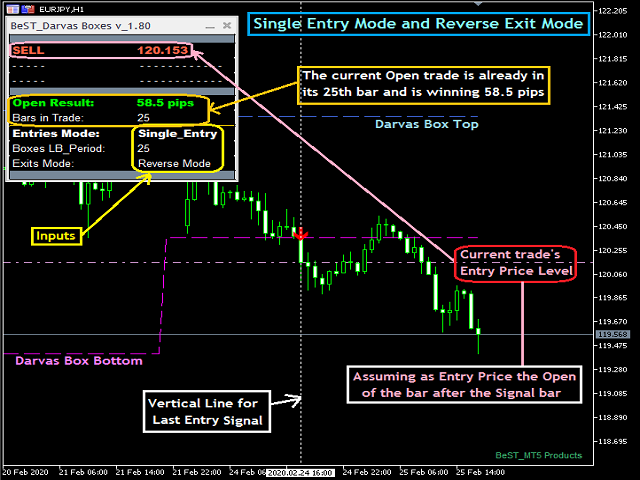
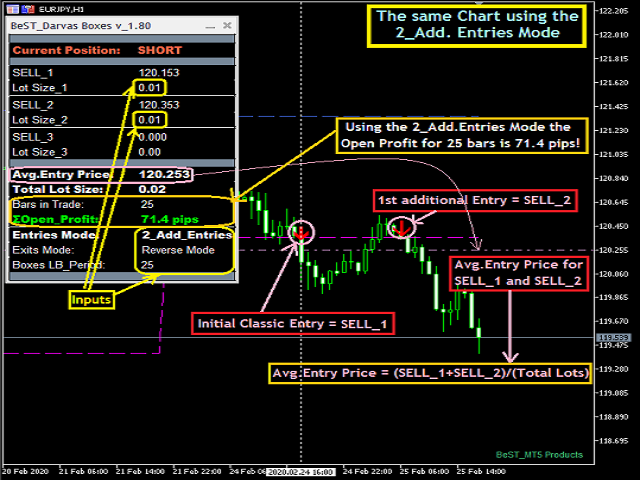
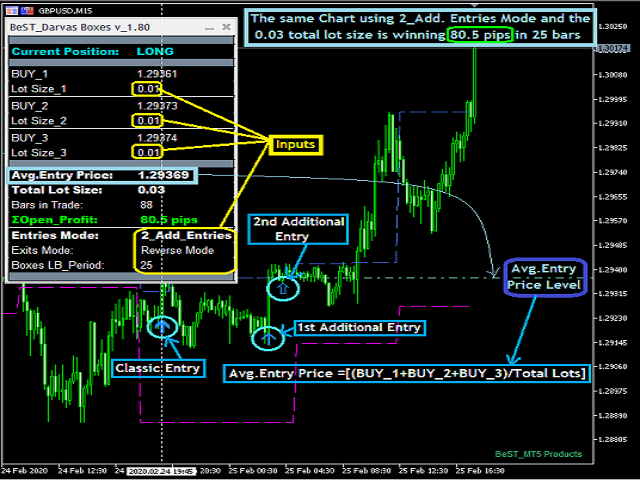
- Entries Mode – for selecting how to Enter the Market i.e. in a Single Entry or in a 2_Additional Entries
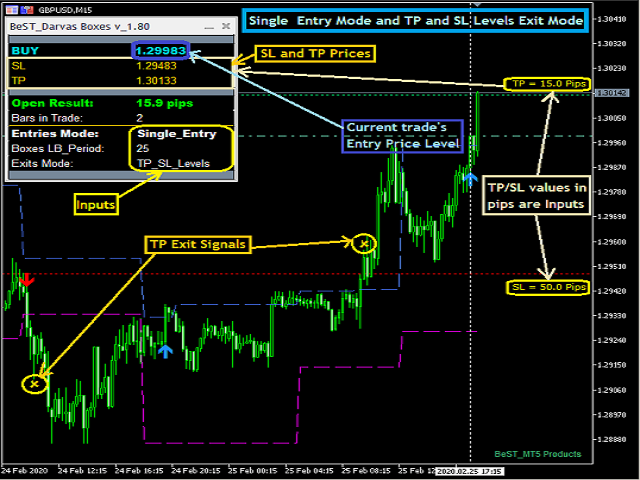
- Exits Mode (only for Single_Entry_Mode) – for selecting how to Exit a position.Works only for the Single Entry Mode while for the 2 Additional Entries Mode is by default the Reverse Mode
- Position_1,2 and 3 Lot Size for 2_Additional_Entries_Mode – for the correct calculation of the Average Entry Price if we use the 2_ Additional_Entries_Mode
Exit Modes' Settings
- TP and SL Levels – for selecting TP and SL pip values if Exiting with a SL/TP
- MAvgs Parameters – for selecting the parameters of 2 Mov.Averages if Exiting with their crossings
Displaying Settings - for selecting which chart objects and features to show/activate
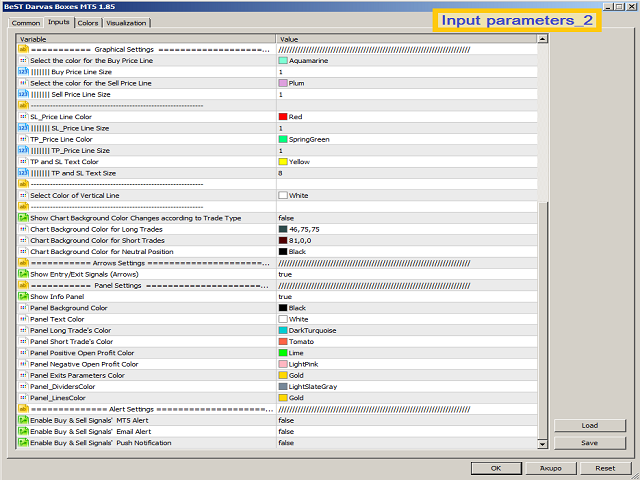
Graphical Settings – for selecting the color and size of drawn objects like Vertical Line locating the last Entry Signal and the corresponding Entry Price Level Horizontal Line and TP/SL Levels
Note: Color and size of all other’s drawn objects (like Exit MAs,Arrows,…) are controled in the tab Colors
Arrows Settings - for controlling the Arrows use for Entry and Exit Signals
Panel Settings - for controlling the use of the Trade Info Panel
Note: All Panel Infos are Real Time Updated while the Panel is fully color adjustable and can be moved anywhere in the chart
Alert Settings - for controlling the use of Entry and Exit alerts
For EA Developers
Top of a Box : Buffer = 1
Bottom of a Box : Buffer = 2
Buy Arrow :
(Single_Entry_Mode/
1st position for the 2_Additional_Entries_Mode) Buffer = 3
Sell Arrow :
(Single_Entry_Mode/
1st position for the 2_Additional_Entries_Mode) Buffer = 4
Add_Buy_2 Arrow: Buffer = 5
Add_Sell_2 Arrow: Buffer = 6
Add_Buy_3 Arrow: Buffer = 7
Add_Sell_3 Arrow: Buffer = 8
Custom_Exit_Signal: Buffer = 9
Exit_fastMA: Buffer = 10
Exit_slowMA: Buffer = 11


Nice that someone took the time for this. But it is not working on Mac. When asked about it I don't hear anything. Luckily I have a windows pc as well.