Volume Spread Pattern Indicator MT5
- 지표
- Young Ho Seo
- 버전: 2.2
- 업데이트됨: 3 3월 2022
- 활성화: 5
Introduction
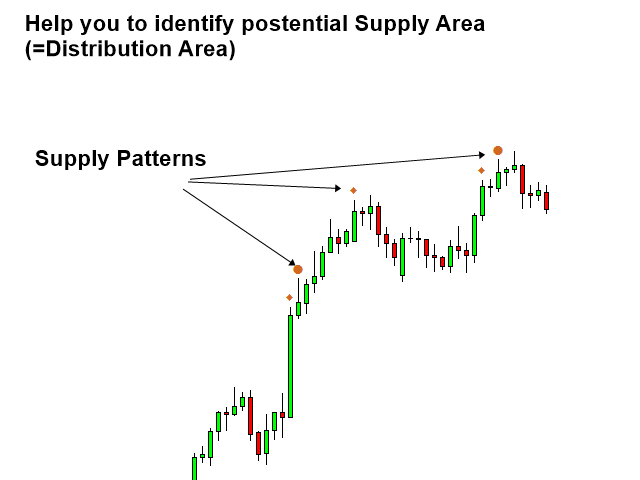
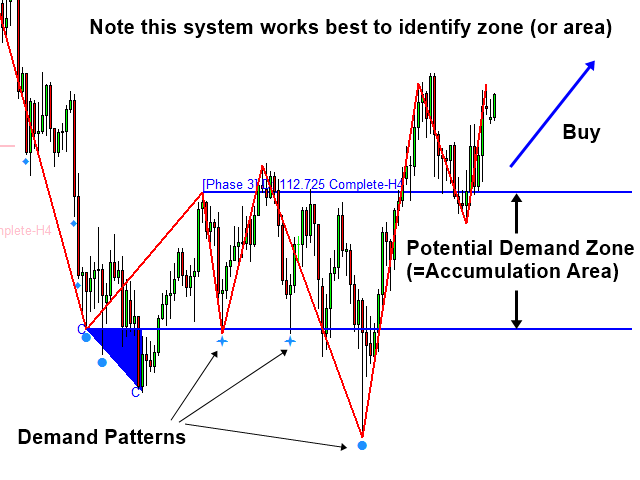
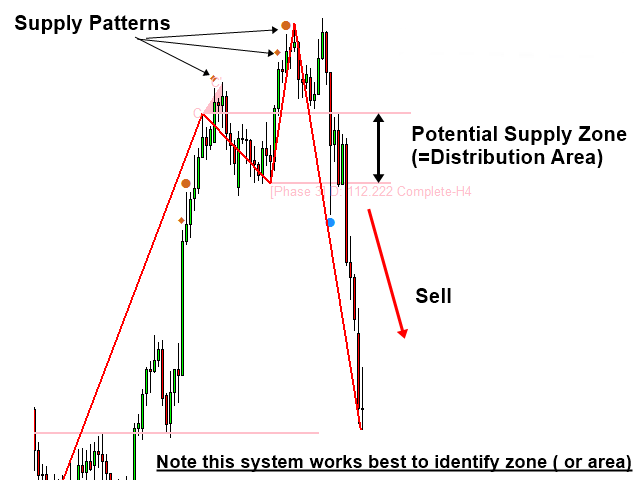
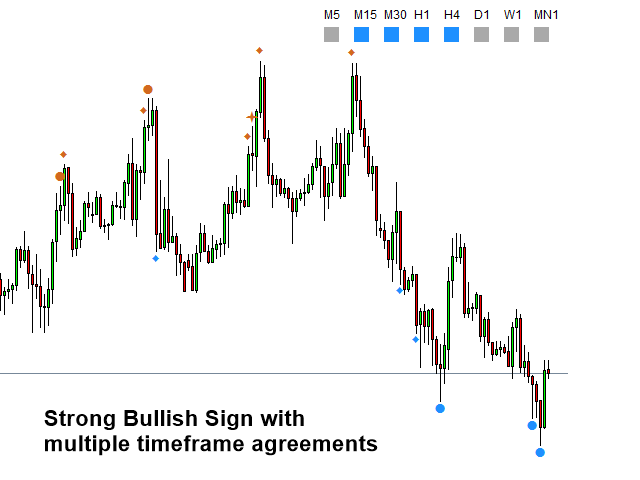
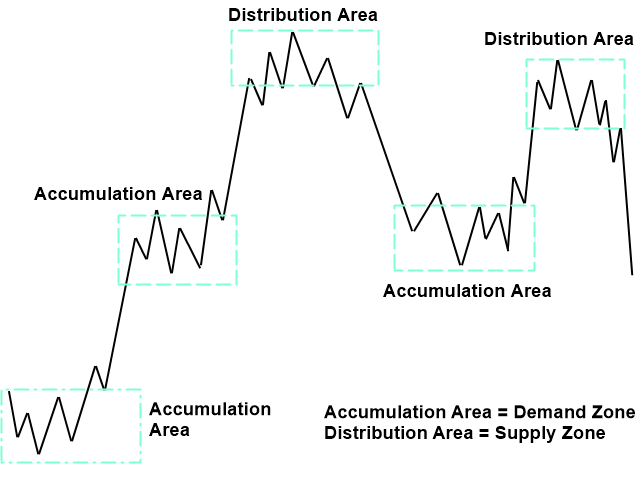
This indicator detects volume spread patterns for buy and sell opportunity. The patterns include demand and supply patterns. You might use each pattern for trading. However, these patterns are best used to detect the demand zone (=accumulation area) and supply zone (=distribution area). Demand pattern indicates generally potential buying opportunity. Supply pattern indicates generally potential selling opportunity. These are the underlying patterns rather than direct price action. The effect of buy and sell market may come after observing several of these patterns sometimes. Therefore, these patterns are useful in detecting possible demand zone (=accumulation area) or supply zone (=distribution area). In overall this is easy and simple indicator to support your trading operation. Trading principle is based on the modified volume spread analysis. We do not use sub phase A, B, C, D and E of Wyckoff phases due to the high subjectivity in detecting them. Instead, we focus on identifying accumulation and distribution area using demand and supply patterns. This is simpler and more effective approach.
Input Recommendation
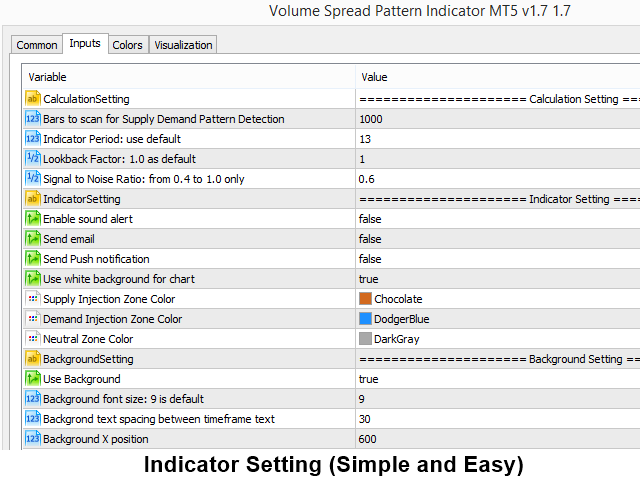
Most of time you can use default setting for this volume Spread Indicator. However, you might want to tweak around to use for your specific needs. Here is the complete description of input settings.
Calculation Settings
- Bars to scan: Amount of bars to calculate demand and supply pattern.
- Indicator Period: Calculation period to generate each supply and demand patterns.
- Lookback Factor: 1.0 as default
- Signal to Noise Ratio: from 0.4 to 1.0 only. (Input used to filter random fluctuations in data.)
Indicator Setting
- Enable sound alert: Sound alert for patter detection. (true or false only)
- Send email: Email notification for pattern detection. (true or false only)
- Send Push notification: push notification for pattern detection (true or false only)
- Use white background for chart: Set this to false if you just want to use default black background color.
- Supply Pattern Color: color of supply patterns.
- Demand Pattern Color: color of demand patterns
- Neutral Pattern Color: color of neural patterns or no patterns.
Background settings
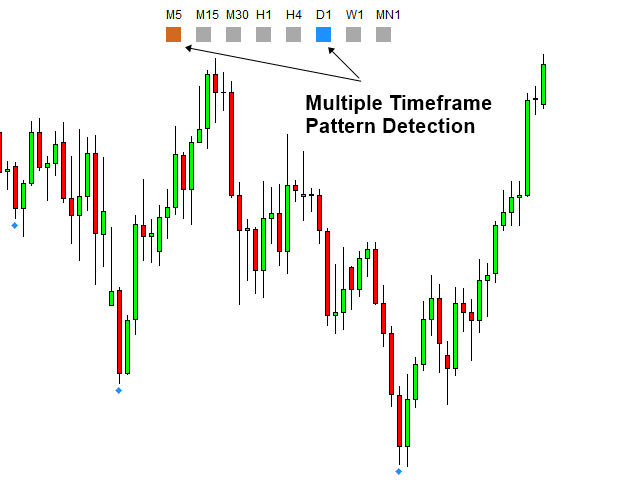
Background refers to the multiple timeframe pattern detection of supply and demand patterns. In this setting, you can control which timeframe patterns you want to use together in your chart for your decision-making. These inputs are mostly for graphic panel. Depending on which screen size you are using, you might have to change these inputs.
- Use Background: true or false to switch on and off multiple timeframe pattern detection.
- Background font size: 9 is default
- Background text spacing between timeframe text
- Background X position: staring position X of Background panel
- Background Y position: staring position Y of Background panel
- Background rectangle size (it is square always): Size of rectangle
- Background rectangle distance from timeframe text: distance between text and rectangle
Trading Strategy Guide
Volume Spread Pattern Indicator can run best to identify Demand zone (=accumulation area) and supply zone (=distribution area). When you run with Excessive Momentum Indicator, C point of Excessive Momentum become the selling climax (SC) or the buying climax (BC). Then you will use demand and supply patterns to confirm the accumulation area and distribution area for your trading. Both short term and long term trading is possible. Please check the trading stragey guide below:
Strategy Guide: https://www.mql5.com/en/blogs/post/750390
Important Note
This is the off the shelf product. Therefore, we do not accept any modification or customization request on this product. In addition, we do not provide any code library or any support for your coding for this product.