KT Momentum Arrows MT5
- 지표
- KEENBASE SOFTWARE SOLUTIONS
- 버전: 3.0
- 업데이트됨: 19 7월 2022
- 활성화: 10
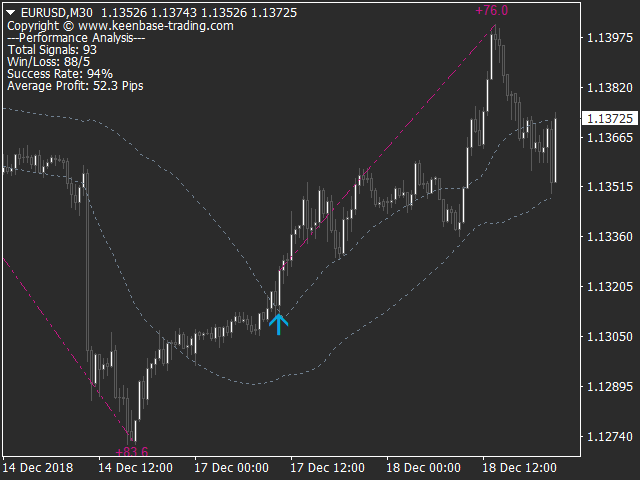
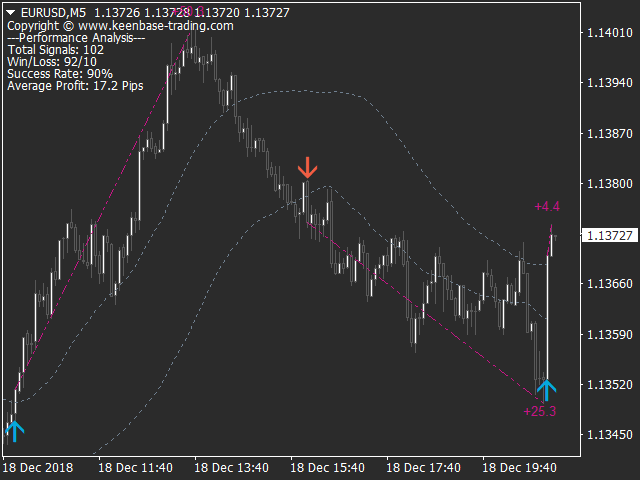
KT Momentum Arrows Indicator is based on a momentary breakout which is calculated using the bands deviation and emerging volatility in a certain direction.
A buy signal is generated when the price closes above the upper band and a sell signal is generated when the price closes below the lower band.
A magnitude coefficient is used as the input which affects the band deviation and volatility at the same time. The coefficient value should be carefully selected and analyzed based on the instrument and time frame.
MT4 version is available here KT Momentum Arrows MT4
Key Features
- No Repaint!
- A great entry tool for momentum traders.
- Performance analysis elements such as Win/Loss, Success rate, Avg. Profit etc.
- Suitable for Day Traders, Swing Traders, and Scalpers.
Input Parameters
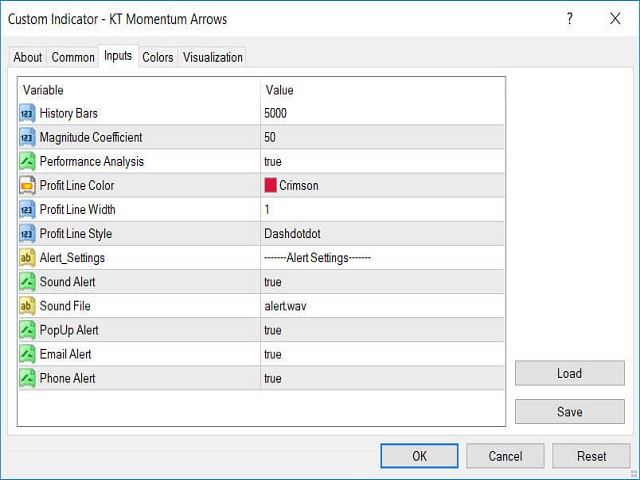
- History Bars: Number of bars to use for indicator data calculation.
- Magnitude Coefficient: A single coefficient to adjust the band deviation and volatility measurement.
- Performance Analysis: Show/hide performance analysis including the profit trend lines.
- Alert Settings: Pop up, Email, Push notifications and Sound alerts are available.
- Rest of the inputs are self-explanatory.
EA Developers
// Defining Arrays
double Buy_Signal[];
double Sell_Signal[];
double Upper_Band[];
double Lower_Band[];
// Indicator handle
int KT_Momentum_Arrows_Handle = iCustom(_Symbol,0,"Market/KT Momentum Arrows");
// Copying buffers into the arrays
CopyBuffer(KT_Momentum_Arrows_Handle,0,1,1,Buy_Signal);
CopyBuffer(KT_Momentum_Arrows_Handle,1,1,1,Sell_Signal);
CopyBuffer(KT_Momentum_Arrows_Handle,2,1,1,Upper_Band);
CopyBuffer(KT_Momentum_Arrows_Handle,3,1,1,Lower_Band);
// Detecting the buy/sell signals
if(Buy_Signal[0]!=0)
{
// Do something with buy condition
}
if(Sell_Signal[0]!=0)
{
// Do something with sell condition
}


Best indicator I've ever bought.
Also, the author is very involved.