KT Momentum Arrows
- 지표
- KEENBASE SOFTWARE SOLUTIONS
- 버전: 2.2
- 업데이트됨: 7 1월 2019
- 활성화: 5
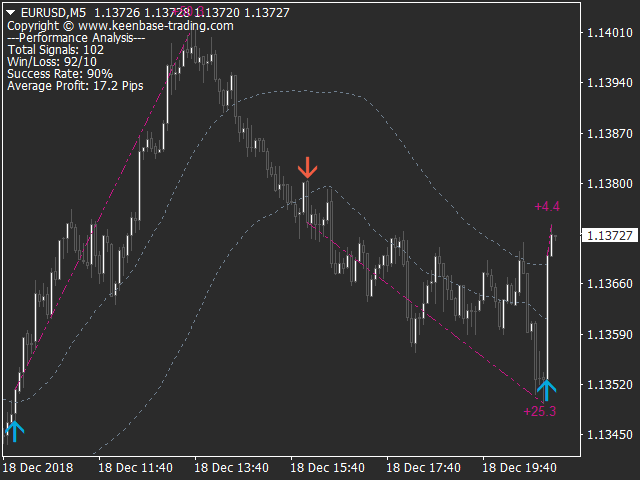
KT Momentum Arrows 인디케이터는 순간적인 돌파 신호에 기반한 도구로, 밴드의 이탈 범위와 특정 방향으로 나타나는 변동성을 계산하여 신호를 생성합니다. 이 도구는 가격의 강한 움직임이 시작되는 시점을 빠르게 감지할 수 있도록 설계되었습니다.
가격이 상단 밴드를 상향 돌파하여 마감되면 매수 신호가 생성되며, 하단 밴드를 하향 돌파하여 마감되면 매도 신호가 생성됩니다.
밴드의 이탈과 변동성에 동시에 영향을 주는 '계수' 입력값이 있으며, 이는 거래 종목 및 시간 프레임에 따라 신중하게 분석 및 선택해야 합니다.
주요 특징
- 재도색 없음!
- 모멘텀 트레이더를 위한 훌륭한 진입 도구입니다.
- 승률, 손익비, 평균 수익 등 성과 분석 기능 포함.
- 단타, 스윙, 스캘핑 모든 스타일에 적합합니다.
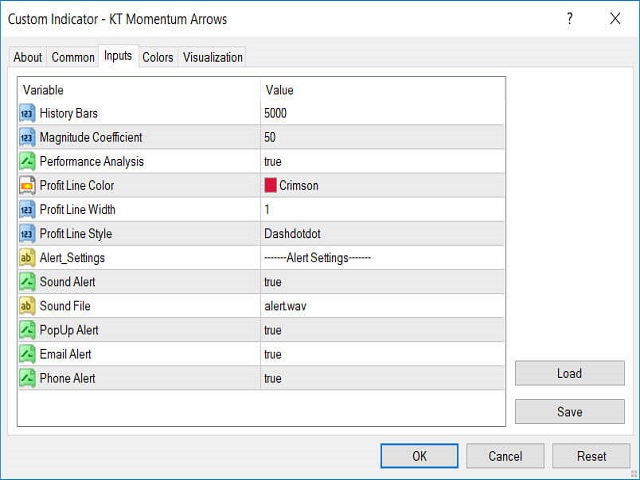
입력 파라미터
- 히스토리 바: 지표 계산에 사용할 바의 수.
- 모멘텀 계수: 밴드 이탈 및 변동성 측정에 사용하는 계수.
- 성과 분석: 수익 추세선을 포함한 성과 분석 표시 여부.
- 알림 설정: 팝업, 이메일, 푸시 알림, 사운드 알림 제공.
- 기타 설정은 직관적으로 이해할 수 있습니다.