• 미리보기
  • 리뷰
  • 코멘트

Doonchian

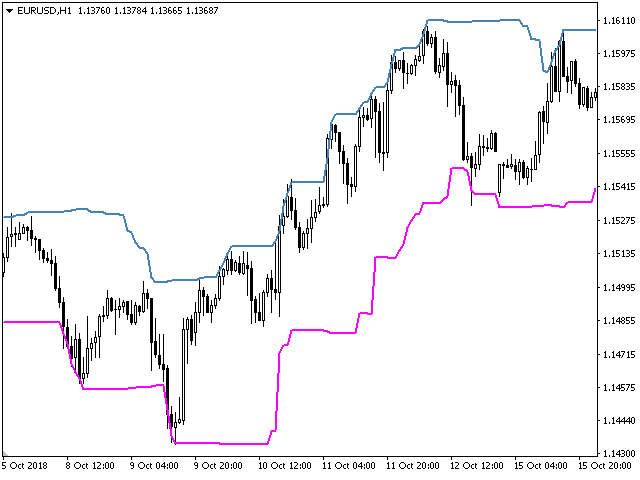
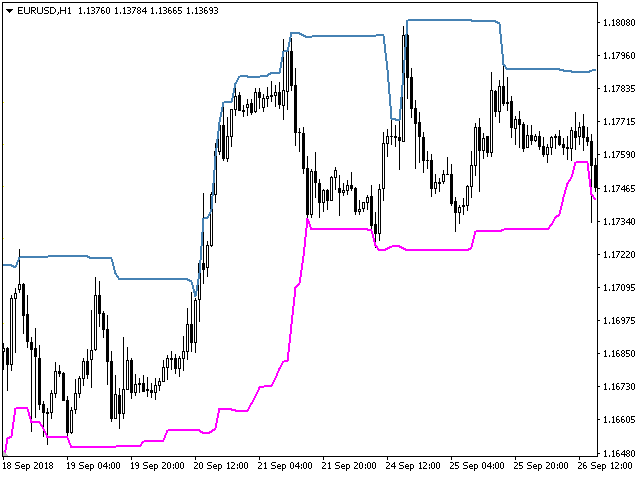
The Doonchian channel consists of two channel displays. Channel lines are determined by a simple and reliable algorithm. The channel is preferably used for trading inside the channel. The indicator does not redraw and does not lag; simple algorithms are the basis of the work. It works on all currency pairs and on all timeframes. As always a warning, we must not forget that the approach must be comprehensive, the indicator signals require additional information to enter the market.

추천 제품
XFibo Auto Fibonacci
Welinton Dos Reis Goncalves
5 (1)
Use with disciplined risk management. Fibonacci entry system based on the golden zone 38.2 - 61.8 where the entry is confirmed at 23.6 with indications of Take Profit 3:1. Automatically plotted Fibonacci contains retracement and expansion Fibonacci in a single indicator. Up to 77% win rate with this system. FTMO challenge pass with 0.50% risk and 1.50% R:R.
TrendWave Oscillator is an advanced MT4 oscillator that not only identifies the trend direction but also provides visual and audio alerts to enhance trading strategies. Key Features: - Color-coded trend indication:   - Blue : Indicates an uptrend, signaling potential price growth.   - Orange : Indicates a downtrend, suggesting possible price decline.   - Gray : Represents a flat market or lack of clear entry signals. - Graphical signals on the chart :   - Aqua : Highlights an uptrend, emphasi
PDP indicator is used for: defining price probability distributions. This allows for a detailed representation of the channel and its borders and forecast the probability of a price appearing at each segment of its fluctuations; defining the channel change moment. Operation principles and features PDP analyzes a quote history on lower timeframes and calculates a price probability distribution on higher ones. Forecast algorithms allow the indicator to calculate probability distributions and mov
Knight
Stefan Stoyanov
1 (1)
This indicator shows the market entry and exit points. It is good for both beginners and professional traders. The product works on any timeframe and financial instrument. The indicator is designed for scalping. It does not redraw. It is based on the divergence between two moving averages, which have a special smoothing algorithm. The first moving average is colored in Magenta . It indicates the general movement of the trend. The second moving average is colored in LawnGreen . It appears on the
GO Trend MultiTimeFrame
Martin Alejandro Bamonte
GoTrend Multi-Timeframe 지표 "GoTrend Multi-Timeframe" 지표는 여러 시간 프레임에서 통화쌍의 전체 및 특정 추세를 빠르고 효율적으로 평가하려는 트레이더에게 필수적인 도구입니다. 이 지표는 트레이더가 시장 방향에 대한 명확하고 포괄적인 시각을 한눈에 얻을 수 있도록 하여 의사 결정을 최적화하고 거래 전략의 효과를 높일 수 있습니다. 주요 특징: 다중 시간 프레임 분석: 이 지표는 M5, M15, M30, H1, H4 및 D1의 여섯 가지 다른 시간 프레임에 대한 포괄적인 분석을 제공하여 트레이더가 각 기간의 추세를 이해할 수 있도록 합니다. 통합 기술 지표: 이 지표는 RSI, SAR, MA, MACD 및 ADX의 다섯 가지 강력한 기술 지표를 사용하여 각 시간 프레임에서 추세 방향을 결정합니다. 명확하고 직관적인 시각화: 신호는 직관적인 기호와 색상으로 메인 차트의 원하는 코너에 표시됩니다. 이를 통해 트레이더는 시장 상황을 한눈에 평가할 수
The SPV Volatility indicator is one of the most effective filters. Volatility filter. Shows three volatility options. The so-called limit, real, and the last most effective filter for the filter is the percentage filter. Percentage display of folatility shows the ratio of limit to real volatility. And thus, if we trade in the middle of the channel, then it is necessary to set a condition that the percentage is less than a certain indicator value. If we trade on the channel breakout - following t
Order Blocks ICT Multi TF MT4
Diego Arribas Lopez
5 (2)
[ MT5 Version ]  [ Kill Zones ]  [ SMT Divergences ] How to trade using Order Blocks:  Click here User Interface Performance:  During testing in the strategy tester, the UI may experience lag. Rest assured, this issue is specific to the testing environment and does not affect the indicator's performance in live trading. Elevate your trading strategy with the  Order Blocks ICT Multi TF  indicator, a cutting-edge tool designed to enhance your trading decisions through advanced order block analys
Beautiful
Tatiana Savkevych
The Beautiful indicator shows potential market reversal points. The intelligent algorithm of the indicator detects the trend well, filters out market noise and generates input signals and exit levels. Uses just one parameter for settings. Simple, visual and efficient trend detection. The indicator does not redraw and does not lag. You can set up message alerts as sound or email. Works on all currency pairs and on all timeframes. Ready-made trading system.
Volume Profile Chart
Makarii Gubaydullin
가격 수준별 거래 시각화. 계산 기간을 자유롭게 설정할 수 있습니다: 두 개의 수직선 사이 또는 고정된 시간 간격. 히스토그램 수준은 상대적입니다: 더 넓은 막대는 더 많은 거래량을 의미합니다. 분포의 극단값은 지지선과 저항선 수준으로 사용될 수 있습니다. 모든 스타일, 크기 및 색상을 사용자 지정할 수 있습니다. 다기능 유틸리티 : 66개 이상의 기능 포함  |   질문이 있으면 저에게 연락하세요  |  MT5 버전 지표 설정에서 다음을 구성할 수 있습니다: 히스토그램 스타일: 시각 모드:  막대   /   선   /  외곽선   /   방향   (각 수준에서 우세한 가격 방향에 따라 색상이 결정되는 막대)。 히스토그램 위치:  차트 경계   /   시간 범위 내   /   시간 범위 외 : 왼쪽 / 오른쪽。 2개의 히스토그램 색상。 히스토그램   너비。 히스토그램 크기 (% 차트   너비 )。 계산 설정: 범위 경계 유형:  차트 2선 사이   /  지정된 최근 분   / 
HedgeHammer EURUSD
Raphael Schwietering
5 (1)
HedgeHammer는 Hedging을 사용하는 지능형 자동화 Expert Advisor입니다. 진입 및 퇴장 기회를 얻기 위해 일부 지표와 결합된 자체 복잡한 알고리즘으로 작업하고 있습니다. 입장 및 퇴장 논리는 Bar Close에서만 작동합니다. 이것은 시장 소음을 걸러내고 최적화 속도를 크게 높이고 손절매를 방지하고 합리적인 스프레드로 모든 브로커에서 적절한 운영을 보장합니다. EA는 고급 알고리즘을 사용하여 진입점을 찾고 시장 진입 및 퇴장을 위한 몇 가지 추가 필터를 찾습니다. Expert는 EURUSD의 역사적 M15 기간으로 테스트되었으며 예외적인 결과를 얻었습니다. 데모를 다운로드하여 직접 테스트할 수 있습니다. 내 테스트는 99.90% 정확도, 실제 스프레드, 추가 미끄러짐 및 높은 수수료로 실제 틱 날짜로 수행되었습니다. 그리드 없음, 마틴게일 없음, 차익 거래 없음, 틱 스캘핑 없음, 곡선 피팅 없음! 2년 동안 1개의 로트 크기로 99% 품질 백테스
TMoney OrderBLockWeek
Moises Orlando Urbina Sojo
The indicator is activated at the beginning of each week and detects both bullish and bearish ORDERBLOCK potentials. These levels are of high operational probability, being able to use a minimum ratio of 3 to 1 to maximize profits. It is recommended to use pending orders at the OB levels of the chart and place the SL up to a maximum of 20 pips from the entry price. Submit the indicator to Backtesting to become familiar with its performance and complement it with other trend or oscillation type
Impulse fractals indicator - is counter-trend oriented complex market fractal pattern.  Market creates bull/bear impulse, trend starts, fractals on impulsed wave are an agressive pullback signals. Buy arrow is plotted when market is bearish and it's impulse showed up-side fractal, and sell arrow is plotted when market is bullish and it's impulse showed dn-side fractal. Main indicator's adjustable inputs : impulsePeriod - main period of impulse histogram  filterPeriod  - smoothes impulse accordi
Others
Tatiana Savkevych
The Others indicator is a trend-type indicator. In those moments when you need to make a decision to enter a position and give the trader a direction. The indicator gives the trader the opportunity to visually determine which trend will be present at a particular time interval. These are auxiliary tools for technical analysis of the market. Recommended for use in conjunction with any of the oscillators. The main application of the Others indicator is to generate buy and sell signals. Determini
TMoney OrderblockDay
Moises Orlando Urbina Sojo
The indicator is triggered at the start of each trading day and detects both bullish and bearish ORDERBLOCK potentials. These levels are of high operational probability, being able to use a minimum ratio of 3 to 1 to maximize profits. It is recommended to use TimeFrame M5 to M30 for a proper display and consider pending orders at the OB levels of the chart and place the SL up to a maximum of 20 pips from the entry price. Submit the indicator to Backtesting to become familiar with its performan
The SFT Fibo Smart Pivot indicator is a powerful trading tool based on the Fibonacci Golden Ratio, designed to identify key support and resistance levels in the forex market. This indicator has the ability to pinpoint significant price levels that can serve as entry and exit points for trades. It enables traders to analyze the market more effectively and make well-informed decisions. The indicator uses the Fibonacci Golden Ratio to accurately determine support and resistance levels. These levels
FREE
VaviStar is an indicator based on trend retracements determined by ZigZag segments. It is theorized, and statistics confirm, that stocks react to certain retracement levels. Many use Fibonacci retracement levels (23.6%, 38.2%, 61.8%). It is assumed that once the price goes beyond the 61.8% retracement, we can already speak of a trend reversal. This indicator allows you to comfortably chart a segment of the ZigZag with the relative operating levels chosen. With a reversal mindset , you can use it
Pivot levels Auto V1
Hafis Mohamed Yacine
What Is a Pivot Point? A pivot point is a technical analysis indicator, or calculations, used to determine the overall trend of the market over different time frames. The pivot point itself is simply the average of the intraday high and low, and the closing price from the previous trading day. On the subsequent day, trading above the pivot point is thought to indicate ongoing bullish sentiment, while trading below the pivot point indicates bearish sentimen How to Use Pivot Points The very ess
Controls
Andriy Sydoruk
Channel indicator Control. A graphical tool that calculates the levels that form the channel and the moments of opening orders. Control has the ability to not only show tops and bottoms, fixing waves in the middle of its channel. This channel indicator is rather a cross between the ZigZag indicator and the real fractals. One of the surest and most profitable online trading methods is mid-channel trading. In fact, this is the same trend, but it differs in a more pronounced fixation of highs and
ZigZag Leg Break
Rider Capital Group
Get alerted (and see on the chart) when a zigzag leg break occurs!   Indicator works in real time, alerting and cleanly displaying when price closes beyond the last high/low zigzag.   This is important to confirm a trend is evolving in a healthy manner:    To confirm a trend is evolving in a healthy manner, not only do we need to see price moving higher/lower than its previous high/low, we also expect to see at least two closes beyond that high/low as further evidence that the market is accepti
Breakout Entry Signals MT4
Christopher Graham Parish
!! FLASH SALE !!   Over 80% off !!     For ONE week only. Now only $47 - normally $297! >>>      Ends on 30 June 2023 - Don't miss it! Buy and Sell Alerts when price breaks out following strict price action. Sends Alerts – On MT4 To Your Phone To Your Email Does not repaint . Works on any Forex pair, any timeframe. 10 Activations allowed so you are free from limitations >> MT5 Version Here For spreads from a tiny 0.1 pips RAW/ECN Accounts,  click here . Check out my Waka Esque EA signal her
The Sentiment Ratio indicator gauges current Market Sentiment between -100% and 100%, where lower than -40% is considered Bearish and higher than 40% is Bullish. The channel between the two is considered Neutral. The indicator has been a very useful filter tool for signals within a trading system. Example call function:  int SentimentIndicator(double triggerLevel)//Return sentiment if trigger level is activated {   double sentimentRatio=iCustom(NULL,0,"Sentiment Ratio",0,0,0);   if(sentimentRat
FREE
OVERVIEW The Vector Candle Zones Render indicator automatically renders boxes for vector candle zones that are yet to be recovered. The indicator is an implementation of an existing PVA candles indicator. Combine it with PVSRA and MarketMakerMethod strategy. FEATURES Software: MetaTrader4 - MT4 - 600+ build Timeframes: Multi-Timeframe Markets: Forex/Cryptos/Energies/Bonds/Metals/Indices/Futures/Commodities Customizable style parameters: Change Color style Change Percentage style C
Scalper Terminal 인터페이스 소프트웨어는 지표이며 자동 구매-판매 거래에 참여하지 않습니다. 이 지표는 스캘핑 거래 기회가 발생했을 때 거래가 들어갈 수 있는 현재 거래 영역을 보여줍니다. 스캘핑 신호가 있는 경우 해당 거래 쌍의 오른쪽에 청록색 표시등이 켜지고 그 위에 정확한 거래 방향이 표시됩니다. 그런 다음 청록색 버튼을 클릭하여 거래를 입력하세요. 새 탭이 열립니다. 이후 스캘핑 거래 진입 조건인 캔들 클로징이 예상된다. 스캘퍼 터미널과 성공적인 스캘핑 거래 거래를 하기 위해서는 설명 섹션의 동영상을 꼭 시청하세요. Scalper Terminal 소프트웨어에 군인처럼 붙어보세요. 각 거래 쌍의 오른쪽에는 5M, 15M 및 DIRECTION 열이 있습니다. 먼저 알림 버튼을 클릭하고 녹색으로 만듭니다. 화면을 계속해서 볼 필요는 없습니다. 청록색 빛 신호 또는 메타 트레이더 경고 메시지 소리를 기다리십시오. 청록색 빛으로 표시된 정확한 작동 방향(DIRECTI
Lines for MT4
Radim Kucera
Do you need to check support and resistance lines? Do you need to find them really fast and automatically? Do you want to set your own settings how to find them? Indicator Lines is developed for finding support and resistance lines on chart. It does its job quickly and fully automatically. Main principle of algorithm is to get all extremes on chart (according to "Density" parameter). Then indicator tries to find minimally 3 points (according to "Minimal count of points" parameter) which can be u
Smart Market Analyser
Elias Mtwenge
5 (1)
REMINDER: Early buyers hot price discount: Price subject to rise after first 20 copies. Starting price $65 and final price will be $1275. Secure your discounted copy Now! Smart Money Analyser Indicator User Manual 1. Introduction Welcome to the   Smart Money Analyser Indicator This powerful tool provides traders with comprehensive market analysis by combining various technical indicators to generate actionable trading signals. Designed to be user-friendly, this indicator helps traders of all
Psy Levels
THE FWA COMPANY
This free MT4 indicator allows you to automatically display psychological price levels on your chart It's very powerful when you combine it with other tools such as Fibs levels, Supports & Resistance levels, Moving Averages, Wyckoff schematics, etc. For example, you can use this indi to display horizontal levels every 100 points on your GER40 chart, or 500 points on your BTC chart, etc. ***Please comment, rate and share it to your friends if you like it***
FREE
Swing High Low Fibonacci
Frank Wesley Iii Mccallister
This indicator identifies the major and minor swing high and low points on a chart. It then takes the most recent swing and draws a fibonacci pattern of retracement and extension levels to give you an idea of where price may move next. It allow allows you to set a pair of moving averages to help identify the direction of the overall trend. There are configuration parameters for the major and minor swing and the moving averages.
Nice Try Super Diddy Trend – an innovative technical analysis tool designed for experienced traders seeking a deep understanding of market dynamics. This indicator utilizes complex algorithms to calculate liquidity flows and momentum, identifying potential reversal points and trend continuations. Uniqueness and Value Nice Try Super Diddy Trend is more than just signal generation—it analyzes the hidden structure of the market, examining the amplitude of price fluctuations and directionality while
MarketTrend
Ivan Simonika
This indicator will provide you with everything you need in order to overcome losses due to human emotions. The indicator determines the moments of a trend reversal and the direction of its movements. This development is equipped with the most modern, adaptable trading algorithms. The main secret of short-term trading is to have information on when to enter a deal. The indicator works great on all timeframes and informs the trader about the most successful moments of buying or selling a currency
Clever Trend Swing Levels
Carlos Forero
4.22 (9)
Description: The indicator measures, through the zigzag indicator, the levels of trend or correction. It shows in the chart the levels of each low or high detected. KEY LINKS:   How to Install  –  Frequent Questions  -  All Products  How is this indicator useful? This indicator determines, depending on Zigzag parameter if a trend is beginning, developing, or ending This indicator determines the direction of the trend Components Levels as positive or negative numbers, depending on the direction
FREE
이 제품의 구매자들이 또한 구매함
Gann Made Easy
Oleg Rodin
4.8 (117)
Gann Made Easy 는 mr.의 이론을 사용하여 최고의 거래 원칙을 기반으로 하는 전문적이고 사용하기 쉬운 Forex 거래 시스템입니다. W.D. 간. 이 표시기는 Stop Loss 및 Take Profit Levels를 포함하여 정확한 BUY 및 SELL 신호를 제공합니다. PUSH 알림을 사용하여 이동 중에도 거래할 수 있습니다. 구매 후 연락주세요! 내 거래 팁과 훌륭한 보너스 지표를 무료로 공유하겠습니다! 아마도 Gann 거래 방법에 대해 이미 여러 번 들었을 것입니다. 일반적으로 Gann의 이론은 초보자 거래자뿐만 아니라 이미 거래 경험이 있는 사람들에게도 매우 복잡한 것입니다. Gann의 거래 방식은 이론적으로 적용하기 쉽지 않기 때문입니다. 나는 그 지식을 연마하고 Forex 지표에 최고의 원칙을 적용하기 위해 몇 년을 보냈습니다. 표시기는 적용하기가 매우 쉽습니다. 차트에 첨부하고 간단한 거래 권장 사항을 따르기만 하면 됩니다. 지표는 지속적으로 시장 분석 작업
현재 20% 할인 ! 초보자 또는 전문가 트레이더를 위한 최고의 솔루션! 이 대시보드 소프트웨어는 28개의 통화 쌍에서 작동합니다. 2가지 주요 지표(Advanced Currency Strength 28 및 Advanced Currency Impulse)를 기반으로 합니다. 전체 Forex 시장에 대한 훌륭한 개요를 제공합니다. 고급 통화 강도 값, 통화 이동 속도 및 모든(9) 시간대의 28 Forex 쌍에 대한 신호를 보여줍니다. 추세 및/또는 스캘핑 기회를 정확히 파악하기 위해 차트의 단일 지표를 사용하여 전체 시장을 볼 수 있을 때 거래가 어떻게 개선될지 상상해 보십시오! 잠재적인 거래를 식별하고 확인하면서 강력한 통화와 약한 통화를 더욱 쉽게 식별할 수 있도록 이 지표에 기능을 내장했습니다. 이 표시기는 통화의 강세 또는 약세가 증가 또는 감소하는지 여부와 모든 시간대에서 수행되는 방식을 그래픽으로 보여줍니다. 추가된 새로운 기능은 현재 시장 조건 변화에 적응하는
Scalper Inside PRO
Alexey Minkov
4.76 (63)
!SPECIAL SALE! An exclusive indicator that utilizes an innovative algorithm to swiftly and accurately determine the market trend. The indicator automatically calculates opening, closing, and profit levels, providing detailed trading statistics. With these features, you can choose the most appropriate trading instrument for the current market conditions. Additionally, you can easily integrate your own arrow indicators into Scalper Inside Pro to quickly evaluate their statistics and profitability
Cycle Maestro
Stefano Frisetti
NOTE: CYCLEMAESTRO is distributed only on this website, there are no other distributors. Demo version is for reference only and is not supported. Full versione is perfectly functional and it is supported CYCLEMAESTRO , the first and only indicator of Cyclic Analysis, useful for giving signals of TRADING, BUY, SELL, STOP LOSS, ADDING. Created on the logic of Serghei Istrati and programmed by Stefano Frisetti ; CYCLEMAESTRO is not an indicator like the others, the challenge was to interpret only t
Gold Stuff
Vasiliy Strukov
4.86 (257)
Gold Stuff는 금을 위해 특별히 설계된 추세 지표이며 모든 금융 상품에서도 사용할 수 있습니다. 표시기가 다시 그려지지 않고 지연되지 않습니다. 권장 기간 H1. 표시기에서 완전 자동 Expert Advisor EA Gold Stuff를 작동합니다. 내 프로필에서 찾을 수 있습니다. 설정 및 개인 보너스를 받으려면 구매 후 즉시 저에게 연락하십시오!   강력한 지원 및 트렌드 스캐너 표시기의 무료 사본을 받으실 수 있습니다. 메시지를 보내주세요. 나!   설정 화살표 그리기 - 켜기 끄기. 차트에 화살표 그리기. 경고 - 가청 경고를 끕니다. 이메일 알림 - 켜기 끄기. 이메일 알림. Puch-notification - 켜기 끄기. 푸시 알림. 다음으로 색 영역을 조정합니다. Gold Stuff는 금을 위해 특별히 설계된 추세 지표이며 모든 금융 상품에서도 사용할 수 있습니다. 표시기가 다시 그려지지 않고 지연되지 않습니다. 권장 기간 H1. 표시기에서 완전 자동
Golden Trend Indicator
Noha Mohamed Fathy Younes Badr
5 (10)
Golden Trend indicator  is The best indicator for predicting trend movement this indicator never lags and never repaints and never back paints    and give  arrow buy and sell    before the candle appear  and it will help you and  will make your trading decisions clearer its work on all currencies and  gold and crypto and all time frame This unique  indicator uses very secret algorithms to catch the  trends, so you can trade using this indicator and see the trend clear on charts  manual guide and
GOLD Impulse with Alert
Bernhard Schweigert
4.6 (10)
이 지표는 Advanced Currency IMPULSE with ALERT  +   Currency Strength Exotics  의 2가지 제품의 슈퍼 조합입니다. 그것은 모든 시간 프레임에 대해 작동하며 8개의 주요 통화와 하나의 기호에 대한 강약의 충동을 그래픽으로 보여줍니다! 이 표시기는 금, 이국적인 쌍, 상품, 지수 또는 선물과 같은 기호에 대한 통화 강도 가속을 표시하는 데 특화되어 있습니다. 금, 은, 오일, DAX, US30, MXN, TRY, CNH 등의 진정한 통화 강도 가속(충동 또는 속도)을 표시하기 위해 9번째 줄에 모든 기호를 추가할 수 있습니다. 새로운 기본 알고리즘을 기반으로 구축되어 잠재적인 거래를 훨씬 더 쉽게 식별하고 확인할 수 있습니다. 이는 통화의 강세 또는 약세가 가속되는지 여부를 그래픽으로 표시하고 가속 속도를 측정하기 때문입니다. 자동차의 속도계처럼 생각하면 됩니다. 가속화할 때 Forex 시장에서 동일한 일이 분명히 더 빠르
Dynamic Forex28 Navigator
Bernhard Schweigert
5 (5)
Dynamic Forex28 Navigator - 차세대 외환 거래 도구. 현재 49% 할인. Dynamic Forex28 Navigator는 오랫동안 인기 있는 지표의 진화형으로, 세 가지의 힘을 하나로 결합했습니다. 고급 통화 Strength28 지표(695개 리뷰) + 고급 통화 IMPULSE with ALERT(520개 리뷰) + CS28 콤보 신호(보너스). 지표에 대한 자세한 정보 https://www.mql5.com/en/blogs/post/758844 차세대 Strength 지표는 무엇을 제공합니까?  원래 지표에서 좋아했던 모든 것이 새로운 기능과 더 높은 정확도로 강화되었습니다. 주요 기능: 독점적인 통화 Strength 공식.  모든 시간대에 걸쳐 부드럽고 정확한 강도선. 추세와 정확한 진입을 식별하는 데 이상적입니다. 역동적인 시장 피보나치 수준(시장 피보나치).  이 지표에만 있는 고유한 기능. 가격 차트가 아닌 통화 강도에 피보나치가 적용됩니다.
M1 Arrow
Oleg Rodin
5 (17)
시장의 두 가지 기본 원칙에 기반한 일중 전략. 알고리즘은 추가 필터를 사용하여 거래량 및 가격 파동 분석을 기반으로 합니다. 지표의 지능형 알고리즘은 두 가지 시장 요인이 하나로 결합될 때만 신호를 제공합니다. 지표는 더 높은 시간 프레임의 데이터를 사용하여 M1 차트에서 특정 범위의 파도를 계산합니다. 그리고 파동을 확인하기 위해 지표는 볼륨 분석을 사용합니다. 이 표시기는 준비된 거래 시스템입니다. 트레이더가 필요로 하는 모든 것은 신호를 따르는 것입니다. 또한 지표는 자신의 거래 시스템의 기초가 될 수 있습니다. 거래는 분 차트에서만 수행됩니다. 지표가 MTF 원리를 사용한다는 사실에도 불구하고 지표 알고리즘은 가능한 한 안정적입니다. 구매 후 반드시 저에게 편지를 보내주세요! 내 거래 설정 및 권장 사항을 공유하겠습니다!
Trend Screener
STE S.S.COMPANY
4.78 (93)
트렌드 표시기, 트렌드 트레이딩 및 필터링을 위한 획기적인 고유 솔루션, 하나의 도구 안에 내장된 모든 중요한 트렌드 기능! Forex, 상품, 암호 화폐, 지수 및 주식과 같은 모든 기호/도구에 사용할 수 있는 100% 다시 칠하지 않는 다중 시간 프레임 및 다중 통화 표시기입니다. 기간 한정 특가: 지원 및 저항 스크리너 지표는 단 100달러에 평생 제공됩니다. (원래 가격 50 달러) (제안 연장) Trend Screener는 차트에 점이 있는 화살표 추세 신호를 제공하는 효율적인 지표 추세 추종 지표입니다. 추세 분석기 표시기에서 사용할 수 있는 기능: 1. 트렌드 스캐너. 2. 최대 이익 분석이 있는 추세선. 3. 추세 통화 강도 측정기. 4. 경고가 있는 추세 반전 점. 5. 경고가 있는 강력한 추세 점. 6. 추세 화살표 Trend Screener Indicator가 있는 일일 분석 예, 일일 신호 성능...등은 여기에서 찾을 수 있습니다.   여기를 클릭하십시오. L
Algo Pumping MT4
Ihor Otkydach
5 (5)
PUMPING STATION – 당신만을 위한 올인원(All-in-One) 전략 PUMPING STATION은 당신의 외환 거래를 더욱 흥미롭고 효과적으로 바꿔줄 혁신적인 인디케이터입니다. 단순한 보조 도구가 아니라, 강력한 알고리즘을 갖춘 완전한 거래 시스템으로서 보다 안정적인 트레이딩을 시작할 수 있도록 도와줍니다. 이 제품을 구매하시면 다음의 혜택을   무료로   받으실 수 있습니다: 전용 설정 파일: 자동 설정으로 최대의 퍼포먼스를 제공합니다. 단계별 동영상 가이드: PUMPING STATION 전략으로 거래하는 법을 배워보세요. Pumping Utility: PUMPING STATION과 함께 사용하도록 설계된 반자동 거래 봇으로, 거래를 더욱 쉽고 편리하게 만들어줍니다. ※ 구매 후 바로 저에게 메시지를 보내주세요. 추가 자료에 대한 접근 권한을 제공해드립니다. PUMPING STATION은 어떻게 작동하나요? 트렌드 컨트롤: 시장의 추세 방향을 즉시 파악합니다. 추세는
Enigmera
Ivan Stefanov
5 (7)
ENIGMERA: 시장의 핵심 중요: MQL5.com의 데모는 Strategy Tester에서 실행되며 Enigmera의 기능을 완전히 반영하지 못할 수 있습니다. 설명, 스크린샷 및 비디오를 확인하여 자세한 내용을 확인하십시오. 질문이 있으면 언제든지 메시지를 보내주세요! 인디케이터의 코드는 완전히 다시 작성되었습니다. 버전 3.0은 새로운 기능을 추가하고 인디케이터가 처음 출시된 이후 누적된 버그를 수정했습니다. 소개 이 인디케이터 및 거래 시스템은 금융 시장에 대한 주목할 만한 접근 방식입니다. ENIGMERA는 프랙탈 주기를 사용하여 정확하게 지원 및 저항 수준을 계산합니다. 실제 축적 단계를 보여주고 방향과 목표를 제공합니다. 트렌드와 수정 모두에서 작동하는 시스템입니다. 작동 방식 인디케이터의 대부분의 기능은 차트 왼쪽에 있는 버튼을 통해 제어되며, 이를 통해 다양한 시장 상황에 빠르게 대응할 수 있습니다. 버튼 ON/OFF – 인디케이터 전체를 표시하거나 숨깁니다.
Easy Breakout
Mohamed Hassan
5 (11)
After your purchase, feel free to contact me for more details on how to receive a bonus indicator called VFI, which pairs perfectly with Easy Breakout for enhanced confluence!   Easy Breakout is a powerful price action trading system built on one of the most popular and widely trusted strategies among traders: the Breakout strategy ! This indicator delivers crystal-clear Buy and Sell signals based on breakouts from key support and resistance zones. Unlike typical breakout indicators, it levera
IX Power MT4
Daniel Stein
4.78 (9)
IX Power: 지수, 원자재, 암호화폐 및 외환 시장 통찰력을 발견하세요 개요 IX Power 는 지수, 원자재, 암호화폐 및 외환 시장의 강도를 분석할 수 있는 다목적 도구입니다. FX Power 는 모든 가용 통화 쌍 데이터를 사용하여 외환 쌍에 대해 가장 높은 정확도를 제공하는 반면, IX Power 는 기초 자산 시장 데이터에만 초점을 맞춥니다. 이로 인해 IX Power 는 비외환 시장에 이상적이며, 다중 쌍 분석이 필요하지 않은 간단한 외환 분석에도 신뢰할 수 있는 도구입니다. 모든 차트에서 매끄럽게 작동하며, 거래 결정을 향상시키기 위한 명확하고 실행 가능한 통찰력을 제공합니다. 1. IX Power가 트레이더에게 유용한 이유 다양한 시장 강도 분석 • IX Power 는 지수, 원자재, 암호화폐 및 외환 심볼의 강도를 계산하여 각 시장에 맞는 통찰력을 제공합니다. • US30, WTI, 금, 비트코인 또는 통화 쌍과 같은 자산을 모니터링하여 거래 기회를 발견
Stratos Pali
Michela Russo
5 (2)
Stratos Pali Indicator   is a revolutionary tool designed to enhance your trading strategy by accurately identifying market trends. This sophisticated indicator uses a unique algorithm to generate a complete histogram, which records when the trend is Long or Short. When a trend reversal occurs, an arrow appears, indicating the new direction of the trend. Important Information Revealed Leave a review and contact me via mql5 message to receive My Top 5 set files for Stratos Pali at no cost! Dow
FX Power MT4 NG
Daniel Stein
4.94 (18)
FX Power: 통화 강세 분석으로 더 스마트한 거래 결정을 개요 FX Power 는 어떤 시장 상황에서도 주요 통화와 금의 실제 강세를 이해하기 위한 필수 도구입니다. 강한 통화를 매수하고 약한 통화를 매도함으로써 FX Power 는 거래 결정을 단순화하고 높은 확률의 기회를 발견합니다. 트렌드를 따르거나 극단적인 델타 값을 사용해 반전을 예측하고자 한다면, 이 도구는 귀하의 거래 스타일에 완벽히 적응합니다. 단순히 거래하지 말고, FX Power 로 더 스마트하게 거래하세요. 1. FX Power가 거래자에게 매우 유용한 이유 통화와 금의 실시간 강세 분석 • FX Power 는 주요 통화와 금의 상대적 강세를 계산하고 표시하여 시장 역학에 대한 명확한 통찰력을 제공합니다. • 어떤 자산이 앞서고 있고 어떤 자산이 뒤처지는지 모니터링하여 보다 현명한 거래 결정을 내릴 수 있습니다. 포괄적인 멀티 타임프레임 뷰 • 단기, 중기 및 장기 타임프레임에서 통화와 금의 강세를
TPSproTREND PrO
Roman Podpora
4.68 (25)
VERSION MT5        —        ИНСТРУКЦИЯ RUS           —        INSTRUCTIONS  ENG 주요 기능: 렌더링 없이 정확한 입력 신호! 신호가 나타나면 관련성은 유지됩니다! 이는 신호를 제공한 후 변경하여 예금 자금 손실을 초래할 수 있는 다시 그리기 지표와의 중요한 차이점입니다. 이제 더 큰 확률과 정확도로 시장에 진입할 수 있습니다. 화살표가 나타난 후 목표에 도달(이익실현)하거나 반전 신호가 나타날 때까지 캔들을 색칠하는 기능도 있습니다. STOP LOSS / TAKE PROFIT 구역 표시 진입점 검색 시 시각적 명확성을 높이기 위해 시장 진입을 위한 최적 지점이 검색되는 BUY/SELL 영역을 초기에 표시하는 모듈을 만들었습니다. 정지 손실 수준 작업을 위한 추가 지능형 논리는 시간이 지남에 따라 크기를 줄이는 데 도움이 되므로 거래에 들어갈 때 초기 위험을 줄이는 데 도움이 됩니다(move sl). 더 높은 기간의 MI
RelicusRoad Pro
Relicus LLC
4.63 (104)
이제 $ 147 (몇 가지 업데이트 후 $ 499 증가) - 무제한 계정 (PCS 또는 MACS) RelicusRoad 사용 설명서 + 교육 비디오 + 비공개 Discord 그룹 액세스 + VIP 상태 시장을 보는 새로운 방법 RelicusRoad는 외환, 선물, 암호화폐, 주식 및 지수에 대한 세계에서 가장 강력한 거래 지표로서 거래자에게 수익성을 유지하는 데 필요한 모든 정보와 도구를 제공합니다. 우리는 초보자부터 고급까지 모든 거래자가 성공할 수 있도록 기술적 분석 및 거래 계획을 제공합니다. 미래 시장을 예측할 수 있는 충분한 정보를 제공하는 핵심 거래 지표입니다. 우리는 차트에서 말이 안 되는 여러 지표 대신 완전한 솔루션을 믿습니다. 타의 추종을 불허하는 매우 정확한 신호, 화살표 + 가격 조치 정보를 표시하는 올인원 표시기입니다. 강력한 AI를 기반으로 하는 RelicusRoad는 누락된 정보와 도구를 제공하여 교육하고 성공적인 트레이더인 트레이딩 전문가가 되도
Scalper Vault
Oleg Rodin
5 (29)
Scalper Vault 는 성공적인 스캘핑에 필요한 모든 것을 제공하는 전문 스캘핑 시스템입니다. 이 표시기는 외환 및 바이너리 옵션 거래자가 사용할 수 있는 완전한 거래 시스템입니다. 권장 시간 프레임은 M5입니다. 시스템은 추세 방향으로 정확한 화살표 신호를 제공합니다. 또한 상단 및 하단 신호와 Gann 시장 수준을 제공합니다.  이 시스템은 사용하기가 매우 쉽습니다. 원하는 시장 지역의 화살표만 따라가면 됩니다. 엑시트는 가격이 적정 수준에 도달하거나 시장의 고점 또는 저점 신호가 나타날 때 수행됩니다.  표시기는 PUSH 알림을 포함한 모든 유형의 경고를 제공합니다. 인디케이터 구매 후 연락주세요. 내 개인 거래 권장 사항과 훌륭한 보너스 지표를 무료로 공유합니다! 나는 당신에게 행복하고 유익한 거래를 기원합니다!
Chart Patterns All in One
Davit Beridze
4.68 (19)
"Chart Patterns All in One"을 데모 모드에서 사용해보고 보너스를 받아보세요. 데모 모드에서 사용해본 후 메시지를 보내주시면 보너스를 드립니다. 구매 후 댓글을 남기시면 고품질의 인디케이터 8개를 보너스로 받으실 수 있습니다. Chart Patterns All-in-One 지표는 트레이더가 기술 분석에서 흔히 사용되는 다양한 차트 패턴을 시각화하는 데 도움을 줍니다. 이 지표는 잠재적인 시장 움직임을 식별하는 데 도움이 되지만, 수익성을 보장하지는 않습니다. 구매 전에 데모 모드에서 지표를 테스트하는 것이 좋습니다. 현재 할인 : "Chart Patterns All in One" 지표 50% 할인 중. 포함된 패턴 : 1-2-3 패턴 : 세 가지 주요 지점(고점 또는 저점)을 사용하여 시장 반전을 감지합니다. 매수 : 연속된 두 저점 이후, 이전 고점보다 낮은 고점이 발생할 때. 매도 : 연속된 두 고점 이후, 이전 저점보다 높은 저점이 발생할 때. 시각화 :
Volatility Trend System - a trading system that gives signals for entries. The volatility system gives linear and point signals in the direction of the trend, as well as signals to exit it, without redrawing and delays. The trend indicator monitors the direction of the medium-term trend, shows the direction and its change. The signal indicator is based on changes in volatility and shows market entries. The indicator is equipped with several types of alerts. Can be applied to various trading ins
KT Renko Patterns MT4
KEENBASE SOFTWARE SOLUTIONS
2.33 (3)
KT Renko Patterns는 렌코 차트를 벽돌 하나하나 분석하여, 전 세계 다양한 금융 시장에서 트레이더들이 자주 사용하는 유명한 차트 패턴들을 찾아냅니다. 시간 기반 차트와 비교하면, 렌코 차트는 시각적으로 단순하고 깔끔하여 패턴 중심의 트레이딩이 훨씬 쉽게 가능합니다. KT Renko Patterns에는 다양한 렌코 패턴이 포함되어 있으며, 이 중 상당수는 Prashant Shah의 저서 『Profitable Trading with Renko Charts』에서 자세히 설명되어 있습니다. KT Renko Patterns 인디케이터를 기반으로 한 100% 자동화된 EA는 여기에서 이용할 수 있습니다 - KT Renko Patterns EA . 기능 소개 최대 8개의 명확한 렌코 패턴을 거래할 수 있어, 혼동 없이 신뢰도 높은 트레이딩이 가능합니다. 객관성을 제공하기 위해 각 패턴에는 손절선과 피보나치 목표가 함께 제공됩니다. KT Renko Patterns는 각 패턴의 정
- Real price is 80$ - 40% Discount (It is 49$ now) - Lifetime update free Contact me for instruction, add group and any questions! Related Products:  Bitcoin Expert , Gold Expert - Non-repaint - I just sell my products in Elif Kaya profile, any other websites are stolen old versions, So no any new updates or support. Introduction The breakout and retest strategy is traded support and resistance levels. it involves price breaking through a previous level.  The break and retest strategy is design
MTF Supply Demand Zones
Georgios Kalomoiropoulos
4.82 (22)
자동화된 수요 및 공급 구역의 차세대. 모든 차트에서 작동하는 새롭고 혁신적인 알고리즘. 모든 구역은 시장의 가격 움직임에 따라 동적으로 생성됩니다. 두 가지 유형의 경고 --> 1)가격이 영역에 도달할 때 2)새로운 영역이 형성될 때 당신은 더 이상 쓸모없는 지표를 얻을 수 없습니다. 입증된 결과로 완벽한 거래 전략을 얻을 수 있습니다.     새로운 기능:     가격이 공급/수요 영역에 도달하면 경고     새로운 공급/수요 구역이 생성되면 알림     푸시 알림 알림     핍의 영역 너비 레이블     기동특무부대에 한 번 더 시간이 주어집니다. 따라서 현재보다 위의 2개의 시간 프레임 대신 현재보다 높은 3개의 시간 프레임을 볼 수 있습니다.     Alerts/Zones/MTF 기능을 활성화/비활성화하는 버튼 당신이 얻는 이점:     거래에서 감정을 제거하십시오.     거래 항목을 객관화하십시오.     높은 확률 설정을 사용하여 수익
Advanced Currency Strength28 Indicator
Bernhard Schweigert
4.9 (651)
현재 26% 할인 초보자 또는 전문가 트레이더를 위한 최고의 솔루션! 이 지표는 우리가 독점 기능과 새로운 공식을 통합했기 때문에 독특하고 고품질이며 저렴한 거래 도구입니다. 단 하나의 차트로 28 Forex 쌍의 통화 강도를 읽을 수 있습니다! 새로운 추세 또는 스캘핑 기회의 정확한 트리거 포인트를 정확히 찾아낼 수 있기 때문에 거래가 어떻게 개선될지 상상해 보십시오. 사용 설명서: 여기를 클릭  https://www.mql5.com/en/blogs/post/697384 그것이 첫 번째, 원본입니다! 쓸모없는 지망생 클론을 사지 마십시오. 더 스페셜  강력한 통화 모멘텀을 보여주는 하위 창의 화살표 GAP가 거래를 안내합니다! 기본 또는 호가 통화가 과매도/과매도 영역(외부 시장 피보나치 수준)에 있을 때 개별 차트의 기본 창에 경고 표시가 나타납니다. 통화 강도가 외부 범위에서 떨어질 때 풀백/반전 경고. 교차 패턴의 특별 경고 추세를 빠르게 볼 수 있는 다중 시간
캔들의 종가를 예측하는 지표입니다. 지표는 주로 D1 차트에서 사용하기 위한 것이. 이 지표는 전통적인 외환 거래와 바이너리 옵션 거래 모두에 적합합니다. 지표는 독립형 거래 시스템으로 사용하거나 기존 거래 시스템에 추가로 사용할 수 있습니다. 이 표시기는 현재 양초를 분석하여 양초 본체 내부의 특정 강도 요인과 이전 양초의 매개변수를 계산합니다. 따라서 지표는 시장 움직임의 추가 방향과 현재 양초의 종가를 예측합니다. 이 방법 덕분에 지표는 단기 및 중장기 거래 모두에 적합합니다. 지표를 사용하면 시장 상황을 분석하는 동안 지표가 생성할 잠재적 신호의 수를 설정할 수 있습니다. 표시기 설정에는 이를 위한 특별한 매개변수가 있습니다. 또한 인디케이터는 새로운 신호에 대해 차트의 메시지 형태, 이메일 및 PUSH 알림 형태로 알릴 수 있습니다. 구매 후 저에게 꼭 써주세요! 나는 당신에게 지표와 거래에 대한 나의 추천을 줄 것입니다! 또한 보너스를 받으세요!
FX Volume
Daniel Stein
4.6 (35)
FX Volume: 브로커 시각에서 바라보는 진짜 시장 심리 간단 요약 트레이딩 접근 방식을 한층 더 향상시키고 싶으신가요? FX Volume 는 소매 트레이더와 브로커의 포지션을 실시간으로 파악할 수 있게 해 줍니다. 이는 COT 같은 지연된 보고서보다 훨씬 빠릅니다. 꾸준한 수익을 추구하는 분이든, 시장에서 더 깊은 우위를 원하시는 분이든, FX Volume 을 통해 대규모 불균형을 찾아내고, 돌파 여부를 확인하며 리스크 관리를 정교화할 수 있습니다. 지금 시작해 보세요! 실제 거래량 데이터가 의사결정을 어떻게 혁신할 수 있는지 직접 경험해 보시기 바랍니다. 1. 트레이더에게 FX Volume이 매우 유익한 이유 탁월한 정확도를 지닌 조기 경보 신호 • 다른 사람들보다 훨씬 앞서, 각 통화쌍을 매수·매도하는 트레이더 수를 거의 실시간으로 파악할 수 있습니다. • FX Volume 은 여러 리테일 브로커에서 추출한 실제 거래량 데이터를 종합해 명확하고 편리한 형태로 제공하는
FX Dynamic: 맞춤형 ATR 분석으로 변동성과 트렌드를 파악하세요 개요 FX Dynamic 는 Average True Range(ATR) 계산을 활용하여 트레이더에게 일간 및 일중 변동성에 대한 뛰어난 인사이트를 제공하는 강력한 도구입니다. 80%, 100%, 130%와 같은 명확한 변동성 임계값을 설정함으로써 시장이 평소 범위를 초과할 때 빠르게 경고를 받고, 유망한 수익 기회를 재빨리 식별할 수 있습니다. FX Dynamic 는 브로커의 시간대를 인식하거나 수동으로 조정할 수 있으며, 변동성 측정 기준을 일관되게 유지하며, MetaTrader 플랫폼과 완벽하게 연동되어 실시간 분석을 지원합니다. 1. FX Dynamic이 트레이더에게 매우 유용한 이유 실시간 ATR 인사이트 • 하루 및 일중 변동성을 한눈에 모니터링하세요. ATR의 80%, 100%, 130% 임계값이 도달 또는 초과되면, 시장의 중요한 지점에 있음을 알 수 있습니다. • 변동성이 완전히 폭발하기
Currency Strength Exotics
Bernhard Schweigert
4.87 (31)
현재 20% 할인! 초보자 또는 전문가 트레이더를 위한 최고의 솔루션! 이 표시기는 Exotic Pairs Commodities, Indexes 또는 Futures와 같은 기호에 대한 통화 강도를 표시하는 데 특화되어 있습니다. 금, 은, 석유, DAX, US30, MXN, TRY, CNH 등의 진정한 통화 강도를 보여주기 위해 9번째 줄에 모든 기호를 추가할 수 있습니다. 이것은 독특하고 고품질이며 저렴한 거래 도구입니다. 우리는 많은 독점 기능과 새로운 공식을 통합했습니다. 새로운 추세 또는 스캘핑 기회의 정확한 트리거 포인트를 정확히 찾아낼 수 있기 때문에 거래가 어떻게 개선될지 상상해 보십시오. 사용 설명서: 여기를 클릭 https://www.mql5.com/en/blogs/post/708876 모든 시간대에 작동합니다. TREND를 빠르게 확인할 수 있습니다! 새로운 기본 알고리즘을 기반으로 설계되어 잠재적인 거래를 더욱 쉽게 식별하고 확인할 수 있습니다. 8개의
Advanced Supply Demand
Bernhard Schweigert
4.91 (294)
현재 33% 할인! 초보자나 전문 트레이더를 위한 최고의 솔루션! 이 보조지표는 우리가 다수의 독창적 기능과 새로운 공식을 통합한 독특하고 고품질이며 저렴한 거래 도구입니다. 이 업데이트를 통해 이중 시간대를 표시할 수 있습니다. 더 높은 TF를 표시할 수 있을 뿐만 아니라 차트 TF와 더 높은 TF 모두를 표시할 수 있습니다: 중첩 영역 표시. 모든 Supply Demand 트레이더들이 좋아할 것입니다. :) 중요한 정보 공개 Advanced Supply Demand의 잠재력을 극대화하려면 다음을 방문하십시오. https://www.mql5.com/ko/blogs/post/720245   진입 또는 목표의 명확한 트리거 포인트를 정확히 찾아냄으로 해서 거래가 어떻게 개선될지 상상해 보십시오. 새로운 알고리즘을 기반으로 매수자와 매도자 간의 잠재적인 불균형을 훨씬 더 쉽게 분간할 수 있습니다. 왜냐하면 가장 강한 공급영역과 가장 강한 수요 영역과 과거에 어떻게 진행 되었는지를(이전
제작자의 제품 더 보기
ForexTrendMT4
Andriy Sydoruk
5 (1)
ForexTrendMT4 Indicator: A Reliable Tool for Market Tracking The ForexTrendMT4 indicator offers reliable market trend tracking, filtering out sudden fluctuations and market noise. This tool helps identify trends and signals favorable entry points into the market using arrows. It is suitable for both scalping on shorter timeframes and long-term trading strategies. Based on the principles of technical analysis, ForexTrendMT4 takes into account the cyclical nature of the market. Key Features and A
Agile
Andriy Sydoruk
This is a professional Expert Advisor, which implements the strategy of trading using the Divergents and DivergentsPoint indicators, as wells as filters of the global trend on higher periods. Analyzing the indicators, the system enters the market with a limited martingale and the ability to open up to 8 orders in one direction. Each series of orders has mandatory TakeProfit and StopLoss levels. Also, a trailing stop based on the SAR indicator is activated for a series in breakeven. The robot aut
Divergents
Andriy Sydoruk
Indicator of divergences. It can help you identify the flat and trend areas. It can be applied as a trading filter. It has only one parameter - Period . The indicator does not show entry points, but only visualizes the information. Keep in mind that the approach to trading should be comprehensive, additional information is required for entering the market. Parameters Period - period of the indicator.
DivergentsPoint
Andriy Sydoruk
Trend indicator based on the price divergence. It can help you in finding the entry points during the analysis. It can be applied as a trading filter. It has two parameters: Period and Level . The Level parameter allows filtering out unnecessary signals. For example, the Level parameter can be set to 0.0001 for EURUSD. The indicator can work both as an entry point generator and as a filter. The indicator clearly visualizes the information. Keep in mind that the approach to trading should be comp
Carousel
Andriy Sydoruk
Carousel expert system compensates drawdowns. The main indicator is Divergents . The EA allows working in one direction (for example, sell order series), while another direction (for example, buy order series) is in drawdown (compensation mode). If series in both directions operate in normal mode, the system does not switch to compensation mode. If a drawdown is detected in one of the directions, the EA goes into the compensation mode and starts compensating the loss-making series by the profita
Versatile
Andriy Sydoruk
Versatile expert system follows the principle "stay in the market for as long as possible". The main indicators are Moving Average and Relative Strength Index. The EA supports working in two directions simultaneously both following a trend and against it depending on the settings. A limited number of orders LimitOrders is used for operation. The EA correctly handles errors and reliably works with a deposit 1000 USD and higher. M5 and higher timeframes are supported. The EA has very flexible sett
IdeaClassic
Andriy Sydoruk
Экспертная система IdeaClassic создана для спокойной торговли на рынке. Основная ее задача - работа с одни ордером без увеличения лота с обязательными стопами, причем стоп-лосс и тейк-профит должны быть одного порядка. Также есть возможность использовать трейлинг-стоп. Для формирования входного сигнала используется индикатор IdeaTrend . Для анализа данного индикатора используется функция, которая может анализировать данные индикатора комплексно. Анализируется до десяти последних сигналов от инди
IdeaIlan
Andriy Sydoruk
5 (1)
IdeaIlan expert system applies IdeaTrend indicator. The EA applies the martingale principle. The EA allows trading in two directions simultaneously. It also has a full set of tools allowing the EA to follow a trend and add to a position if the trend moves in unfavorable direction. The EA correctly handles errors and reliably works with a deposit of 10 000 USD and higher. M5 and higher timeframes are supported. Stop levels and trailing stop are applied. Parameters Magic - magic number; Requotes
PowerFlash
Andriy Sydoruk
PowerFlash - Советник реализует известную торговую стратегию на основе сетки. Это автоматическая торговая система. Вся работа автоматизирована. Бот использует минимум настроек.  Бот работает следующим образом. Выставляется, одновременно, сетка отложенных ордеров в обе стороны от текущей цены на дистанции, указанной пользователем. Размер сетки регулируется от 1 до 100. После чего, куда бы ни пошел рынок, отложенные ордера будут переходить в рыночные. Если рыночные ордера зайдут в общий профит, то
SpatialJump
Andriy Sydoruk
A unique expert system that works as without optimization, with the same settings (although it can be optimized if desired, especially for some brokers). You can test as you like, all ticks, control points, opening prices. The figure has an example. The potential result when testing an average of 100-500% over 3 years. It is recommended to make a multi-currency, if you choose a balanced combination, you can get results up to 500-1000% per annum with potential testing. Verified by EURUSD. The bot
Prophet
Andriy Sydoruk
Prophet is a trend indicator. Shows the direction of turning points. Can be used with an optimal risk-to-profit ratio. The arrows indicate favorable moments and directions for entering the market. Uses one parameter for setting (adjust from 1 to 3). The probability of a successful trend is very high. In the course of work, the take-profit is much larger than the stop-loss! Works on all currency pairs and on all timeframes.
Trendes
Andriy Sydoruk
The Trendes indicator works on all currency pairs and on all timeframes. The arrows indicate favorable moments and directions for entering the market. The probability of a successful trend is very high. Trendes can be used for both small pits and long-term trading. The indicator determines the entry points according to the methods described in the book "How to play and win on the stock exchange". Options LengthA  - The number of bars for calculating the first function; LengthB - The number of b
Martingal
Andriy Sydoruk
The indicator Martingal works on all currency pairs and on all timeframes. The arrows indicate the optimal input points for the future Martingale averaging, even with a zero exponent. The indicator shows the signal to close the series only if all the previous signals can be closed in the profit. After closing the series in profit, you must immediately open the order in the direction of the signal. Thus, the signal for closing is simultaneously the point of reverse opening to the other side of th
Spin
Andriy Sydoruk
If you do not yet have your trading strategy, you can take advantage of our ready-made trading strategy, which is most effective! The trend indicator Spin is created on the basis of price divergence. Will help in finding the entry points for analysis. Can be used as a filter in the trade. Has one Length parameter. The indicator can work for both entry points and filters. The indicator reflects information in a visual form. Do not forget that the approach to trading should be comprehensive, to en
Variator
Andriy Sydoruk
Intelligent algorithm indicator Variator with accuracy generates input signals and output levels. If the average price is blue, you should look for entry points to open long positions when the market is not overbought, and if the average price is red, you should look for entry points to open short positions when the market is not oversold. The rules can be summarized as follows. You should buy during an uptrend when the price reaches the average or oversold, and sell during a downtrend when the
Prognosticator
Andriy Sydoruk
This indicator shows not just a line of the price balance, but also forecasts it for the specified number of bars ahead. That is, the level of the probable balance of the price reflects on the chart in the future. The level of balancing is set by the Balance parameter, that is, it can be drawn at any level. Forecasting the future with the Shift parameter. The indicator reflects information in a visual form. Do not forget that the approach to trading should be comprehensive, to enter the market r
Tic Tac Toe
Andriy Sydoruk
The algorithm of the Tic Tac Toe indicator differs from the usual indicators on the price charts in that it completely ignores the flow of time and reflects only changes in the price. Instead of displaying the time intervals on the X axis, and the price value on the Y axis, the Tic Tac Toe indicator displays price changes on both axes. The indicator displays in red if prices rise by a certain base value (TicTacToe) and blue if prices fall on the same value. If prices fell / rose by less than a c
FiboZag
Andriy Sydoruk
Indicator FiboZag - transfer the indicator to the chart and the Fibonacci levels will be built automatically on the last ZigZag turn. The main advantage lies in the correct construction of Fibonacci levels and markup of price levels. Simple, visual and effective use. The indicator is not redrawn and does not lag. Works on all currency pairs and on all timeframes.
TrendCloud
Andriy Sydoruk
Realization of trend movement indication with points for potential stops in the TrendCloud indicator. It can be easily used as an independent trading system. You can interpret this: the location of the course above or below the shadows show the presence of a trend. The transition to the shadow warns of a possible reversal. Entering the price inside the shadow speaks in a flat motion. The indicator tracks the market trend with unsurpassed reliability, ignoring sharp market fluctuations and noises
VictoryCPM
Andriy Sydoruk
The VictoryCPM (Currency Power Meter) indicator will show the strength of currency pairs. The indicator is created for those traders who prefer to trade several currency pairs at once. This tool is able to display on the trading chart data on the current strength of various currencies. The foreign exchange market has a dynamic structure, which is why different currencies affect each other. For this reason, in order to identify the optimal point for creating an order, it is necessary to familiari
Progressive
Andriy Sydoruk
The  Progressive  Expert System works using sharp tick movements. Works with a deposit of $ 100! The classic method of trading scalping. It is also worth noting that with the allowable spread level, the bot goes through any historical period on any currency pair. There is no point in testing at opening prices, either checkpoints or all tics. It is possible to work on accounts with a floating spread, entry into the market will occur only when the spread is lower than the level specified in the se
Element33
Andriy Sydoruk
Экспертная система Element33 работает, на любых типах счетов. Работает как в 4-х так и с 5-значными котировками. Спрэд и реквоты не критичны, подойдет любой брокер. Экспертная система разбивает историю на 4 квартала, для оптимизации рекомендовано три года на периоде H1 или H4. Оптимизацию можно проводить по ценах открытия, результаты мало отличаются от тестирования по реальным тикам, поскольку бот работает по ценам открытия. Оптимизировать достаточно один раз в месяц! Для получения более хороших
FiboPoint
Andriy Sydoruk
A trend indicator that shows the direction of pivot points. It can be used with an optimal risk to reward ratio. The probability of a success trend is very high. The indicator uses arrows to show favorable time to enter the market and market entry directions. Uses only one adjustable parameter (a value from 1 to 3). Take profit is much larger than stop loss! The indicator works on all currency pairs and time frames.
WiseBW
Andriy Sydoruk
The  WiseBW  indicator simplifies decision making by recognizing turns using the built-in algorithm, and then confirms signals at support / resistance levels. Thus, the indicator tracks the market trend with unsurpassed reliability, ignoring sharp market fluctuations and noise around the average price. The indicator can be used both for pipsing at small periods, and for long-term trading. Options: updown  - offset pips for indentation of icons; back  - how many bars to take into account; CountBa
TrendCross
Andriy Sydoruk
The indicator bounds the price according to a cyclic wave dependency using moving averages. Thus, all the crossing points, in which the movement is changed considering the indicator period, are the optimal ones. The crossing points can be used as the potential market reversal points. However, do not forget about the complex approach: the indicator signals require additional data to enter the market.
ComplexPulse
Andriy Sydoruk
ComplexPulse - pulse indicator or signal. Sensitive and responsive to price movements. The indicator shows the interdependence of various currency pairs, namely: USD, EUR, GBP, CHF, JPY. Currencies are measured in relative units, so in each unit of time the sum of all currencies will be equal to zero. Hence, one of the main elements of cluster indicators is the zero line, or the balance line (zero line). If a currency is below the balance line, then it is said that the currency is oversold rela
RegressionXP
Andriy Sydoruk
Индикатор RegressionXP рассчитывает два типа регрессии и вычисляет среднеквадратичную девиацию цены на данном диапазоне. Важна прямая золотая линия (регрессия первой степени), показывающая направление и состояние текущего тренда на выбранном таймфрейме. Чем больше угол с горизонталью, тем сильнее тренд. Таким образом, мы имеем возможность делать выводы относительно состояния валютной пары по текущему расположению цены относительно линии регрессии. На расстоянии от золотой линии проходят параллел
TrendLSMA
Andriy Sydoruk
5 (1)
The TrendLSMA indicator is very reliable because it is based on moving averages. The TrendLSMA feature is the presence of a signal for entry / exit - the indicator line indicates in a certain color the signals "buy" or "sell". The accuracy of this signal is very high, 95% success rate for 5% failures. TrendLSMA is also suitable for exiting a position. The indicator almost completely captures the trend, but during flat it is necessary to use filters. When entering a position, you will always work
DivergenceMRDM
Andriy Sydoruk
Индикатор DivergenceMRDM  ситуацию, когда направление движения цены и технических индикаторов не совпадает. Что можно воспринимать как точки для входа в рынок, точки потенциального разворота рынка. Чаще всего проявляется сигнал при достижении индикатором зоны перекупленности или перепроданности. Один из четырех индикаторов: MACD , RSI , ADX , Momentum . Готовая торговая система. Индикатор не перерисовывается и не запаздывает 95% сделок прибыльные. Работает на всех валютных парах и на всех таймфр
Losser
Andriy Sydoruk
Losser is one of the implementations of the indicator to protect the position from loss. Similar implementations exist, it is not a complicated algorithm. The principle is very simple, practical and effective - they are implemented in this indicator, which will help traders protect their deposit from loss. The indicator uses a series of moving averages, which, with a given Length step, form the resulting lines that are displayed on the price chart as blue and red lines. These lines are the level
필터:
리뷰 없음
리뷰 답변