Advanced ZigZag with Fibo TL and Swing info MQL4
- 지표
- Petr Nosek
- 버전: 1.0
- 활성화: 5
Description
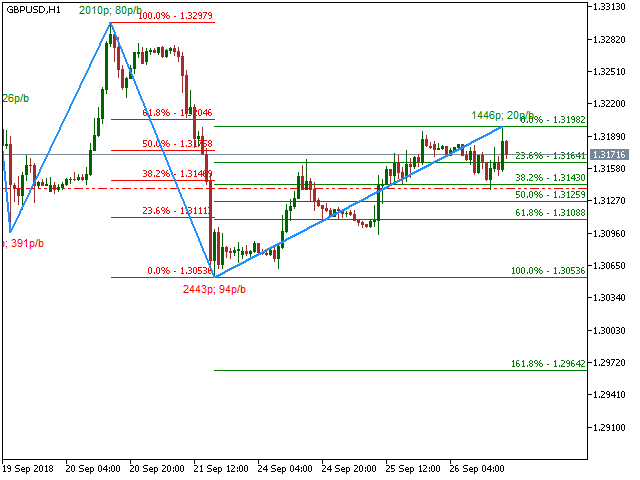
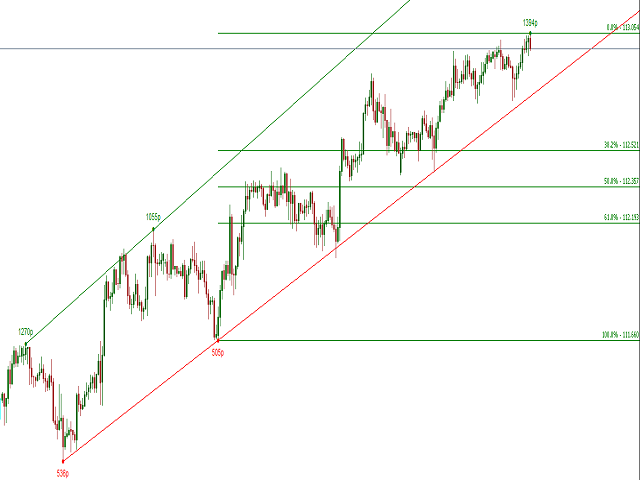
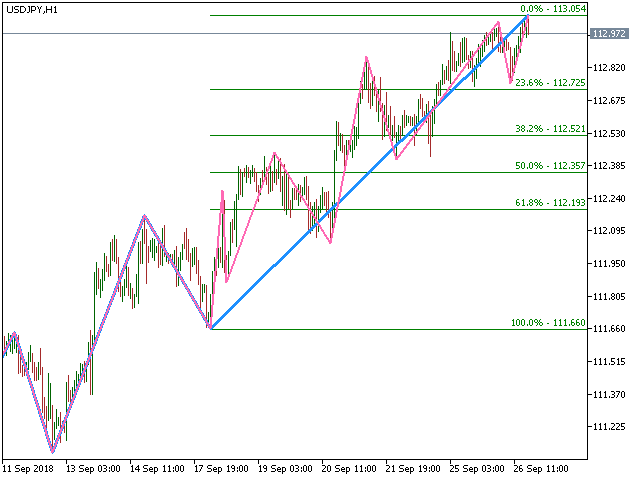
The base of this indicator is an ZigZag algorithm based on ATR and Fibo retracement. The ZigZag can be drawn like a classic ZigZag or like Arrows or needn't be drawn at all. This indicator is not redrawing in sense that the ZigZag's last shoulder is formed right after the appropriate conditions occur on the market. The shoulder doesn't change its direction afterwards (can only continue). There are some other possibilities to show advanced information in this indicator:
- Auto Fibo on the last and/or previous swing
- Trend lines (0-3 pairs) which connect swing highs / swing lows
- Information about swing size in points and bars and swing "slope" above high swings/under low swings
- Level where the ZigZag will turn a direction
- Levels (price labels) where the ZigZag began a new direction. Note: They can't be drawn backwards and they can appear only if a new direction change happens. If backward analysis is needed a visual tester supposed to be used.
The indicator can alert on a ZigZag direction change (trend change) by notification, e-mail, alert and sound playing.
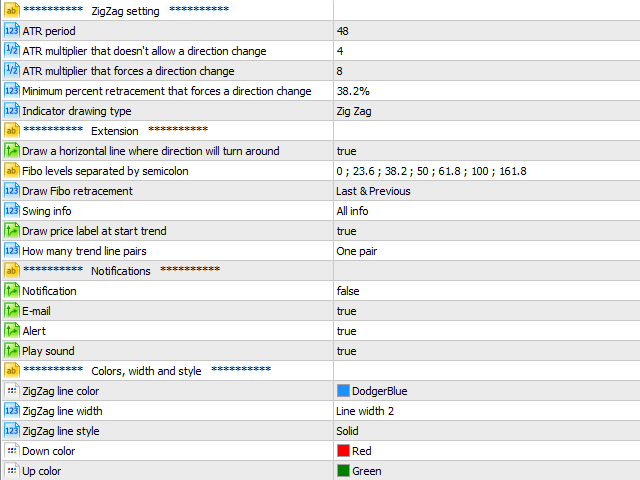
Indicator input parameters
For the ZigZag visualization these three inputs are crucial. They allow to change the sensitivity of the ZigZag.
- ATR multiplier that doesn't allow a direction change
- ATR multiplier that forces a direction change
- Minimum percent retracement that forces a direction change


it would be a 5 star for my strategy
if it has horizantal lines at the top of zigzag swing high and bottom of swing low based on confirmed fractals.
and if the default zigzag setting 12, 5 & 3 are changeable.