Daily Average Retracement Dashboard PRO
- 지표
- Ruen Fei Chong
- 버전: 1.0
- 활성화: 5
Daily Average Retracement Dashboard is an indicator that allows you to monitor multiple currency pairs at one time. This indicator is mainly for strategies that trade price retracement based on Resistance 3/4 or Support 3/4.
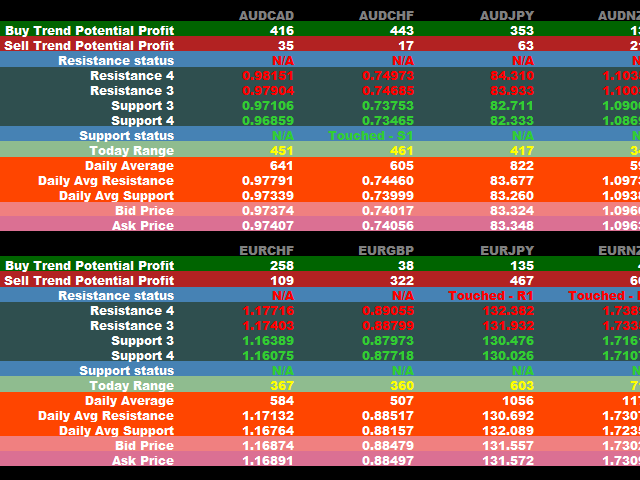
After applying this indicator to the chart window, it will hide the chart and display the currency pairs in a table form. There are several data shown on the table that will help trader know when to analyze the currency and do trade using retracement.
The indicator will show 28 major currency pairs.
How to install
- Open an empty chart. E.g. EURUSD
- Click "Show all" in the "Market watch"
- Drop the indicator onto the chart and click OK
Input parameters
N/A
Signal to trade retracement using this indicator
- Today range >= Daily average (Currency label in the indicator will show GREEN color if this condition is met).
- Price hit Daily average resistance/Daily average support.
- Price hit Resistance 3/4 or Support 3/4 (Resistance status/Support status will indicate if price hit).
If all 3 condition above hit, the quickest way to navigate to your chart is click on the Currency label in the table. New chart window with M5 timeframe will be open. Use M5 Stochastic or RSI and Candle stick pattern to find your entry point.
Remember you are looking for retracement.
Data shown in the table
**NOTE: The values are calculated based on 5-digits system. Points show in the indicator will be pipette.**
- Buy Trend Potential Profit: This value will show how far is the current price to today's High.
- Sell Trend Potential Profit: This value will show how far is the current price to today's Low.
- Resistance Status: This value will indicate if the price have touched R1/R2/R3/R4. E.g. Touched - R3.
- Resistance 4: This value will show today's Resistance 4. It is calculated based on Fibo 1.618.
- Resistance 3: This value will show today's Resistance 3. It is calculated based on Fibo 1.000.
- Support 3: This value will show today's Support 3. It is calculated based on Fibo 1.000.
- Support 4: This value will show today's Support 4. It is calculated based on Fibo 1.618.
- Support Status: This value will indicate if the price have touched S1/S2/S3/S4. E.g. Touched - S4.
- Today Range: This value will show how much pips has been moved today.
- Daily Average: This value will show today's average pips movement. It is calculated based on past 30 days High Low difference and average calculation has been done to get this value.
- Daily Average Resistance: This value will show today's average resistance price.
- Daily Average Support: This value will show today's average support price.
- Bid Price: This value will show current Bid price.
- Ask Price: This value will show current Ask price.
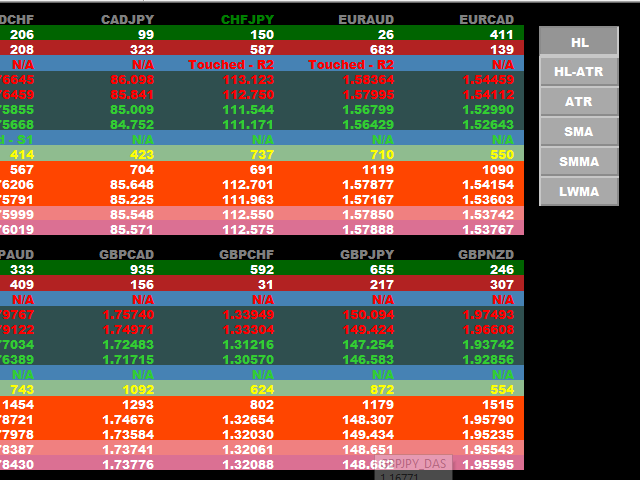
Buttons on the indicator
Daily average value will be calculated by different formula (30 days history)
- HL: Difference of High and Low
- HL-ATR: Max number between [High - Low], [fabs(Previous Close - Current High)], [fabs(Previous Close - Current Low)]
- ATR: Average True Range
- SMA: Simple Moving Average
- SMMA: Smoothed Moving Average
- LWMA: Linear Weighted Moving Average


