Synthetic full
- 지표
- Viktor Lubimov
- 버전: 2.2
- 업데이트됨: 22 7월 2020
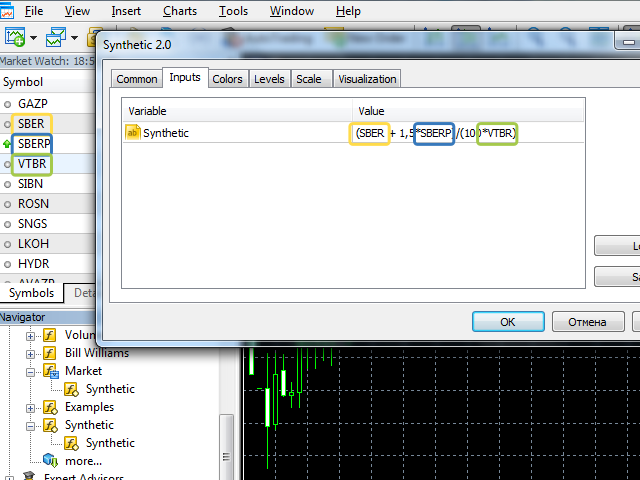
The indicator displays the chart of an arbitrary combination of trading instruments, described by the entered arithmetic formula.
Using the indicator.
- Add an indicator to any chart.
- Enter the formula as a string in the indicator's parameters. All symbols used in the formula must exactly match the names in the table "Market Overview" of the terminal. Example of the formula:
- Start the indicator
(SIBN + SNGS) / 'RTS-3.19' + 2.5 * GAZP / LKOH
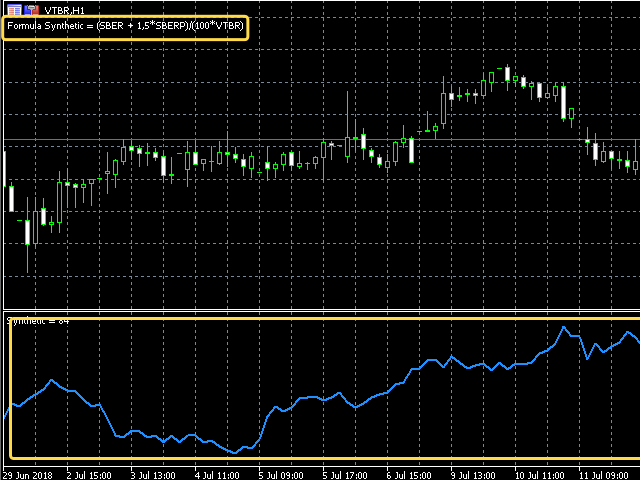
The formula must meet the following requirements:
- The names of the symbols must exactly match the names in the table "Market Overview" of the terminal.
- In the formula are allowed:
- arithmetic operations: '+', '-', '*', '/';
- numerical constants;
- brackets.
- The names of instruments containing arithmetic operations symbols (such as 'RTS-3.19') must be concluded in single quotes ('RTS-3.19').
- The spaces in the formula are ignored.
Индикатор присоединяется к графику. Но окно графика пустое. Поигрался с формулой в настройках. Если результат вычисления формулы в диапазоне до 1, то график индикатора появляется.