TPOChart2
- 지표
- Ahmad Yani
- 버전: 2.15
- 업데이트됨: 19 11월 2021
- 활성화: 10
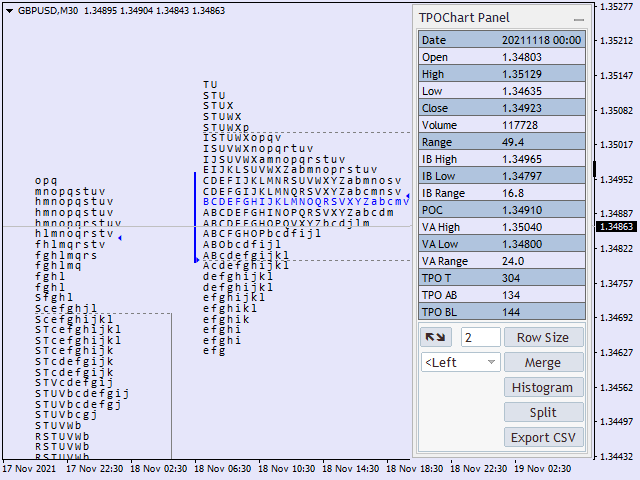
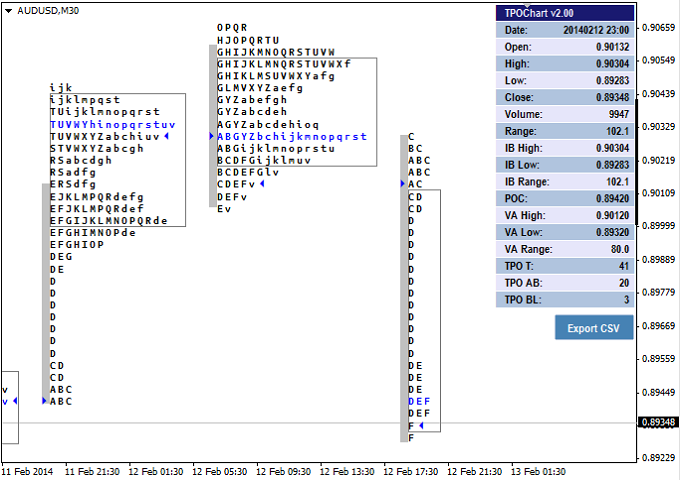
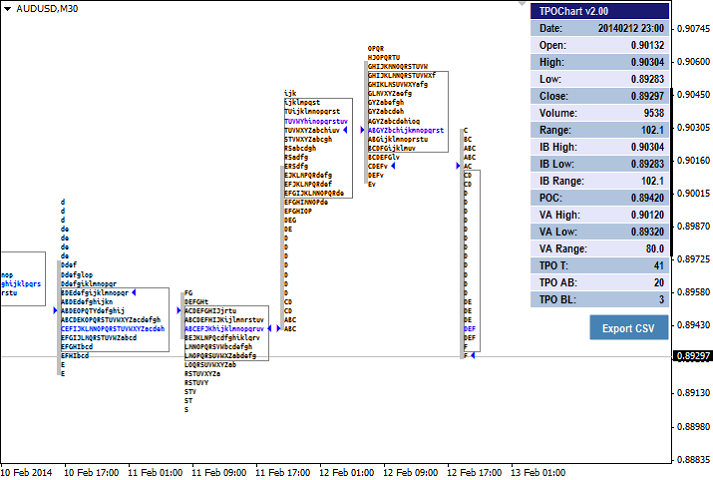
Features
- Supports the creation of Monthly, Weekly, Daily, 4 Hours, 1 Hours and 30 Minutes Market Profile.
- Daily Profile can have custom start time.
- Merge and Split of Market Profile
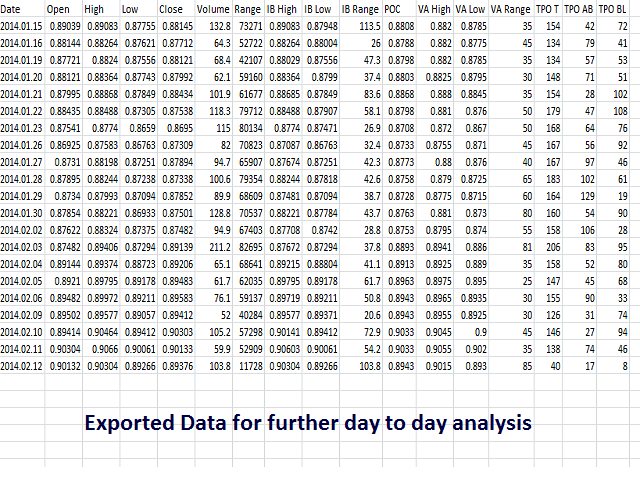
- Market Profile References Point can be exported to CSV format for any further analysis.
Indicator Parameters
- Indicator Update Interval - Choose indicator calculation period from 250 milliseconds to 2.5 seconds
- Indicator Setting ID - An ID for this particular indicator setting.
- Profile Number - The Number of Market Profiles to display.
- Profile Type - The type of Profile ( Daily, Weekly, Montly ).
- Data Period - Data timeframe used to generate the market profile.
- Day Start Time - Start time for Daily Profile.
- Row Size in Pips - Price steps for TPO calculation.
- IB Numbar - Number of Bars for Initial Balance calculation.
- Mode Histogram - Whether to use Histogram Profile or TPO Profile.
- Hide Chart - Whether to hide the bar/candle chart or display it.
- TPO Font Name - Font Name for displaying TPOs.
- Color Scheme - Choose predefined color scheme or User Defined.
- TPO Color - User Defined TPO Color.
- Histogram Color - User Defined Histogram Color.
- Value Area Color - User Defined Value Area Color.
- POC Color - User Defined POC Color.
- Initial Balance Color - User Defined for Initial Balance Color.
- Enable Data Export to Global Variables - Whether to enable data export to Global Variables.
- Global Variables Prefix - Set the Global Variables Prefix.
- Profile Data to Export - Whether to export data (to Global Variables) of current developed profile or the last EOD profile.

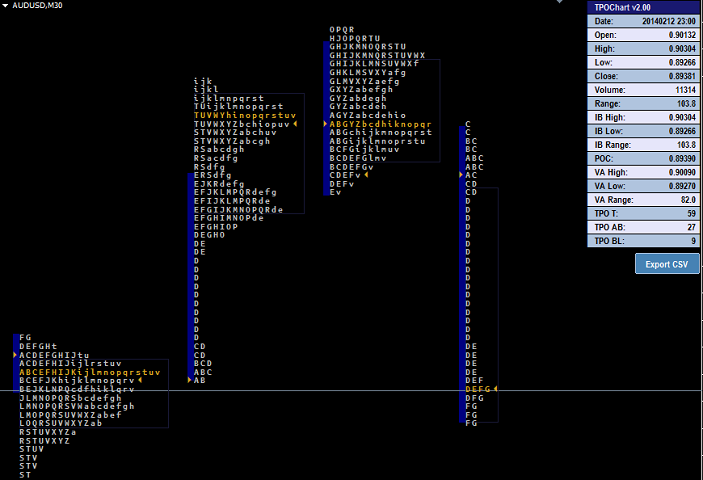


Excellent. just a small problem with the colors. i define the color of IB is Red and it stays blue or grey. nothing serious. perfect for for trading.