MM Deepness Arrows
- 지표
- Francesco Rubeo
- 버전: 1.0
- 활성화: 20
Easily access to a deep knowledge of the market movement with "M.M. Deepness Arrows"!!
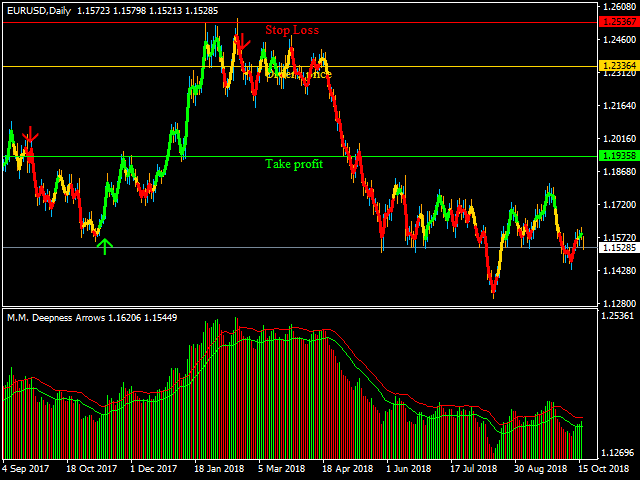
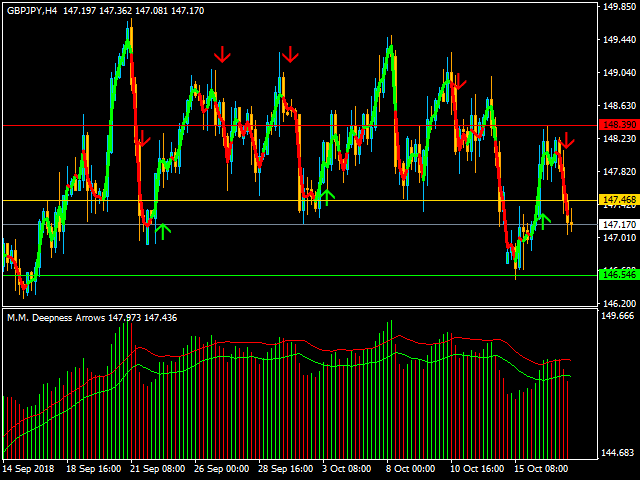
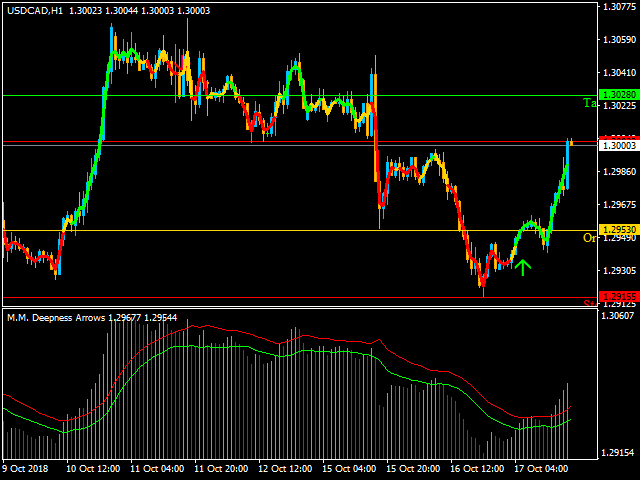
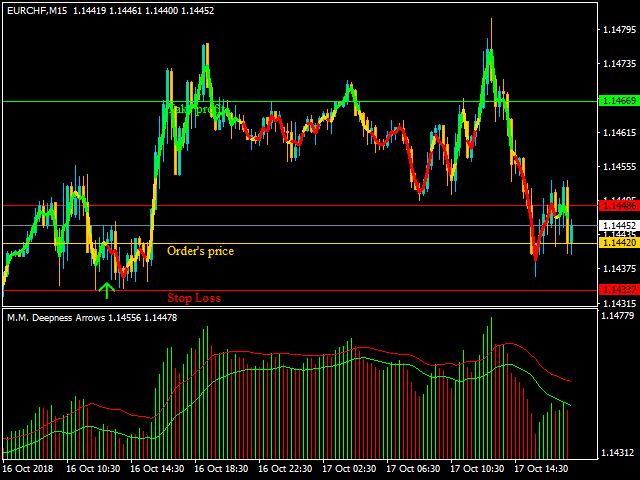
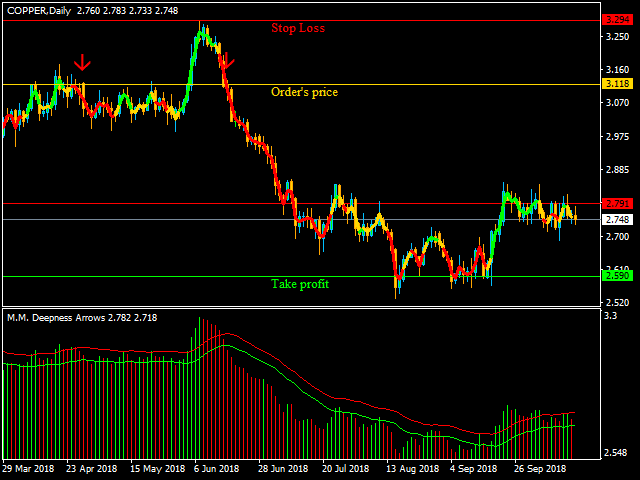
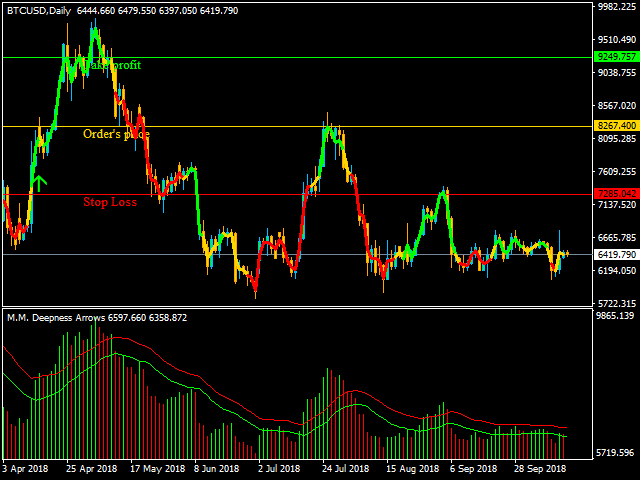
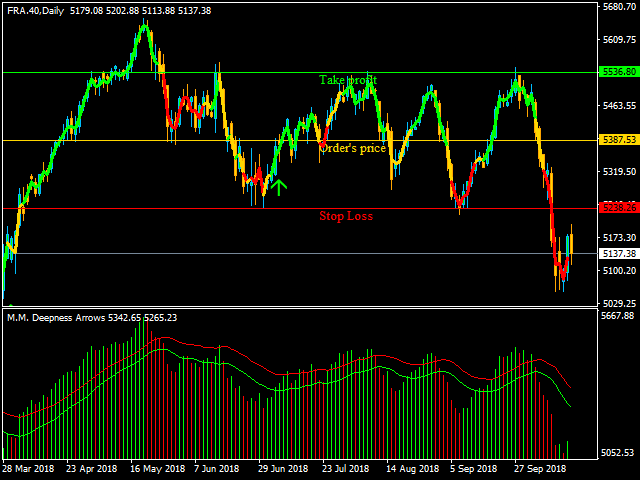
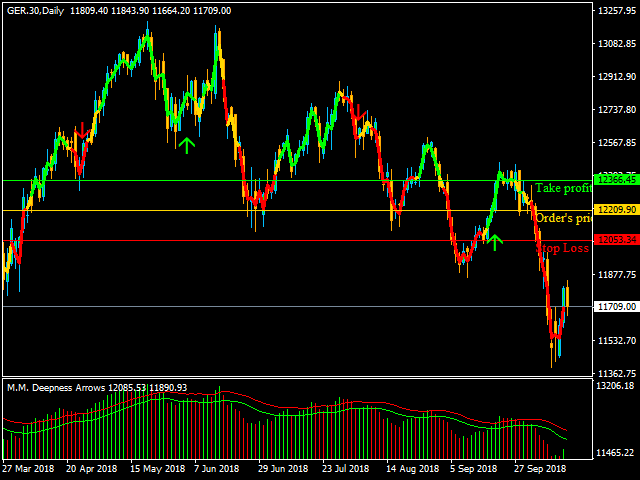
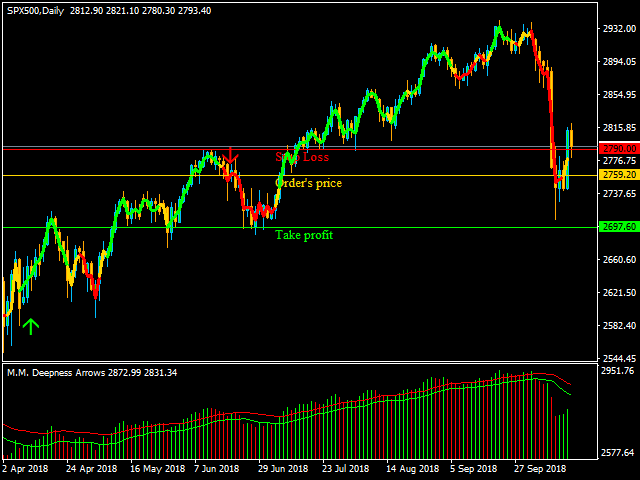
This indicator will give you advices on buys and sells after having analized the deepness of the market. The entrance "trigger" will be given after studying each candles' max and min avoiding, this way, the misleading data released by the opening and closure prices (given by the brokers). Thanks to the use of these arrows you'll be able to easily understand if i'ts the right time to buy or sell. If you want the indicator will suggest you also the stoploss and the take profit levels.
Alerts, E-mails and Push Notifications on your phone are just ready in the indicator to never lose one signal!!
On the Strategy Tester you can try the indicator and find the best parameters to use it on each single market "live".
How it works:
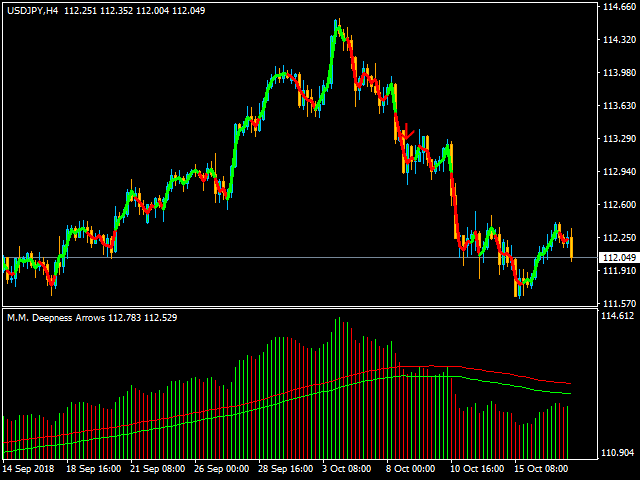
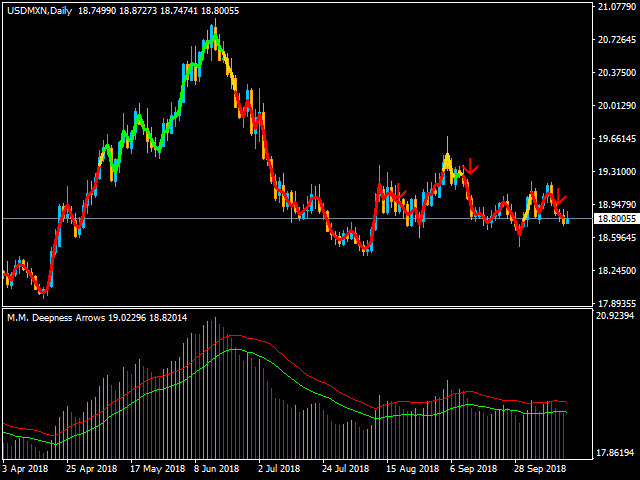
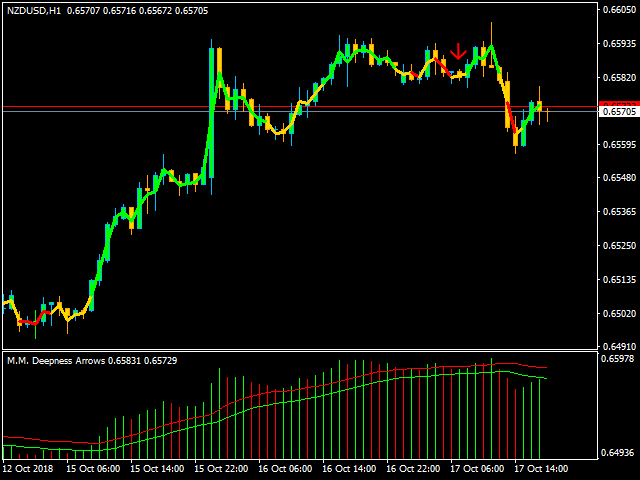
- Below you'll have an histogram chart representing the market's movement based on market's max and min.
- On the mean graph you'll have a line representing the trend calculated by the indicator.
The entrance "trigger" is given, for the sells, by a red histogram with a price higher than the maximum prices average, this one followed by another red histogram that instead is below the same average. For the buys the same thinking but reversed, based on the average of the min prices.
Advantages you get:
- Non Repaint indicator (please check video).
- User-friendly indicator with arrows for buy and sell operations.
- Live uptades with Alerts, E-mails and Push Notifications.
Input Parameters:
- Targets: If setted ON, the indicator willl suggest you stoploss and takeprofit levels.
- Stop Loss: You can use two types of stoploss:
- Last Zig Zag:Choose last zig-zag.
- Average Volatility: Use the average volatility.
- Buy Color:Choose your favourite color for Buy.
- Sell Color:Choose your favourite color for Sell.
- Neutral Color:Choose your favourite color for "no trigger" background.
- Line Width: Choose the width line of the trend on the chart.
- Trend Period: Bars to analyze to calculate the trend.
- Moving Averages Period: Bars to analyze to calculate the averages on the histograms.
- Moving Averages Method: Type of moving average to apply on the histograms.
- Stop Loss Color: Choose your favourite stoploss color.
- Take Profit Color: Choose your favourite takeprofit color.
- Order Color: Choose your favourite price of the order on the market color.
- Detailed Statement Dashboard: Panel of statement to monitorize the indicator on Strategy Tester.
- Background Color: Choose your favourite background color of the panel.
- Front Color: Choose your favourite front written elements color of the panel.
- Font Size: Size of the written elements on the panel and on live chart for Order's price, stoploss and takeprofit.
- Font Type: Type of font used by indicator.
- Notification Settings:
- Use Alert: Choose if you want receive or not live Alerts.
- Use Push: Choose if you want receive or not live Push Notifications.
- Use Mail: Choose if you want receive or not live E-Mails.








Ottimo Indicatore. D facile lettura e molto intuitivo. Basta seguire la freccia per arrivare alla giusta "destinazione". Buona la scelta di mettere gli alert per essere avvisati. Vivamente consigliato e vale le 5 stelle.