Culmination candle x2 free
- 지표
- Andrii Malakhov
- 버전: 1.11
- 업데이트됨: 24 7월 2018
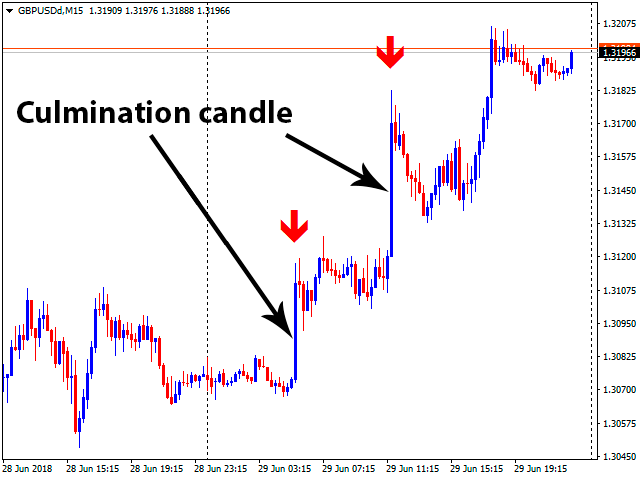
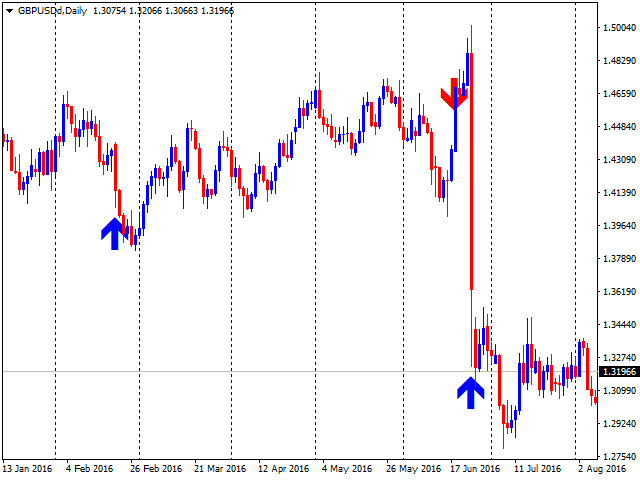
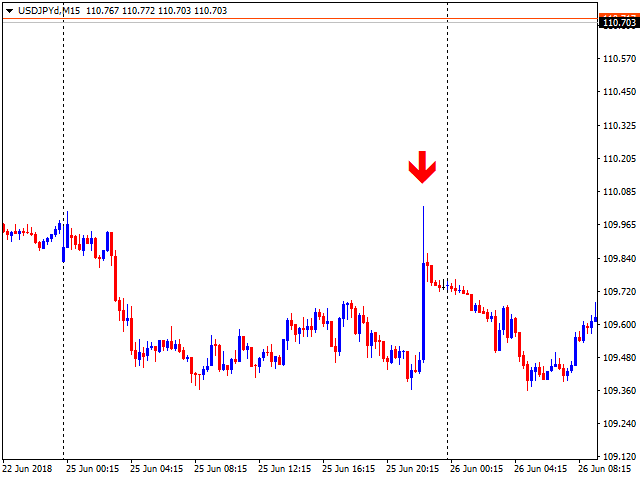
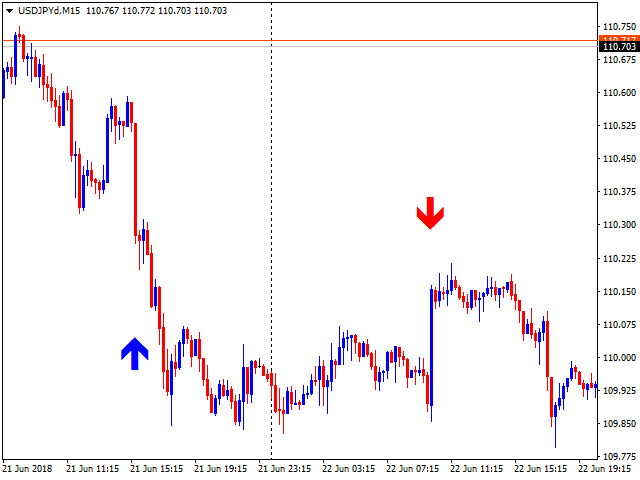
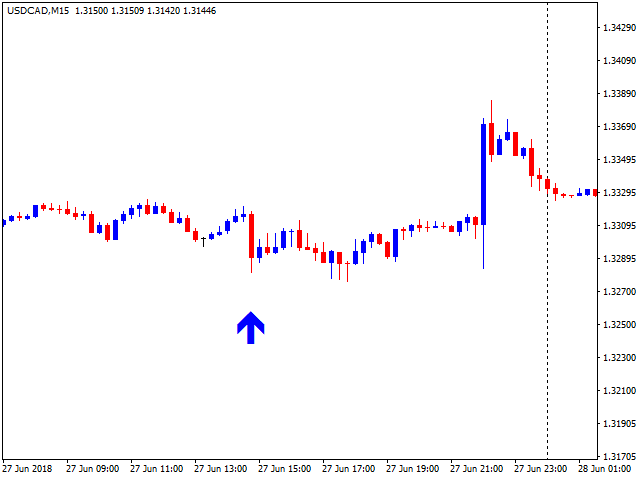
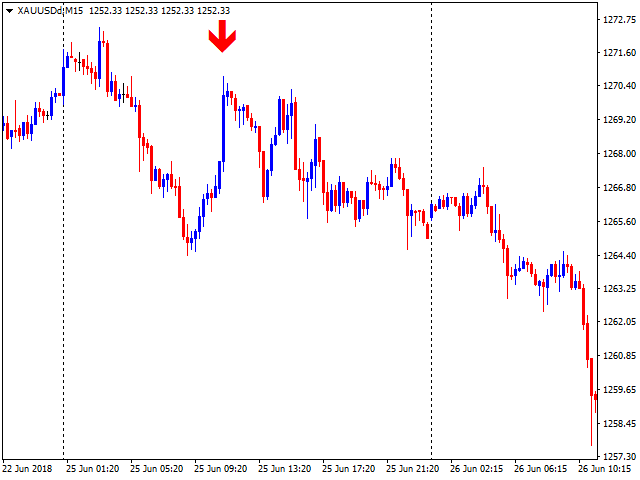
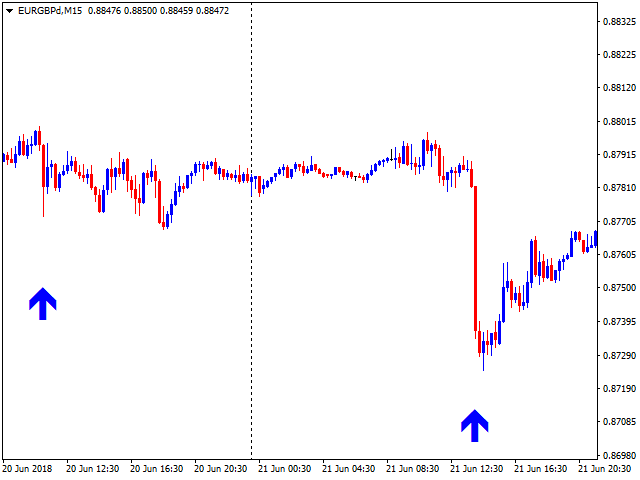
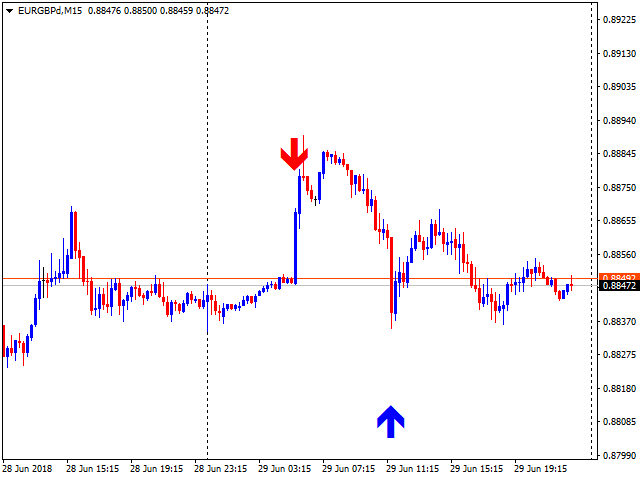
The indicator searches for the largest candles with minimum wicks for the last X candles. Sometimes, such candles mark the presence of a strong buyer, who quickly and strongly pushes the price in the right direction. However, most often, these are culmination candles, especially at the end of a prolonged trend when a single large candle knocks out stop losses of the most persistent traders and the price reverses instantly.
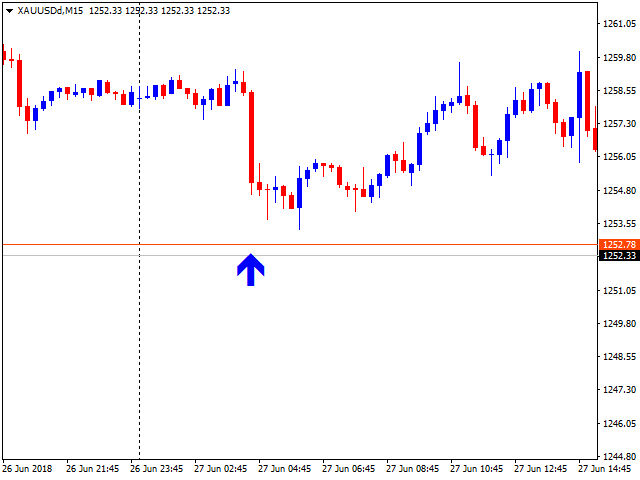
The indicator allows you to open a position on the very edge of the market, in counter-trend, behind the culmination candle, with a minimal stop loss.
Stop losses and trailing stop are mandatory. This allows you to get maximum profit during a correction.
This version works only on USDCAD! The full version of the indicator can be purchased here - https://www.mql5.com/en/market/product/30272
Advantages
- When you open a trade on the indicator signal, the stop is minimal.
- The indicator has signal buffers - it can be connected to EAs as a signal indicator.
- No repainting.
- The EA works on any timeframe. It is best to search for signals on M15-H1.
Options
- History_for_analise - number of candles to analyze when searching for a signal.
- PercentBigCandles - percentage of the largest candles. The optimal values are 1-2%. This means, the indicator will show only signals only on 1-2% of the longest candles in history.
- Alert_Culmination_candle - signal alert.
- Filter_by_MA20 - only search for culmination candlesticks with the base near MA20.
- Value_near_MA20 - optimal 50 pips - the maximum distance for the base of the culmination candlesticks, with which the candlestick is considered a culmination.
- Distance - distance from a candle where the arrow is displayed, in pips.
- SendToEmailAndPush - send emails and push messages when a new signal appears.
If you have any questions about the operation of the indicator, feel free to ask them in the Comments or in private messages.

사용자가 평가에 대한 코멘트를 남기지 않았습니다