• 미리보기
  • 리뷰 (33)
  • 코멘트 (114)
  • 새 소식

Shepherd Harmonic Patterns Free

4.73

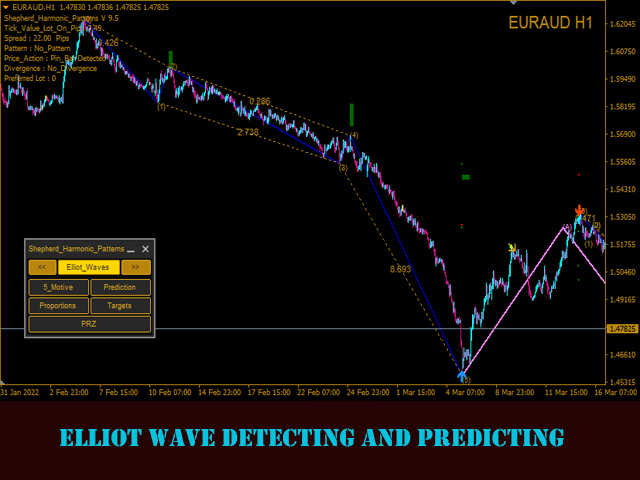
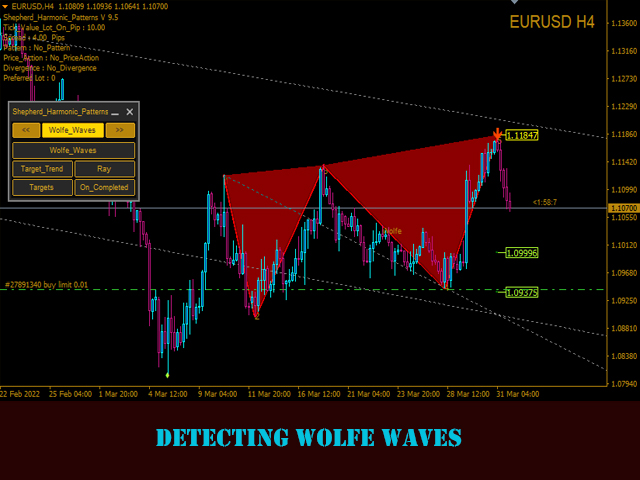
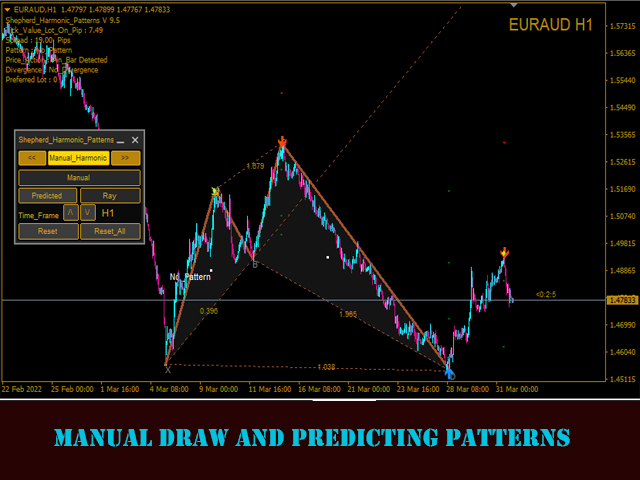
This indicator will detect harmonic patterns that are drawn on the chart by manual and automatic methods. You can see user manual from this link:

https://www.mql5.com/en/blogs/post/719257

There is a free version (it detect only Gartley and Nenstar Patterns) to try this product.

You can buy the full MT4 version from:

https://www.mql5.com/en/market/product/104689


Notes

  • When you use this indicator and change the settings, add indicators like Moving Average or Bollinger Bands, this indicator will save template of you edits automatically and you can load them any time you need.
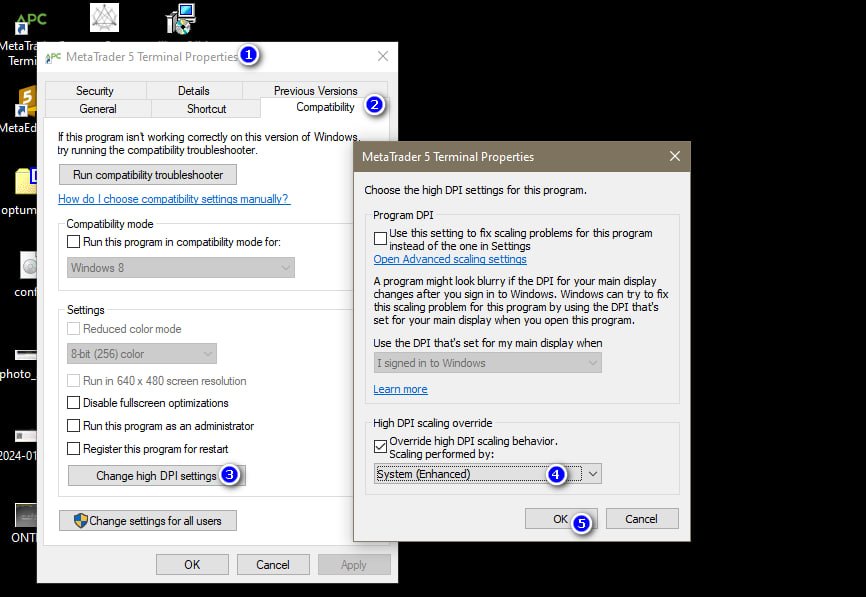
  • If you are using Windows 10, press right click on MetaTrader icon > Compatibility > Change High DPI Settings > System (Enhanced) to have best screen settings (it should be done in HD Devices).
  • Indicator is simply an interpretation of harmonic trading theory for detecting harmonic patterns on the chart. If you want to learn it you can search for Scott Carney's book named "Harmonic Trading vol 1&2".
  • Indicator has price and time alert lines.
  • Indicator will draw Fibonacci fans on your detected patterns.
  • Indicator will draw Pivots/Camarella/Patterns Ray.
  • You can load manually drawn objects from higher timeframes into lower timeframes.
  • Reset buttons will clear all saved settings (All / Current) timeframe.
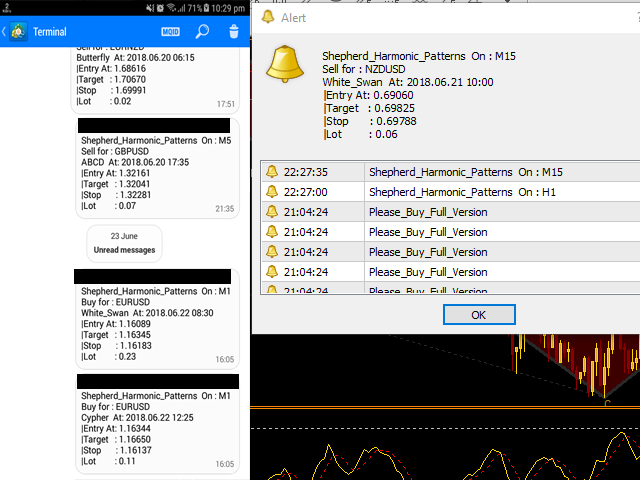
  • Indicator has an alert / notification system that will provide you with targets/stop/entry points as signal.
  • Indicator will detect divergence (yellow and orange arrows) and they serve as good confirmations.
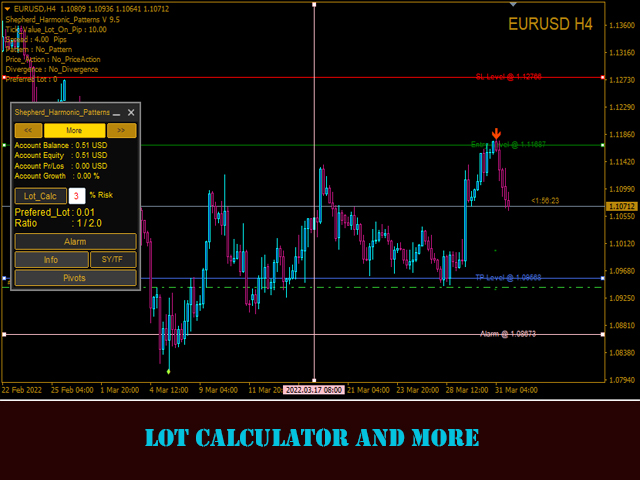
  • Indicator will calculate best lot size for every pattern as it is good for your balance with risk value as you insert in settings.
  • Indicator will detect also price action patterns (Pinbar,InsideBar,OutSideBar).
  • You can use this indicator buffers in an EA using this code:
double buy_signal=iCustom(NULL,0,"Market\\Shepherd_Harmonic_Patterns",0,1); //if(buy_signal!= EMPTY_VALUE){//buy}
double sell_signal=iCustom(NULL,0,"Market\\Shepherd_Harmonic_Patterns",1,1); //if(buy_signal!=EMPTY_VALUE){//sell}
double bull_divergence=iCustom(NULL,0,"Market\\Shepherd_Harmonic_Patterns",2,1); //if(bull_divergence!=EMPTY_VALUE){//buy}
double bear_divergence=iCustom(NULL,0,"Market\\Shepherd_Harmonic_Patterns",3,1); //if(bear_divergence!=EMPTY_VALUE){//sell}
double sl_Value=iCustom(NULL,0,"Market\\Shepherd_Harmonic_Patterns",4,1); 
double tp1_Value=iCustom(NULL,0,"Market\\Shepherd_Harmonic_Patterns",5,1);
double tp2_Value=iCustom(NULL,0,"Market\\Shepherd_Harmonic_Patterns",6,1);
double tp3_Value=iCustom(NULL,0,"Market\\Shepherd_Harmonic_Patterns",7,1);
double Price_Action=iCustom(NULL,0,"Market\\Shepherd_Harmonic_Patterns",8,1);if(Price_Action!=EMPTY_VALUE){//trade=true;} 


Parameters

  • Use_System_Theme- Choose color scheme.
  • EA_MODE - Put it true when you call it on ea.
  • Show_Last_Candle_Counter - Enable\Disable candle timer.
  • Candle_Counter_Color - Color of candle timer.
  • Accuracy_Percent - Percent for patterns proportions accuracy.
  • Bullish_Pattern_Color - Color for bullish patterns.
  • Bearish_Pattern_Color - Color for bearish patterns.
  • ABCD_Color - AB=CD patterns color.
  • Manual_Pattern_Color - Color of manual pattern.
  • Targets_Only_Completed_D - Enable\Disable show targets only on completed patterns.
  • Font_Color - Color of texts.
  • Fan_Color - Color of fans.
  • Send_Alert - Enable\Disable alert function.
  • Send_Notification - Enable\Disable notification function.
  • Send_Email - Enable\Disable email function.
  • InsideBar_Sensor - Enable\Disable InsideBar price action detecting.
  • OutSideBar_Sensor - Enable\Disable OutSideBar price action detectin
  • PinBar_Sensor - Enable\Disable PinBar 
  • Risk_Percent - Risk percent to calculate with patterns stop loss value and account balance.
  • Lot_Calculate_On - Choose risk calculation between static or percent risk value.
  • History_Bars - Max bars 
리뷰 20
09122017109
86
09122017109 2024.02.22 16:34 
 

Класс

davevicens
321
davevicens 2022.12.23 17:44 
 

Good indicator and very accurate

nicepls
30
nicepls 2021.10.03 20:39 
 

very useful thank you

추천 제품
Free automatic fibonacci
Tonny Obare
4.65 (62)
Free automatic Fibonacci is an indicator that automatically plots a Fibonacci retracement based on the number of bars you select on the BarsToScan setting in the indicator. The Fibonacci is automatically updated in real time as new highest and lowest values appears amongst the selected bars. You can select which level values to be displayed in the indicator settings. You can also select the color of the levels thus enabling the trader to be able to attach the indicator several times with differe
FREE
Major Support and Resistance Indicator
Ahmad Ar Abedalaziz Alazaizeh
5 (1)
This indicator filters the Zigzag indicator to calculate the main support and resistance levels. Variables minimum gap between peaks : is the distance (GAP) between the peaks of the Zigzag peaks sensitivity : Minimum number of nearby peaks look back: it means that it has to test the last 50 peaks in the Zigzag object name perfix: a prefix for level’s line name on chart
FREE
Trend Catcher with Alert
Issam Kassas
4.8 (66)
트렌드 캐쳐: 알림 인디케이터와 함께 하는 트렌드 캐쳐 전략은 시장 트렌드와 잠재적인 진입 및 체크 포인트를 식별하는 데 도움이 되는 다목적 기술 분석 도구입니다. 이는 시장 상황에 적응하여 트렌드 방향을 명확하게 시각적으로 표현하는 동적 트렌드 캐쳐 전략을 제공합니다. 트레이더는 선호도와 위험 허용도에 맞게 매개변수를 사용자 정의할 수 있습니다. 이 인디케이터는 트렌드 식별을 지원하고 잠재적인 반전을 신호로 제공하며 트레일링 스탑 메커니즘으로 작동하며 실시간 경고를 제공하여 신속한 시장 대응을 돕습니다. 특징: - 트렌드 식별: 상승 트렌드와 하락 트렌드를 신호합니다. - 트렌드 반전: 양봉 색상이 상승에서 하락으로 변경되거나 그 반대의 경우 잠재적인 반전을 경고합니다. - 실시간 경고: 새로운 트렌드 식별을 위한 경고를 생성합니다. 추천사항: - 통화 및 페어: EURUSD, AUDUSD, XAUUSD 등... - 시간 프레임: H1. - 계정 유형: 모든 E
FREE
Advisor-assistant for those who like trading on Fibonacci levels. Automatically finds manually plotted Fibonacci Lines on the chart, and opens an order when the levels are broken. The Expert Advisor has 4 customizable levels and the ability to turn them off as unnecessary. Parameters:   Lot - order volume (lot);   Requote - price slippage;   Magic - individual number for all EA orders, works only with own orders;   Name Fibo - set initial name of Fibonacci lines;       Level parameters are id
FREE
Fibonacci SR Indicator
Martin Eshleman
3 (2)
Fibonacci SR Indicator This indicator creates support and resistance lines. This indicator is based on Fibonacci Retracement and Extension levels. It will consider many combinations of the Fibonacci levels and draw support/resistance lines based on these. This indicator uses tops and bottoms drawn by the ZigZag indicator in its calculations. The ZigZag can also be drawn on the chart, if necessary. The indicator considers many combinations of past reversal points and Fibonacci ratio levels, and
FREE
Mr Beast Analize
Luis Mariano Vazquez Marcos
5 (1)
Descripción del Asesor Experto "Mr. Beast Analyze" Nombre del Robot: Mr. Beast Analyze Descripción General: El Asesor Experto (EA) Mr. Beast Analyze está diseñado para proporcionar una visión completa y detallada del mercado a través de la visualización de información clave en la pantalla de MetaTrader 4 (MT4). Aunque el EA no realiza operaciones automáticamente, ofrece una amplia gama de datos útiles y gráficos que pueden ayudar a los operadores a tomar decisiones informadas. El EA se enfoca en
FREE
Clever Trend Swing Levels
Carlos Forero
4.13 (8)
Description: The indicator measures, through the zigzag indicator, the levels of trend or correction. It shows in the chart the levels of each low or high detected. KEY LINKS:   How to Install  –  Frequent Questions  -  All Products  How is this indicator useful? This indicator determines, depending on Zigzag parameter if a trend is beginning, developing, or ending This indicator determines the direction of the trend Components Levels as positive or negative numbers, depending on the direction
FREE
This indicator copies graphical objects (vertical lines, horizontal lines, text labels, fibo and etc.) from master chart to other charts.  For example, you can copy lines from the chart GBPUSD with period H1 to chart GBPUSD with period M15. It's makes technical analyses more simple. Show label - show label on the Master chart, where you draw graphical objects to copy; Font size - font size of label; Type of synchronisation - type of synchronisation Copy text - on/off copy of text objects Copy
FREE
Auto AndrewFork
Noor Ghani Rahman
1 (1)
Auto Pitchfork Indicator The indicator calculate the Pitch fork for the previous Day (Selectable) with multiple Support and Resistance lines from the Median price which acts as Magnet for the Price that if price touch the above warning (1) or below warning (1) lines and not cross up or down then there is maximum possibilities that it will return to the Median Line, and thus maintain the Price Action in Cyclic Pattern to the Market Move. You are able to select how many warning lines you want to k
You can find full version here: Harmonic Pattern Scanner MT4 Harmonic Pattern Scanner MT5 Introduction Harmonic Patterns are best used to predict turning point. Harmonic Patterns give you high win rate and high opportunities for trade in during one day. This indicator detects the best and successful patterns base on   Harmonic Trading   books by   Mr. Scott M.. Main Features Detect the best and     most successful patterns : Gartley, Bat, Crab, Butterfly, Cypher, Shark, Alt_Bat, Deep_Crab Easy-
FREE
Fibonacci Calculation Indicator
Richard Louis Pastor
4 (3)
Basic Fibonacci Calculation Indicator  shows Trend, Stoploss, Profit 1,2,3, will show you your daily Highs and your Daily Lows , it will also show you where it expects the price to move to.  best time frame is H1 or higher .  For  a better system that also includes my Non-repaint Indicator please check out my paid Fibo Indicator  https://www.mql5.com/en/market/product/82323
FREE
This indicators automatically draws the Support and resistances levels for you once you've dropped it on a chart.  It reduces the hustle of drawing and redrawing these levels every time you analysis prices on a chart. With it, all you have to do is dropped it on a chart, adjust the settings to your liking and let the indicator do the rest.  But wait, it gets better; the indicator is absolutely free!  Get the new and improved version here:  https://youtu.be/rTxbPOBu3nY Parameters Time-frame  -> T
FREE
Koala Fibo Base Time
Ashkan Hazegh Nikrou
3 (1)
Welcome to Koala Fibo Base Time Welcome to Koala Fibo Time Zone Welcome to Koala Fibo Time Extention Welcome to Missed Tool For Meta Trade! Simple Introduction : Fibonacci Time Zones are vertical lines based on the Fibonacci Sequence. These lines extend along the X axis (date axis) as a mechanism to forecast reversals based on elapsed time. A major low or high is often chosen as the starting point. Distances start relatively small and grow as the Fibonacci Sequence extends. Chartists can exten
FREE
This indicator presents an alternative approach to identify Market Structure. The logic used is derived from learning material created by   DaveTeaches (on X) When quantifying Market Structure, it is common to use fractal highs and lows to identify "significant" swing pivots. When price closes through these pivots, we may identify a Market Structure Shift (MSS) for reversals or a Break of Structure (BOS) for continuations. The main difference with this "protected" logic is in how we determine
The CandleStick Scanner is a tool that allow you to perform a   market scan   and search any candlestick pattern that you already created in the current chart, You can perform a quick search in the current chart (500 bars will be scanned),  This is a   lite version   of  CandleStick Factory for MT4   . The   full version   video can be found here :  https://www.youtube.com/watch?v=fq7pLXqVO94 The  full version  can be purchased here:  https://www.mql5.com/en/market/product/75628 How it works Y
FREE
Best SAR
Ashkan Hazegh Nikrou
5 (3)
Koala Trading Solution 채널 에 가입하여 MQL5 커뮤니티에서 최신 신호 및 Koala 제품에 대한 소식을 확인하세요. 가입 링크는 아래에 있습니다: https://www.mql5.com/en/channels/koalatradingsolution 설명 :  우리는 외환 시장(PSAR)에서 전문적이고 인기 있는 지표 중 하나를 기반으로 하는 새로운 무료 지표를 도입하게 된 것을 기쁘게 생각합니다. 이 지표는 원래 포물선 SAR 지표에 대한 새로운 수정이며, 프로 SAR 지표에서 점과 가격 차트 사이의 교차를 볼 수 있습니다. 교차는 신호가 아니지만 이동 가능성의 끝을 말하는 것입니다. 새로운 파란색 점으로 매수를 시작하고 첫 번째 파란색 점 앞에 손절매를 1 attr 배치하고 마지막으로 점이 가격 차트를 교차하는 즉시 종료할 수 있습니다. 매수 또는 매도 신호를 여는 방법은 무엇입니까? 첫 번째 파란색 점으로 공개 매수 거래 및 첫 번째 빨간색 점으로 공
FREE
Pivot Classic, Woodie, Camarilla, Fibonacci and Demark Floor/Classic Pivot points, or simply pivots, are useful for identifying potential support/resistance levels, trading ranges, trend reversals, and market sentiment by examining an asset's high, low, and closing values. The Floor/Classic Pivot Points can be calculated as follows. Pivot Point (P) = (High + Low + Close)/3 S1 = P * 2 - High S2 = P - (High - Low) S3 = Low – 2*(High - P) R1 = P * 2 - Low R2 = P + (High - Low) R3 = High + 2*(P -
FREE
Lisek Waves
Darius Hans Lischka
2.5 (2)
Search for an entry with low risk for trading by Lisek Waves Indicator. Using Lisek Waves Indicator can improve your trading performance. In it’s simplest form, this trading tool make it easy to s earch for an entry with low risk   and to manage your trade and risk. Lisek Wave analysis is based on the notion that markets follow specific patterns called waves which are the result of a natural rhythm of crowd psychology that exists in all markets. You can avoid the loss from taking trades that are
FREE
Introduction This indicator detects volume spread patterns for buy and sell opportunity. The patterns include demand and supply patterns. You might use each pattern for trading. However, these patterns are best used to detect the demand zone (=accumulation area) and supply zone (=distribution area). Demand pattern indicates generally potential buying opportunity. Supply pattern indicates generally potential selling opportunity. These are the underlying patterns rather than direct price action. T
FREE
COG LR Osc AM
Andriy Matviyevs'kyy
The presented indicator allows you to determine potential entry points into the market and set protective orders at reasonable levels. This product can be useful for both beginners and experienced traders. The indicator is based on calculation methods proven by time and practicing traders. The indicator is calculated in two stages: At the first stage, linear regression (LR) of the selected price type is determined for a given number of chart periods. At the second stage, the obtained data is p
FREE
Double top and bottom indicator is a pattern scanning indicator which scans the tops and bottoms using zig zag pattern. When it find price bouncing back from the same point twice after a long trend then it generate arrow signals whenever the last resistance points is broken for double bottom and last support price broken for double top. Unlike other top bottom scanner it does not give only 1 signal. it alerts user when ever the last support /resistance is broker from double top/bottom pattern un
FREE
Vanexio
Sayan Vandenhout
5 (1)
VANEXIO USES THE TREND WAVE INDICATOR AND IT CAN IDENTIFY THE BEGINNING AND THE END OF A NEW WAVE TREND MOVEMENT. AS AN OSCILLATOR, THE INDICATOR IDENTIFIES THE OVERBOUGHT AND OVERSOLD ZONES. IT WORKS GREAT TO CATCH THE SHORT TERM PRICE REVERSALS AND USES A MARTINGALE STRATEGY TO CLOSE ALL TRADES IN PROFIT. USE DEFAULT SETTINGS ON H1 OR HIGHER TIME FRAME ON ANY PAIR FOR MORE ACCURATE TRADES WHY THIS EA : Smart entries calculated by 5 great strategies The EA can be run on even a $20000
FREE
Multi Timeframe ZigZag Indicator
Salman A A A T Bakhash
5 (2)
Description: This indicator draw ZigZag Line in multiple time frame also search for Harmonic patterns before completion of the pattern. Features: Five instances of ZigZag indicators can be configured to any desired timeframe and inputs. Draw Harmonic pattern before pattern completion. Display Fibonacci retracement ratios. Configurable Fibonacci retracement ratios. Draw AB=CD based on Fibonacci retracement you define. You can define margin of error allowed in Harmonic or Fibonacci calculatio
FREE
CRW CCI and RSI and WPR
Kaijun Wang
4.38 (8)
Necessary for traders: tools and indicators Waves automatically calculate indicators, channel trend trading Perfect trend-wave automatic calculation channel calculation , MT4 Perfect trend-wave automatic calculation channel calculation , MT5 Local Trading copying Easy And Fast Copy , MT4 Easy And Fast Copy , MT5 Local Trading copying For DEMO Easy And Fast Copy , MT4 DEMO Easy And Fast Copy , MT5 DEMO The homeopathic indicator is also called the CCI indicator. The CCI indicator was propos
FREE
Market Profile 3
Hussien Abdeltwab Hussien Ryad
4 (4)
Market Profile 3 MetaTrader 4 indicator  — is a classic Market Profile implementation that can show the price density over time, outlining the most important price levels, value area, and control value of a given trading session. This indicator can be attached to timeframes between M1 and D1 and will show the Market Profile for daily, weekly, monthly, or even intraday sessions. Lower timeframes offer higher precision. Higher timeframes are recommended for better visibility. It is also possible t
FREE
The   Pivot Point indicator   automatically calculates and displays the pivot point line and support and resistance levels. Pivot can be calculated according to the Classic, Floor, Fibonacci, Woodie, Camarilla or DeMark formula. It is also possible to select the period for calculating the indicator. A trader can choose from daily, weekly, monthly, or user-defined periods. Types of pivots Classic Floor Fibonacci Woodie Camarilla DeMark Main features The indicator shows the current and histor
FREE
Tipu Heikin Ashi Panel
Kaleem Haider
4.56 (25)
Tipu Heikin-Ashi Panel is the modified version of the original Heiken Ashi indicator published by MetaQuotes here . A professional version of this indicator is available here . Features An easy to use Panel that shows the Heiken Ashi trend of selected timeframe. Customizable Buy/Sell alerts, push alerts, email alerts, or visual on-screen alerts. Customizable Panel. The panel can be moved to any place on the chart or minimized to allow more space. Heikin means "the average", and Ashi means "foo
FREE
Follow The Line
Oliver Gideon Amofa Appiah
4.07 (14)
FOLLOW THE LINE GET THE FULL VERSION HERE: https://www.mql5.com/en/market/product/36024 This indicator obeys the popular maxim that: "THE TREND IS YOUR FRIEND" It paints a GREEN line for BUY and also paints a RED line for SELL.  It gives alarms and alerts of all kinds. IT DOES NOT REPAINT and can be used for all currency pairs and timeframes. Yes, as easy and simple as that. Even a newbie can use it to make great and reliable trades. NB: For best results, get my other premium indicators for more
FREE
UPD1 Fibo Levels
Vitaliy Kuznetsov
5 (4)
표시기는 지정된 수의 양초를 분석하고 고가를 기준으로 피보나치 수준을 표시합니다. 레벨이 재정렬되기 때문에 범위의 오른쪽에 관심이 있습니다. 가격은 레벨을 자화하고 터치에 반응합니다. 이 도구를 사용하여 수정 후 추세 진입점을 찾습니다. 왼쪽에서 레벨이 완벽하게 상승한 것을 보면 극한 지점에서 움직임의 끝을 발견했다고 가정할 수 있습니다. 모든 선은 버퍼 또는 개체를 통해 그려집니다(선택 사항). 입력 매개변수. Bars Count - 계산 범위. Visual Button - 버튼 표시(활성화/비활성화). Corner - 버튼 앵커 각도. X indent - 픽셀의 수평 패딩. Y indent - 픽셀의 수직 패딩. Label Visual - 디스플레이 레벨 레이블. Label Font Size   - 글꼴 크기. Label Shift Bars   - 비문의 들여쓰기(촛불의 수). Label Tooltip   - 레벨 위의 커서 아래에 텍스트 표시. Draw Lin
FREE
Update:ver1.53 (2023/08/16) ・概要と必要環境 手動発注もしくは他ツール等からの発注に対し、指値発注予約の複製を生成します。こちらは「発注操作の簡易化」に特化したものになります。発注判断となる分析は、資料を漁る、経験則を導く、他の分析ツールやEAを併用する等、利用者ご自身で頑張ってください。なお、ver1.28より、「決済後、自動で再発注する」機能が実装されました。(有償版でのみ有効化できます) ・導入と導入後の操作 導入そのものは簡単です。「自動売買可能なEA」として、適当なチャートにて動作させるだけです。(チャートの対象相場は問いません。このEAは、チャートを見ていません)。あとは、「このEAでのローカルコピー以外の発注」があれば、それに応じて「損失が出た場合に備えての追加取引の予約」という形で、指値発注が自動生成されます。 導入操作上の注意として、「本EAを、複数のチャートで動作」はできません。EAがチャート自体を見ておらず、注文状況だけを見ているため、複数のチャートで動かす意味もありません。また、ターミナルとEAの設定として「自動売買」を許可しな
FREE
이 제품의 구매자들이 또한 구매함
Gann Made Easy
Oleg Rodin
4.88 (100)
Gann Made Easy 는 mr.의 이론을 사용하여 최고의 거래 원칙을 기반으로 하는 전문적이고 사용하기 쉬운 Forex 거래 시스템입니다. W.D. 간. 이 표시기는 Stop Loss 및 Take Profit Levels를 포함하여 정확한 BUY 및 SELL 신호를 제공합니다. PUSH 알림을 사용하여 이동 중에도 거래할 수 있습니다. 구매 후 연락주세요! 내 거래 팁과 훌륭한 보너스 지표를 무료로 공유하겠습니다! 아마도 Gann 거래 방법에 대해 이미 여러 번 들었을 것입니다. 일반적으로 Gann의 이론은 초보자 거래자뿐만 아니라 이미 거래 경험이 있는 사람들에게도 매우 복잡한 것입니다. Gann의 거래 방식은 이론적으로 적용하기 쉽지 않기 때문입니다. 나는 그 지식을 연마하고 Forex 지표에 최고의 원칙을 적용하기 위해 몇 년을 보냈습니다. 표시기는 적용하기가 매우 쉽습니다. 차트에 첨부하고 간단한 거래 권장 사항을 따르기만 하면 됩니다. 지표는 지속적으로 시장 분석 작업
Gold Stuff
Vasiliy Strukov
4.9 (270)
Gold Stuff는 금을 위해 특별히 설계된 추세 지표이며 모든 금융 상품에서도 사용할 수 있습니다. 표시기가 다시 그려지지 않고 지연되지 않습니다. 권장 기간 H1. 표시기에서 완전 자동 Expert Advisor EA Gold Stuff를 작동합니다. 내 프로필에서 찾을 수 있습니다. 설정 및 개인 보너스를 받으려면 구매 후 즉시 저에게 연락하십시오!   강력한 지원 및 트렌드 스캐너 표시기의 무료 사본을 받으실 수 있습니다. 메시지를 보내주세요. 나!   설정 화살표 그리기 - 켜기 끄기. 차트에 화살표 그리기. 경고 - 가청 경고를 끕니다. 이메일 알림 - 켜기 끄기. 이메일 알림. Puch-notification - 켜기 끄기. 푸시 알림. 다음으로 색 영역을 조정합니다. Gold Stuff는 금을 위해 특별히 설계된 추세 지표이며 모든 금융 상품에서도 사용할 수 있습니다. 표시기가 다시 그려지지 않고 지연되지 않습니다. 권장 기간 H1. 표시기에서 완
Trend Punch
Mohamed Hassan
4.91 (23)
This indicator is unstoppable when combined with our other indicator called  Support & Resistance . After purchase, send us a message and you will get it   for  FREE as a BONUS! Introducing Trend Punch , the revolutionary forex trend indicator that will transform the way you trade! Trend Punch is uniquely designed to provide precise buy and sell arrows during strong market trends, making your trading decisions clearer and more confident. Whether you're trading major currency pairs or exotic sym
Apollo Pips PLUS SP
Oleg Rodin
5 (3)
제품을 구매하기 전에 아래 정보를 읽어보세요! Apollo Pips PLUS SP는 독특한 제품입니다! 모든 거래 지표에 액세스할 수 있는 새로운 "APOLLO PIPS" 지표와 "슈퍼 팩" 보너스를 받고 싶은 분들을 위한 것입니다! Apollo Pips PLUS SP 제품을 구매하면 실제로 Apollo Pips 표시기의 완전히 새로운 버전을 구매하게 됩니다. 이 버전의 지표에는 개선된 알고리즘과 사용하기 쉬운 매개변수가 있어 모든 시장 및 거래 스타일에서 지표를 사용할 수 있는 기회를 제공합니다. 이 제품의 구매자는 슈퍼 보너스로 다른 모든 표시기에 무료로 액세스할 수 있습니다! 내 모든 거래 도구에 액세스하고 싶었다면 이 제품이 당신에게 딱 맞습니다! :) 하지만 이것이 전부는 아닙니다! :) 이 제품의 모든 구매자는 또한 내 새로운 지표를 무료로 받을 자격이 있습니다! :) 새로운 거래 지표를 사용할 수 있게 되었는데, 귀하는 저의 특별한 "SUPER PACK" 평생 보너스
Scalper Inside PRO
Alexey Minkov
4.75 (60)
An exclusive indicator that utilizes an innovative algorithm to swiftly and accurately determine the market trend. The indicator automatically calculates opening, closing, and profit levels, providing detailed trading statistics. With these features, you can choose the most appropriate trading instrument for the current market conditions. Additionally, you can easily integrate your own arrow indicators into Scalper Inside Pro to quickly evaluate their statistics and profitability. Scalper Inside
Trend Pulse
Mohamed Hassan
5 (5)
Please contact me after purchase to immediately get your PDF strategy + documentation for Trend Pulse !  Official release price of $89  (2 /50 copies left). Next price is $199 . Introducing Trend Pulse , a unique and robust indicator capable of detecting bullish, bearish, and even ranging trends! Trend Pulse uses a special algorithm to filter out market noise with real precision. If the current symbol is moving sideways, Trend Pulse will send you a ranging signal, letting you know that it'
FX Power MT4 NG
Daniel Stein
5 (12)
모닝 브리핑 여기 mql5 와 텔레그램에서 FX Power MT4 NG 는 오랫동안 인기 있는 통화 강도 측정기인 FX Power의 차세대 버전입니다. 이 차세대 강도 측정기는 무엇을 제공합니까? 기존 FX Power에서 좋아했던 모든 것 PLUS GOLD/XAU 강도 분석 더욱 정밀한 계산 결과 개별 구성 가능한 분석 기간 더 나은 성능을 위한 사용자 정의 가능한 계산 한도 특별 멀티더 많은 것을보고 싶은 사람들을위한 특별한 다중 인스턴스 설정 모든 차트에서 좋아하는 색상을위한 끝없는 그래픽 설정 수많은 알림 옵션, 중요한 것을 다시는 놓치지 않도록 Windows 11 및 macOS 스타일의 둥근 모서리가 있는 새로운 디자인 마법처럼 움직이는 인디케이터 패널 FX 파워 키 특징 모든 주요 통화의 완전한 강세 이력 모든 시간대에 걸친 통화 강세 이력 모든 브로커 및 차트에서 고유 계산 결과 100% 신뢰할 수있는 실시간100 % 신뢰할 수있는 실시간 계산-> 다시 칠하지 않음
TPSproTREND PrO
Roman Podpora
4.79 (19)
TPSpro TREND PRO는   시장을 자동으로 분석하여 추세와 각 변화에 대한 정보를 제공할 뿐만 아니라 다시 그리지 않고도 거래에 진입할 수 있는 신호를 제공하는 추세 지표입니다! 지표는 각 양초를 사용하여 개별적으로 분석합니다. 다른 임펄스를 언급합니다 - 업 또는 다운 임펄스. 통화, 암호화폐, 금속, 주식, 지수 거래의 정확한 진입점! 버전 MT5                   표시기에 대한 전체 설명       표시기   와 함께 사용하는 것이 좋습니다   -   RFI LEVELS 주요 기능: 렌더링 없이 정확한 입력 신호! 신호가 나타나면 관련성은 유지됩니다! 이는 신호를 제공한 후 변경하여 예금 자금 손실을 초래할 수 있는 다시 그리기 지표와의 중요한 차이점입니다. 이제 더 큰 확률과 정확도로 시장에 진입할 수 있습니다. 화살표가 나타난 후 목표에 도달(이익실현)하거나 반전 신호가 나타날 때까지 캔들을 색칠하는 기능도 있습니다. STOP LOSS / TAK
Atomic Analyst
Issam Kassas
5 (3)
우선적으로 언급할 점은이 거래 지표가 다시 그리지 않고 지연되지 않으며 이를 통해 수동 및 로봇 거래 모두에 이상적이라는 점입니다. 사용자 매뉴얼: 설정, 입력 및 전략. Atomic Analyst는 가격의 강도와 모멘텀을 활용하여 시장에서 더 나은 이점을 찾는 PA Price Action Indicator입니다. 고급 필터를 장착하여 잡음과 거짓 신호를 제거하고 거래 잠재력을 높이는 데 도움이 됩니다. 복잡한 지표의 다중 레이어를 사용하여 Atomic Analyst는 차트를 스캔하고 복잡한 수학적 계산을 간단한 신호와 색상으로 변환하여 초보 트레이더가 이해하고 일관된 거래 결정을 내릴 수 있도록합니다. "Atomic Analyst"는 새로운 및 경험이 풍부한 트레이더를위한 종합적인 거래 솔루션입니다. 프리미엄 지표와 최고 수준의 기능을 하나의 거래 전략에 결합하여 모든 종류의 트레이더에 대한 다재다능한 선택지가되었습니다. 인트라데이 거래 및 스캘핑 전략 : 빠르고 정확한
Trend Screener
STE S.S.COMPANY
4.82 (92)
트렌드 표시기, 트렌드 트레이딩 및 필터링을 위한 획기적인 고유 솔루션, 하나의 도구 안에 내장된 모든 중요한 트렌드 기능! Forex, 상품, 암호 화폐, 지수 및 주식과 같은 모든 기호/도구에 사용할 수 있는 100% 다시 칠하지 않는 다중 시간 프레임 및 다중 통화 표시기입니다. Trend Screener는 차트에 점이 있는 화살표 추세 신호를 제공하는 효율적인 지표 추세 추종 지표입니다. 추세 분석기 표시기에서 사용할 수 있는 기능: 1. 트렌드 스캐너. 2. 최대 이익 분석이 있는 추세선. 3. 추세 통화 강도 측정기. 4. 경고가 있는 추세 반전 점. 5. 경고가 있는 강력한 추세 점. 6. 추세 화살표 Trend Screener Indicator가 있는 일일 분석 예, 일일 신호 성능...등은 여기에서 찾을 수 있습니다.   여기를 클릭하십시오. LIMITED TIME OFFER : Trend Screener Indicator는 50 $ 및 평생 동안만 사용할 수 있
Gold Channel XAUUSD
Paulo Rocha
5 (2)
Gold Channel is a volatility-based indicator, developed with a specific timing algorithm for the XAUUSD pair, which consists of finding possible corrections in the market. This indicator shows two outer lines, an inner line (retracement line) and an arrow sign, where the theory of the channel is to help identify overbought and oversold conditions in the market. The market price will generally fall between the boundaries of the channel. If prices touch or move outside the channel it is a tra
Currency Strength Wizard
Oleg Rodin
4.92 (52)
통화 강도 마법사는 성공적인 거래를 위한 올인원 솔루션을 제공하는 매우 강력한 지표입니다. 표시기는 여러 시간 프레임의 모든 통화 데이터를 사용하여 이 또는 해당 외환 쌍의 힘을 계산합니다. 이 데이터는 특정 통화의 힘을 확인하는 데 사용할 수 있는 사용하기 쉬운 통화 지수 및 통화 전력선의 형태로 표시됩니다. 필요한 것은 거래하려는 차트에 표시기를 부착하는 것뿐입니다. 표시기는 거래하는 통화의 실제 강세를 보여줍니다. 지표는 또한 추세와 거래할 때 유리하게 사용할 수 있는 구매 및 판매 거래량 압력의 극한값을 보여줍니다. 지표는 또한 피보나치에 기반한 가능한 대상을 보여줍니다. 표시기는 PUSH 알림을 포함한 모든 유형의 알림을 제공합니다. 구매 후 연락주세요. 나는 당신과 거래 팁을 공유하고 당신에게 무료로 훌륭한 보너스 지표를 줄 것입니다! 나는 당신에게 행복하고 유익한 거래를 기원합니다!
현재 20% 할인 ! 초보자 또는 전문가 트레이더를 위한 최고의 솔루션! 이 대시보드 소프트웨어는 28개의 통화 쌍에서 작동합니다. 2가지 주요 지표(Advanced Currency Strength 28 및 Advanced Currency Impulse)를 기반으로 합니다. 전체 Forex 시장에 대한 훌륭한 개요를 제공합니다. 고급 통화 강도 값, 통화 이동 속도 및 모든(9) 시간대의 28 Forex 쌍에 대한 신호를 보여줍니다. 추세 및/또는 스캘핑 기회를 정확히 파악하기 위해 차트의 단일 지표를 사용하여 전체 시장을 볼 수 있을 때 거래가 어떻게 개선될지 상상해 보십시오! 잠재적인 거래를 식별하고 확인하면서 강력한 통화와 약한 통화를 더욱 쉽게 식별할 수 있도록 이 지표에 기능을 내장했습니다. 이 표시기는 통화의 강세 또는 약세가 증가 또는 감소하는지 여부와 모든 시간대에서 수행되는 방식을 그래픽으로 보여줍니다. 추가된 새로운 기능은 현재 시장 조건 변화에 적
- Real price is 80$ - 40% Discount ( It is 49$ now ) Contact me for instruction, any questions! Introduction The breakout and retest strategy is traded support and resistance levels. it involves price breaking through a previous level.  The break and retest strategy is designed to help traders do two main things, the first is to avoid false breakouts. Many false breakouts start with a candlestick that breaks out of a level but ends with an immediate candlestick that brings the price back into t
PZ Day Trading
PZ TRADING SLU
3.67 (3)
Effortless trading: non-repainting indicator for accurate price reversals Special Offer: Purchase now to receive free bonuses worth $189! (Read more for details) This indicator detects price reversals in a zig-zag fashion, using only price action analysis and a donchian channel. It has been specifically designed for short-term trading, without repainting or backpainting at all. It is a fantastic tool for shrewd traders aiming to increase the timing of their operations. [ Installation Guide | Up
Clear Breakout
Martin Alejandro Bamonte
5 (1)
"Breakout Buy-Sell" 지표는 다양한 시장 세션(도쿄, 런던, 뉴욕) 동안 가격 돌파를 기반으로 매수 및 매도 기회를 식별하고 강조하도록 설계되었습니다. 이 지표는 트레이더가 매수 및 매도 영역뿐만 아니라 이익 실현(TP) 및 손절매(SL) 수준을 명확하게 시각화하는 데 도움이 됩니다. 사용 전략 이 지표는 다음과 같이 사용할 수 있습니다: 초기 설정 : 시장 세션을 선택하고 GMT 오프셋을 조정합니다. 시장 시각화 : 각 세션 시작 시 그려지는 돌파 상자를 관찰합니다. 이러한 상자는 기간의 최고점과 최저점을 나타냅니다. 매수 및 매도 신호 : 상자의 최고점을 초과하는 돌파는 매수 신호로 간주됩니다. 최저점을 밑도는 돌파는 매도 신호로 간주됩니다. 위험 관리 : TP1, TP2, TP3 및 SL 수준을 사용하여 포지션을 관리합니다. TP 수준은 다양한 수익 목표를 위해 설계되었으며 SL은 불리한 움직임으로부터 보호를 보장합니다. 적용 전략 이 지표를 최대한 활용하기 위해
Advanced Currency Strength28 Indicator
Bernhard Schweigert
4.91 (667)
현재 26% 할인 초보자 또는 전문가 트레이더를 위한 최고의 솔루션! 이 지표는 우리가 독점 기능과 새로운 공식을 통합했기 때문에 독특하고 고품질이며 저렴한 거래 도구입니다. 단 하나의 차트로 28 Forex 쌍의 통화 강도를 읽을 수 있습니다! 새로운 추세 또는 스캘핑 기회의 정확한 트리거 포인트를 정확히 찾아낼 수 있기 때문에 거래가 어떻게 개선될지 상상해 보십시오. 사용 설명서: 여기를 클릭  https://www.mql5.com/en/blogs/post/697384 그것이 첫 번째, 원본입니다! 쓸모없는 지망생 클론을 사지 마십시오. 더 스페셜  강력한 통화 모멘텀을 보여주는 하위 창의 화살표 GAP가 거래를 안내합니다! 기본 또는 호가 통화가 과매도/과매도 영역(외부 시장 피보나치 수준)에 있을 때 개별 차트의 기본 창에 경고 표시가 나타납니다. 통화 강도가 외부 범위에서 떨어질 때 풀백/반전 경고. 교차 패턴의 특별 경고 추세를 빠르게 볼 수 있는
PRO Renko System
Oleg Rodin
5 (26)
PRO Renko System 은 RENKO 차트 거래를 위해 특별히 고안된 매우 정확한 거래 시스템입니다. 이것은 다양한 거래 상품에 적용될 수있는 보편적 인 시스템입니다. 체계는 효과적으로 당신에게 정확한 반전 신호에 접근을 주는 소위 시장 소음을 중화합니다. 이 표시기는 사용하기가 매우 쉽고 신호 생성을 담당하는 매개 변수가 하나만 있습니다. 당신은 쉽게 당신의 선택의 어떤 무역 계기에 공구를 적응시킬 수 있고 renko 막대기의 크기. 나는 항상 당신이 내 소프트웨어로 수익성있게 거래 할 수 있도록 추가 지원을 제공 할 준비가되어 있습니다! 나는 당신에게 행복하고 수익성있는 거래를 기원합니다! 구매 후 저에게 연락하십시오! 내 렌코 차트 생성기를 보내드립니다. 또한 내 개인 권장 사항 및 시스템의 다른 모듈을 무료로 공유 할 것입니다!
우선적으로, 이 거래 도구는 전문적인 거래에 이상적인 비-다시 그리기 및 지연되지 않는 지표입니다.  온라인 강좌, 사용자 매뉴얼 및 데모. 스마트 가격 액션 컨셉트 인디케이터는 신규 및 경험 많은 트레이더 모두에게 매우 강력한 도구입니다. Inner Circle Trader Analysis 및 Smart Money Concepts Trading Strategies와 같은 고급 거래 아이디어를 결합하여 20가지 이상의 유용한 지표를 하나로 결합합니다. 이 인디케이터는 스마트 머니 컨셉트에 중점을 두어 대형 기관의 거래 방식을 제공하고 이동을 예측하는 데 도움을 줍니다.  특히 유동성 분석에 뛰어나 기관이 어떻게 거래하는지 이해하는 데 도움을 줍니다. 시장 트렌드를 예측하고 가격 변동을 신중하게 분석하는 데 탁월합니다. 귀하의 거래를 기관 전략에 맞추어 시장의 동향에 대해 더 정확한 예측을 할 수 있습니다. 이 인디케이터는 시장 구조를 분석하고 중요한 주문 블록을 식별하고 다양한
Advanced Currency IMPULSE with ALERT
Bernhard Schweigert
4.91 (495)
현재 31% 할인!! 초보자 또는 전문가 트레이더를 위한 최고의 솔루션! 이 지표는 우리가 독점 기능과 비밀 공식을 통합했기 때문에 독특하고 고품질이며 저렴한 거래 도구입니다. 단 하나의 차트로 28개 통화 쌍 모두에 대한 경고를 제공합니다. 새로운 추세 또는 스캘핑 기회의 정확한 트리거 포인트를 정확히 찾아낼 수 있기 때문에 거래가 어떻게 개선될지 상상해 보십시오! 새로운 기본 알고리즘을 기반으로 구축되어 잠재적인 거래를 훨씬 더 쉽게 식별하고 확인할 수 있습니다. 이는 통화의 강세 또는 약세가 가속되는지 여부를 그래픽으로 표시하고 가속 속도를 측정하기 때문입니다. 자동차의 속도계처럼 생각하면 됩니다. 가속화할 때 Forex 시장에서 동일한 일이 분명히 더 빠르게 발생합니다. 즉, 반대 방향으로 가속화되는 통화를 페어링하면 잠재적으로 수익성 있는 거래를 식별한 것입니다. 통화 모멘텀의 수직선과 화살표가 거래를 안내합니다! 역동적인 Market Fibonacci 23
IX Power MT4
Daniel Stein
5 (6)
IX Power는 마침내 FX Power의 탁월한 정밀도를 외환이 아닌 기호에도 적용했습니다. 좋아하는 지수, 주식, 원자재, ETF, 심지어 암호화폐까지 단기, 중기, 장기 추세의 강도를 정확하게 파악할 수 있습니다. 단말기가 제공하는 모든 것을 분석할 수 있습니다. 사용해 보고 트레이딩 타이밍이 크게 향상되는 것을 경험해 보세요. IX Power 주요 특징 단말기에서 사용 가능한 모든 거래 심볼에 대해 100% 정확한 비재도장 계산 결과 제공 사전 구성 및 추가적으로 개별 구성 가능한 강도 분석 기간의 드롭다운 선택 가능 이메일, 메시지, 모바일 알림을 통한 다양한 알림 옵션 제공 EA 요청을 위한 액세스 가능한 버퍼 더 나은 성능을 위한 사용자 지정 가능한 계산 한도 더 많은 것을 보고 싶은 사용자를 위한 특별 다중 인스턴스 설정 모든 차트에서 좋아하는 색상을 위한 무한한 그래픽 설정 가능 Windows 11 및 macOS 스타일의 둥근 모서리를 가
Advanced Supply Demand
Bernhard Schweigert
4.9 (314)
현재 33% 할인! 초보자나 전문 트레이더를 위한 최고의 솔루션! 이 보조지표는 우리가 다수의 독창적 기능과 새로운 공식을 통합한 독특하고 고품질이며 저렴한 거래 도구입니다. 이 업데이트를 통해 이중 시간대를 표시할 수 있습니다. 더 높은 TF를 표시할 수 있을 뿐만 아니라 차트 TF와 더 높은 TF 모두를 표시할 수 있습니다: 중첩 영역 표시. 모든 Supply Demand 트레이더들이 좋아할 것입니다. :) 중요한 정보 공개 Advanced Supply Demand의 잠재력을 극대화하려면 다음을 방문하십시오. https://www.mql5.com/ko/blogs/post/720245   진입 또는 목표의 명확한 트리거 포인트를 정확히 찾아냄으로 해서 거래가 어떻게 개선될지 상상해 보십시오. 새로운 알고리즘을 기반으로 매수자와 매도자 간의 잠재적인 불균형을 훨씬 더 쉽게 분간할 수 있습니다. 왜냐하면 가장 강한 공급영역과 가장 강한 수요 영역과 과거에 어떻게 진행 되었는지를(이
NAM Order Blocks
NAM TECH GROUP, CORP.
5 (1)
MT4 Multi-timeframe Order Blocks detection indicator. Features - Fully customizable on chart control panel, provides complete interaction. - Hide and show control panel wherever you want. - Detect OBs on multiple timeframes. - Select OBs quantity to display. - Different OBs user interface. - Different filters on OBs. - OB proximity alert. - ADR High and Low lines. - Notification service (Screen alerts | Push notifications). Summary Order block is a market behavior that indicates order collection
Enigmera
Ivan Stefanov
5 (4)
에니메라: 시장의 핵심 https://www.enigmera.com 소개 이 지표 및 트레이딩 시스템은 금융 시장에 대한 놀라운 접근 방식입니다. 에니메라는 프랙탈 주기를 사용하여 지지선과 저항선을 정확하게 계산합니다. 진정한 축적 단계를 보여주고 방향과 목표를 제시합니다.  추세에 있든 조정에 있든 작동하는 시스템입니다.  어떻게 작동하나요? 에니메라는 지지선/저항선, 목표선, 편차선의 세 가지 라인으로 구성됩니다. 이 시스템은 과거 데이터를 현재와 미래로 추정하는 일반적인 시장 지표와 달리 현재에 대한 완전한 그림을 제공합니다. 지지선 위에 있으면 실제 지지를 의미하고 저항선 위에 있으면 실제 저항을 의미합니다. 레벨이 깨지면 추세의 변화를 나타냅니다. 다시 그리지 않습니다. 시장이 지속적으로 진화함에 따라 에니메라는 평가 도구를 조정하여 전략을 정기적으로 수정합니다.   이를 통해 모든 시나리오를 철저히 평가할 수 있습니다. 이 시장 지표의 고유성은 분명하며 그 기
PZ Trend Trading
PZ TRADING SLU
4.8 (5)
Capture every opportunity: your go-to indicator for profitable trend trading Special Offer: Purchase now to receive free bonuses worth $159! (Read more for details) Trend Trading is an indicator designed to profit as much as possible from trends taking place in the market, by timing pullbacks and breakouts. It finds trading opportunities by analyzing what the price is doing during established trends. [ Installation Guide | Update Guide | Troubleshooting | FAQ | All Products ] Trade financial
TPSpro RFI Levels
Roman Podpora
4.83 (24)
Reversal First Impulse levels (RFI)    INSTRUCTIONS        RUS       -       ENG              R ecommended to use with an indicator   -   TPSpro  TREND PRO -  Version MT5 A key element in trading is zones or levels from which decisions to buy or sell a trading instrument are made. Despite attempts by major players to conceal their presence in the market, they inevitably leave traces. Our task was to learn how to identify these traces and interpret them correctly. Main functions: Displaying activ
Scalper Vault
Oleg Rodin
5 (29)
Scalper Vault 는 성공적인 스캘핑에 필요한 모든 것을 제공하는 전문 스캘핑 시스템입니다. 이 표시기는 외환 및 바이너리 옵션 거래자가 사용할 수 있는 완전한 거래 시스템입니다. 권장 시간 프레임은 M5입니다. 시스템은 추세 방향으로 정확한 화살표 신호를 제공합니다. 또한 상단 및 하단 신호와 Gann 시장 수준을 제공합니다.  이 시스템은 사용하기가 매우 쉽습니다. 원하는 시장 지역의 화살표만 따라가면 됩니다. 엑시트는 가격이 적정 수준에 도달하거나 시장의 고점 또는 저점 신호가 나타날 때 수행됩니다.  표시기는 PUSH 알림을 포함한 모든 유형의 경고를 제공합니다. 인디케이터 구매 후 연락주세요. 내 개인 거래 권장 사항과 훌륭한 보너스 지표를 무료로 공유합니다! 나는 당신에게 행복하고 유익한 거래를 기원합니다!
M1 Arrow
Oleg Rodin
4.73 (15)
시장의 두 가지 기본 원칙에 기반한 일중 전략. 알고리즘은 추가 필터를 사용하여 거래량 및 가격 파동 분석을 기반으로 합니다. 지표의 지능형 알고리즘은 두 가지 시장 요인이 하나로 결합될 때만 신호를 제공합니다. 지표는 더 높은 시간 프레임의 데이터를 사용하여 M1 차트에서 특정 범위의 파도를 계산합니다. 그리고 파동을 확인하기 위해 지표는 볼륨 분석을 사용합니다. 이 표시기는 준비된 거래 시스템입니다. 트레이더가 필요로 하는 모든 것은 신호를 따르는 것입니다. 또한 지표는 자신의 거래 시스템의 기초가 될 수 있습니다. 거래는 분 차트에서만 수행됩니다. 지표가 MTF 원리를 사용한다는 사실에도 불구하고 지표 알고리즘은 가능한 한 안정적입니다. 구매 후 반드시 저에게 편지를 보내주세요! 내 거래 설정 및 권장 사항을 공유하겠습니다!
Order Block Hunter
Noha Mohamed Fathy Younes Badr
5 (2)
Order block hunter indicator is the best indicator for  hunt the order blocks that area where there has been a large concentration of limit orders waiting to be executed Order blocks are identified on a chart by observing previous price action and looking for areas where the price experienced significant movement or sudden changes in direction .This indicator does that for you by using very complicated codes and helps you to take the best areas To buy and sell because it make marks at the best a
Backtest and Read Overview before purchase. Chart patterns have been a topic of debate among traders; some believe they are reliable signalers, while others do not. Our Chart Patterns All-in-One indicator displays various chart patterns to help you test these theories for yourself. The profitability of these patterns is not a reflection of the indicator's effectiveness but rather an evaluation of the patterns themselves. The Chart Patterns All-in-One indicator is an excellent tool for visualizin
제작자의 제품 더 보기
ON Trade Optuma Astro
Abdullah Alrai
5 (4)
물론입니다. 아래는 제공해주신 텍스트의 한국어 번역입니다: MT4용 천문학 지표 소개: 귀하의 최상급 하늘 트레이딩 동반자 트레이딩 경험을 천체의 높이로 끌어올리기 준비가 되셨나요? MT4용 천문학 지표를 소개합니다. 이 혁신적인 도구는 복잡한 알고리즘의 힘을 활용하여 탁월한 천문학적 통찰과 정밀한 계산을 제공합니다. 정보의 우주를 손에 담다: 천문학적 데이터의 보물함을 드러내는 포괄적인 패널을 살펴보세요. 행성의 지오/헬리오센트릭 좌표, 태양/지구 거리, 크기, 길이, 별자리, 황도 좌표 및 적도 좌표, 심지어 수평 좌표 등 각각이 정밀하게 계산되고 아름답게 제시됩니다. 지표에 의해 생성된 수직선은 시간 값에 해당하여 트레이딩 여정에 우주적인 시각을 부여합니다. 행성 라인과 관계: 수정 가능한 스케일과 각도로 차트를 장식하는 행성 라인의 마법을 경험해보세요. 직관적인 컨트롤 패널을 통해 각 행성의 라인의 가시성을 손쉽게 전환할 수 있습니다. 쥰션이나 섹스타일, 사분각, 삼분각, 트
간 스퀘어 지표는 W.D. 간이 쓴 "시장 예측을 위한 수학적 공식" 기사에 기반한 강력한 시장 분석 도구입니다. 이 도구는 수학적 개념과 간 이론을 사용하여 정확한 시장 분석을 수행합니다. 144, 90, 52의 제곱과 9의 제곱을 사용합니다. 또한 의 9의 제곱근 및 해당 제곱의 채널 및 스타 패턴과의 관련성을 통합합니다. 사용자 메뉴얼 및 적용: 이 지표를 사용하기 전에 사용자 메뉴얼을 읽고 질문이 있을 경우 문의하시기 바랍니다. 전체 메뉴얼은 웹사이트에서 제공됩니다. MT5의 전체 버전을 구매하거나 MT4의 무료 버전을 테스트할 수 있습니다. 두 버전 모두 링크에서 확인하실 수 있습니다. 주요 기능 및 기능: 간 스퀘어 지표는 정확한 결정을 위해 기하학적 개념과 간 이론을 활용하는 시장 분석을 위한 포괄적인 도구 집합을 제공합니다. 주요 기능은 다음과 같습니다. 9의 제곱 분석: 이 지표는 9의 제곱에 대한 수평 선, 스타 패턴, 그리드 및 간 팬을 그릴 수 있습니다. 간 이
ON Trade Waves Patterns Harmonic Elliot Wolfe를 소개합니다. 이는 수동 및 자동 방법을 사용하여 다양한 시장 패턴을 감지하기 위해 개발된 고급 지표입니다. 다음은 그 작동 방식입니다: 조화적 패턴: 이 지표는 차트에 나타나는 조화적 패턴을 식별할 수 있습니다. 이러한 패턴은 Scott Carney의 "Harmonic Trading vol 1 및 2"에서 설명한 것처럼 조화적 거래 이론을 연습하는 트레이더에게 중요합니다. 수동으로 그리든 자동 감지를 사용하든 ON Trade Waves Patterns가 도움을 줄 것입니다. 컨트롤 패널: 이 지표에는 사용자 친화적인 컨트롤 패널이 있습니다. 차트 및 시간 프레임 설정을 저장하여 다양한 구성 간에 쉽게 전환할 수 있습니다. 차트 공간을 최대화하려면 최소화할 수도 있습니다. 다른 분석 도구를 사용하는 것을 선호하는 경우 닫기 버튼을 클릭하여 모든 지표 데이터를 숨길 수 있습니다. 템플릿 저장: 설정을 사
Shepherd Harmonic Pattern
Abdullah Alrai
4.68 (59)
이 지표는 수동 및 자동 방법으로 차트에 그려진 고조파 패턴을 감지합니다. 사용자 매뉴얼은 다음 링크에서 확인할 수 있습니다. 리뷰를 작성하고 문의하면 무료 버전으로 MT4에서 제품을 시도할 수 있습니다. Gartley 및 Nenstar 패턴을 감지하는 데 사용할 수 있습니다. https://www.mql5.com/en/market/product/30181 전체 MT4 버전을 구입하려면 다음에서 구입할 수 있습니다. https://www.mql5.com/en/market/product/15212 참고 사항 지표에는 제어 패널이 있으며 모든 (차트 및 시간대) 설정을 저장합니다. 차트에서 더 많은 공간을 확보하려면 최소화할 수 있으며, 다른 분석 도구로 작업하는 것이 선호되는 경우 모든 지표 데이터를 숨기려면 닫기 버튼을 누를 수 있습니다. 이 지표를 사용하고 설정을 변경하면 이동 평균 또는 볼린저 밴드와 같은 지표를 추가하면 자동으로 템플릿을 저장하고 필요할 때 언제든지 로드할 수
이 인디케이터는 엘리어트 파동 이론과 두 가지 방식으로 작동합니다: 자동 작동: 이 모드에서는 인디케이터가 엘리어트 파동 이론에 따라 차트 상의 모든 5개의 모티브 웨이브를 자동으로 감지하고 예측 및 잠재적인 반전 지역을 제공합니다. 또한 중요한 개발 사항을 트레이더에게 알릴 수 있는 경보 및 푸시 메시지를 생성할 수 있는 능력을 갖추고 있습니다. 이 자동 기능은 엘리어트 파동 패턴의 식별과 분석 프로세스를 간소화합니다. 수동 작동: 이 옵션은 엘리어트 파동 이론을 수동으로 다루고 싶은 트레이더를 위해 설계되었습니다. 이를 통해 사용자는 아홉 가지 다른 등급을 사용하여 웨이브를 그릴 수 있습니다. 각 등급은 나타난 후에 차트에 그려진 라인을 조정하여 개별적으로 정의할 수 있습니다. 이 기능은 웨이브를 수동으로 그리는 프로세스를 간소화하며 더 효율적으로 만들어 줍니다. 중요한 점으로 모든 그림 데이터가 미래 참조를 위해 플랫폼 데이터 폴더에 저장된다는 것을 기억해야 합니다. 파라미터:
This indicator has a lot of numerology analyzing methods that can support your analyzes or can work as custom strategy by it self ..we will start to explain them one by one :  this the trial version of this product to have this product here is the link : https://www.mql5.com/en/market/product/118782   1- Range channel that draws the limits of daily movements to detect places of buy and places of sell . 2- Angler will detect Dynamic numeral levels that result of time and price squaring with cus
FREE
ON Trade Manager
Abdullah Alrai
5 (1)
이 제품을 사용하면 다양한 기능으로 주문과 계정을 관리할 수 있습니다. 1- 계정 크기/SL 크기/1 로트 크기의 페어 포인트 값에 따라 올바른 로트 크기를 계산합니다. 2- 라인 위치(타겟 sl tp)에 따라 현재 주문 상황을 알려줍니다. 3- 버튼을 1번 누르면 모든 주문 target/sl이 이동합니다. 4- 귀하의 계정에 대한 정보와 주문을 개시하는 데 필요한 증거금이 제공됩니다. 5- 모든 주문(기호 또는 전체)을 청산하는 기능이 있습니다. 6- 손익분기점 및 이익 보호 기능이 있습니다. 7- 모든 쌍에서 사용하기 쉽습니다. 리뷰를 추가하는 것을 잊지 마세요. 이 제품을 사용하면 다양한 기능으로 주문과 계정을 관리할 수 있습니다. 1- 계정 크기/SL 크기/1 로트 크기의 페어 포인트 값에 따라 올바른 로트 크기를 계산합니다. 2- 라인 위치(타겟 sl tp)에 따라 현재 주문 상황을 알려줍니다. 3- 버튼을 1번 누르면 모든 주문 t
FREE
Shepherd Gann Squares Free
Abdullah Alrai
4.86 (37)
이 지표는 W.D. Gann이 작성한 "시장 예측을 위한 수학 공식" 기사를 기반으로 하는 시장 분석 방법으로 9의 제곱과 144의 제곱 방법에 따라 다릅니다. 사용자 매뉴얼: Add Your review And contact us to get it 다음에서 전체 MT5 버전을 구입할 수 있습니다. https://www.mql5.com/en/market/product/28669 MT4에서 무료로 테스트할 수 있습니다. https://www.mql5.com/en/market/product/15316 이 제품은 레벨/스타/그리드/간 팬/으로 9의 정사각형을 그릴 수 있습니다. Gann Squares: 52/90/144도 그릴 것입니다. Chart 에 이동 가능한 Free Gann Star 를 직접 그립니다 . 그것은 또한 Gann 다이아몬드를 그릴 것입니다. 그것은 당신이 당신의 항목에 대한 최고의 로트를 계산할 수 있도록 로트 계산기
FREE
골드 그램 가격 계산기 인디케이터 소개 지역 통화에서의 금 가격을 항상 확인하고 싶으신가요? 더 이상 찾을 필요가 없습니다. 골드 그램 가격 계산기 인디케이터는 선호하는 지역 통화에서 그램 당 금 가격을 실시간으로 계산할 수 있는 혁신적인 도구를 제공합니다. 이 인디케이터를 통해 금융적인 통찰력을 활용하여 정보에 기반한 결정을 내릴 수 있습니다. 주요 특징: 지역화된 금 가격: 골드 그램 가격 계산기 인디케이터는 그램 당 금속 가격을 제공합니다. 구체적으로 그램 당 금 가격을 지역 통화에 맞게 조정한 것입니다. 이를 통해 익숙한 통화로 금 가치를 편리하게 추적할 수 있습니다. 사용자 친화적 설정: 우리의 인디케이터는 편의성을 고려하여 디자인되었습니다. 인디케이터 설정에서 직접 조정하거나 주요 차트에서 조정할 수 있어, 원활하고 맞춤화된 경험을 제공합니다. 매개변수 설명: Use_System_Theme (시스템 테마 사용): 선호하는 색상 스킴을 선택할 수 있는 옵션으로, 인디케이터의
FREE
ON Trade Pivots
Abdullah Alrai
ON Trade Pivots is A technical indicator that Draws all Pivot levels depending on time frame that defined in settings. Notes It will be good tool for all traders who use pivot levels in their trades. Let me inform you that this indicator draw this level as buffers not as objects then you can connect it easily to EA. This indicator allow you to find pivots levels for any time frame not only daily you are free to choose time frame from settings. Parameters Use_System_Visuals - Enable /Disable
FREE
이 인디케이터는 거래 차트에 돈치안 채널을 시각적으로 표시하는 목적으로 사용됩니다. 돈치안 채널은 특정 기간 동안의 최고점과 최저점 사이의 범위를 나타내는 간단한 기술 도구입니다. 이 인디케이터는 가격 움직임의 시각적 분석을 향상시키며 잠재적인 돌파 지점 및 추세 지속 포인트에 대한 통찰력을 제공합니다. 돈치안 채널은 현재 시간 프레임과 더 높은 시간 프레임 모두에 적용할 수 있으며 이 옵션을 활성화할 수 있습니다. 인디케이터 주요 기능: Use_System_Visuals: 이 매개변수를 활성화하면 시스템의 시각적 스타일 사용 또는 인디케이터의 외관을 사용자 정의할 수 있습니다. 활성화되면 인디케이터의 시각적 요소가 거래 플랫폼의 전반적인 테마에 일치하도록 조정됩니다. Signal_from_HT_Timeframe: 이 옵션을 활성화하면 더 높은 시간 프레임에서 신호를 수신할 수 있습니다. 다시 말해 더 긴 시간 프레임에서의 돈치안 채널 동작을 고려하여 현재 시간 프레임에서의 거래 결
FREE
이 인디케이터는 "회귀 채널 도구" 개념을 기반으로 한 강력한 시장 분석 방법을 제공합니다. 이 도구를 활용하여 트레이더는 차트의 회귀 채널을 탁월하게 제어하고 보다 근거 있는 거래 결정을 할 수 있습니다. 회귀 채널 도구는 트레이더 도구 상자 내에서 강력한 도구입니다. 가격 트렌드와 잠재적인 지지 및 저항 수준에 대한 유용한 통찰력을 제공하는 것을 목표로합니다. 이 도구는 특히 트렌드 내의 수정 웨이브를 시각화하는 데 효과적이며 가격 역학의 포괄적인 전망을 제공합니다. 이제 이 인디케이터의 주요 기능과 이점에 대해 더 자세히 살펴보겠습니다: 채널 수준 및 지지/저항: 이 인디케이터의 주요 장점 중 하나는 동적인 지지 및 저항 영역으로 작동하는 채널 수준을 생성할 수 있는 능력입니다. 이러한 수준은 잠재적인 진입 및 이탈 포인트를 식별하는 데 중요하며 거래 전략의 정밀도를 향상시킵니다. 수정 웨이브 수준: 수정 웨이브 수준을 활성화하여 트레이더는 큰 트렌드 내에서 잠재적인 수정을
"우리는 트레이딩 전략을 향상시키고 시장 트렌드에 대한 정확한 통찰력을 제공하기 위해 개발된 강력한 외환 인디케이터를 소개합니다. 이 혁신적인 도구는 세밀한 촛대 측정을 분석하고 최적의 정확도를 얻기 위해 조정을 수행하는 정교한 사용자 정의 알고리즘을 사용합니다. 결과는 차트에 정밀하게 배치된 화살표 세트로 전략적인 진입 지점을 표시합니다. 이 인디케이터의 창의력은 촛대 패턴의 힘을 활용하고 정밀하게 교정된 조정과 결합하는 능력에 있습니다. 이를 통해 시장 움직임에 대한 독특한 시각을 제공하며 거래 결정에 우위를 제공합니다. 이 인디케이터의 특출한 특징 중 하나는 H1 시간 프레임에서의 뛰어난 성능입니다. 이 시간 프레임에 특화된 트레이더들은 많은 정밀한 진입 기회를 제공한다는 것을 발견할 것입니다. 그러나 우리는 시너지의 힘을 믿습니다. 이 인디케이터 자체로도 강력한 도구이지만, 보다 포괄적인 트레이딩 전략에 통합될 때 그 성능은 더욱 높아집니다. 기존의 접근 방식과 결합함으로써
"이 인디케이터는 바이스트라 패턴 이론을 기반으로 한 입장을 감지하고 목표 및 중지 레벨을 갖춘 한정 주문을 놓을 수 있는 입장 가치를 제공합니다. 이를 통해 리스크 비율을 계산할 수 있습니다. 참고: 이 인디케이터에는 EA에서 사용할 수 있는 버퍼가 있습니다. 이 제품을 사용하는 동안 좋은 자금 관리를 실천하는 것이 중요합니다. 시간 프레임을 변경할 때, 인디케이터는 마지막 세션에서 사용한 템플릿을 저장합니다. 이 방법을 배우려면 구매 후 저희에게 연락하고 리뷰를 추가해주시기 바랍니다. 매개변수: 시스템 비주얼 사용 - 이 제품의 비주얼 테마를 활성화/비활성화합니다. 속도 관련 - 마지막 웨이브의 빠른 움직임 중에만 패턴을 감지하도록 활성화/비활성화합니다. 마지막 양식 카운터 표시 - 양식 타이머를 활성화/비활성화합니다. 양식 카운터 색상 - 양식 타이머 텍스트의 색상입니다. 상승 패턴 색상 - 상승 패턴의 색상입니다. 하락 패턴 색상 - 하락 패턴의 색상입니다. 알림 보내기 -
"Fibo Star" 지표는 별 모양으로 피보나치 팬을 차트에 표시하는 데 사용됩니다. 이 피보나치 팬은 가격 움직임을 분석하는 강력한 도구로, 잠재적인 지지 및 저항 레벨에 대한 통찰력을 제공할 수 있습니다. 이 지표는 그리기 및 설정 과정을 간편화하기 위한 사용자 친화적인 제어판을 제공하여 시간과 노력을 절약할 수 있도록 돕습니다. 사용 방법: 이 지표는 수동 사용을 위한 것입니다. 효과적으로 사용하려면 다음 단계를 따르세요: 피보나치 팬을 기반으로 할 고점과 저점을 차트에서 식별합니다. 이러한 고점과 저점에 보라색 선을 그립니다. 가격이 이러한 선과 상호 작용하면, 이 지표가 동적인 지지 및 저항 레벨로 작동하는 것을 관찰하세요. 매개변수: Use_System_Theme: 이 매개변수를 사용하여 지표의 외관을 거래 플랫폼의 전반적인 테마에 맞출지 또는 사용자 정의할지 선택할 수 있습니다. Levels_Color: 피보나치 팬의 레벨에 적용할 색상을 선택합니다. Levels_S
"통화 강도 인디케이터"는 외환 시장에서 서로 다른 통화의 상대적인 강도에 관한 정보를 제공하기 위해 개발된 강력한 도구입니다. 각 통화의 강도를 해당 시간 프레임을 기반으로 계산하고 표시함으로써 이 인디케이터는 특히 유의미한 발산이나 교차가 관찰될 때 잠재적인 거래 기회를 식별하는 기회를 제공합니다. 인디케이터의 주요 특징: 1. 통화 강도 계산: 이 인디케이터는 각 통화의 강도를 해당 시간 프레임을 기반으로 계산합니다. 이 계산에는 지정된 기간 동안 한 통화가 다른 통화들의 바구니에 대한 성과를 평가하는 과정이 포함됩니다. 이를 통해 트레이더는 각 통화의 상대적인 강도 또는 약함을 이해할 수 있습니다. 2. 수축과 발산: 두 통화의 강도 간에 수축 또는 발산 움직임이 있는 경우, 이는 잠재적인 거래 기회를 나타낼 수 있습니다. 예를 들어 한 통화가 상대적으로 강화되는 동안 다른 통화가 약화되는 경우, 가능한 진입 지점을 나타낼 수 있습니다. 3. 제로 레벨 교차: 이 인디케이터는
강력한 가격 행동 패턴을 감지하는 기술적 지표: 핀바, 인사이드 바, 아웃사이드 바 소개: 기술적 분석 분야에서 가격 행동 패턴은 잠재적인 시장 움직임의 중요한 지표로 기능합니다. 우리는 차트상의 견고한 가격 행동 패턴을 식별하는 데 도움을 주는 정교한 기술적 지표를 개발했습니다. 우리의 지표는 핀바, 인사이드 바, 아웃사이드 바라는 세 가지 중요한 패턴을 감지하는 데 특화되어 있습니다. 주요 감지 패턴: 핀바: 핀바 패턴은 시장 트렌드의 잠재적인 반전을 나타내는 단일 양초 형성입니다. 작은 몸체와 몸체 위나 아래로 튀어나온 긴 꼬리 또는 "위크"로 특징지어집니다. 상승 핀바는 가능한 상승 반전을 시사하며, 하락 핀바는 하락 반전을 시사합니다. 인사이드 바: 인사이드 바 패턴은 단일 양초의 전체 가격 범위가 이전 양초의 가격 범위 내에 들어가는 경우 발생합니다. 이 패턴은 임시적인 증시 합리화나 불확실성을 나타내며 종종 양방향으로의 돌파를 앞서는 신호로 작용합니다. 아웃사이드 바:
메타트레이더용 숫자로 이루어진 지지와 저항 인디케이터 소개: 메타트레이더용 숫자로 이루어진 지지와 저항 인디케이터로 기술적 분석의 새로운 차원을 경험해보세요. 이 독특한 도구는 숫자학의 힘을 활용하여 차트 상에서 주요 지지와 저항 레벨을 식별하여 가능한 가격 움직임에 대한 가치 있는 통찰력을 제공합니다. 주요 개념: 트레이딩에서의 숫자학: 숫자학은 숫자와 그들의 의미를 미스틱하게 연구하는 것으로, 트레이딩에 숫자학 원리를 적용하면 특정한 의미를 가진 숫자를 식별하고 이를 사용하여 매수 또는 매도 활동이 발생할 가능성이 있는 가격 레벨을 예측하는 것을 의미합니다. 인디케이터 기능: 우리의 인디케이터는 숫자학의 숨겨진 패턴을 활용하여 차트 상에 지지와 저항 레벨을 그립니다. 이러한 레벨은 금융 시장에서 중요한 의미를 가진 주요 숫자학 숫자에서 파생됩니다. 학습을 위한 선호되는 단계: 숫자학 이해: 인디케이터를 사용하기 전에 숫자학의 기본 개념과 트레이딩에서의 중요성을 이해하는 시간을 가
This indicator will give you entries as result of scalping strategy that will be applied on 14 symbols in same time and you are able to be notified with this entries  Note :   This indicator for scalping on 5 minutes timeframe only . How to use it : 1-Open chart and adjust settings (edit symbols names as your platform names , activate the alert system if you need it . 2-Wait for any signal you have it from this scanner you will have it as alert and as notification and you will see it on bo
This indicator gives you the signal of real cross on stochastic indicator. This indicator is easy to attach to an ea. This indicator will work best on All time frames. Arrow appears depending on many algorithms that study the cross parameters. Indicator properties Use_System_Visuals: enable/disable visual styles. Stochastic_K_Period. Stochastic_D_Period. Stochastic_Slowing. Use_Notifications: enable/disable Push Notifications. Use_Alert: enable/disable Alerts. Use_E_Mail: enable/disable Email
ON Trade VSA
Abdullah Alrai
"ON Trade VSA"를 소개합니다 - 볼륨 및 분포 분석을 위한 궁극적인 도구! 우리의 고급 인디케이터 "ON Trade VSA"를 사용하여 볼륨 스프레드 분석(VSA)의 힘을 발휘해 보세요. VSA는 시장 강도를 평가하고 추세를 식별하며 정보에 근거한 결정을 내리는 트레이더에 의해 사용되는 강력한 방법론입니다. "ON Trade VSA"가 여러분의 트레이딩 아카이브에서 빠질 수 없는 도구가 되는 주요 기능을 살펴보겠습니다: 다색 볼륨 캔들 : 평균 움직임을 기반으로 서로 다른 색상을 볼륨 캔들에 할당하는 독특한 기능을 통해 시장 역학을 파악할 수 있습니다. 이 직관적인 시각화는 시장 감정 변화를 빠르게 파악하는 데 도움을 줍니다. 강력한 트렌드 감지 : 저희의 인디케이터는 기본적인 것을 넘어서 있습니다. 그래프 상에서 가장 강력한 트렌드를 정확하게 식별하고 표시하여 주류 시장 방향을 명확히 볼 수 있게 해줍니다. 볼륨-레인지 곱셈기 : 범위에 볼륨을 곱하는 능력을 사용하여 숨
This product is a part of  ON Trade Waves Patterns Harmonic Elliot Wolfe you can test free version on EURJPY from this link  Wolf Waves Indicator 울프 웨이브(Wolf Waves) 발견하기 - 귀하의 궁극적인 거래 도구! 어떤 시간 프레임에서든 울프 웨이브를 쉽게 찾을 수 있는 강력한 도구를 찾고 계신가요? 더 이상 찾을 필요가 없습니다! 저희의 울프 웨이브 인디케이터는 이 작업을 쉽게 해내며, 여기서 왜 귀하에게 완벽한지 설명하겠습니다: 주요 기능: 자동 감지: 우리의 울프 웨이브 인디케이터는 복잡한 알고리즘을 사용하여 키 포인트를 자동으로 찾아 차트에 해당 선을 그립니다. 수동으로 패턴을 찾아 다니는 번거로움을 이제 더 이상 느낄 필요가 없습니다. 사용자 친화성: 이 인디케이터는 사용하기 간단하게 설계되어 있어 경험이 풍부한 트레이더든 울프 웨이브에 처음 접하
This program serves as an effective tool for sending messages through a Telegram bot using the MetaTrader platform. It enables you to send your trading recommendations related to the orders you open on the trading platform directly to your Telegram channel or group. These messages may include details about open trades and can be accompanied by illustrative images of the orders. Alternatively, they can be configured to be without images based on your preferences. This means that if you are the ow
우리의 새로운 지표를 소개합니다: [ON Trade Breakout Zone] 모든 트레이더를 위한 간단하면서도 강력한 시장 분석 도구! 프로와 초보 트레이더 모두에게 적합 당신의 거래 전략을 강화할 준비가 되셨나요? 우리의 최신 지표는 시장 분석을 간소화하고 모든 수준의 트레이더에게 자유로운 수익을 얻을 수 있는 열쇠입니다. 당신이 경험이 풍부한 전문가이든 막 시작한 초보자이든, [ON Trade Breakout Zone]은 시장의 잠재적인 이익을 해제할 수 있는 키입니다. [ON Trade Breakout Zone] 사용 방법: 이 지능형 도구는 매일 고급 알고리즘을 사용하여 차트에 손쉽게 영역을 그립니다. 여기에서 최대한 활용하는 방법입니다: 영역 식별: [ON Trade Breakout Zone]은 차트에서 핵심 영역을 정확하게 식별하여 잠재적인 거래 기회를 쉽게 발견할 수 있도록 도와줍니다. 거래 실행: 가격이 그려진 영역의 한 쪽으로 이동할 때까지 기
This indicator has a lot of numerology analyzing methods that can support your analyzes or can work as custom strategy by it self ..we will start to explain them one by one :   1- Range   channel that draws the limits of daily movements to detect places of buy and places of sell . 2-   Angler   will detect Dynamic numeral levels that result of time and price squaring with custom numeral method that works like support and resistant and will support your analyzes 3-   Shepherd Levels   it is l
ON Trend
Abdullah Alrai
트렌드 트레이딩의 힘을 마스터하세요 이 지표는 초보자, 중급자, 전문가 트레이더 모두를 위해 설계되었습니다. 모든 통화 쌍에서 실제 트렌드를 정확하게 감지하여 트레이딩 프로세스를 단순화합니다. 왜 이 지표를 선택해야 할까요? - 간단한 거래: 더 이상 복잡한 분석이 필요하지 않습니다. 지표를 차트에 로드하고 매수 또는 매도 신호를 기다리기만 하면 됩니다. 하루 종일 차트를 볼 필요가 없습니다. - 명확한 진입 신호: 지표는 매수 신호에 파란색 화살표, 매도 신호에 빨간색 주황색 화살표를 제공하여 정확한 진입 포인트를 제공합니다. 또한, 트렌드 라인은 현재 시장 트렌드를 확인하기 위해 색상이 변경됩니다. - 이상적인 타임프레임: 최상의 결과를 얻으려면 5분 타임프레임을 사용하는 것이 좋습니다. H1 타임프레임으로 지표를 다시 로드하여 신호를 확인하면 더 정확한 데이터를 얻을 수 있습니다. - 스캐너와 함께 사용 시 더욱 강력해집니다: 내장된 스캐너를 사용하여 모든 통화 쌍
ON Trade Gann Squares MT5
Abdullah Alrai
5 (1)
간 스퀘어 지표는 W.D. 간이 쓴 "시장 예측을 위한 수학적 공식" 기사에 기반한 강력한 시장 분석 도구입니다. 이 도구는 수학적 개념과 간 이론을 사용하여 정확한 시장 분석을 수행합니다. 144, 90, 52의 제곱과 9의 제곱을 사용합니다. 또한 의 9의 제곱근 및 해당 제곱의 채널 및 스타 패턴과의 관련성을 통합합니다. 사용자 메뉴얼 및 적용: 이 지표를 사용하기 전에 사용자 메뉴얼을 읽고 질문이 있을 경우 문의하시기 바랍니다. 전체 메뉴얼은 웹사이트에서 제공됩니다. MT5의 전체 버전을 구매하거나 MT4의 무료 버전을 테스트할 수 있습니다. 두 버전 모두 링크에서 확인하실 수 있습니다. 주요 기능 및 기능: 간 스퀘어 지표는 정확한 결정을 위해 기하학적 개념과 간 이론을 활용하는 시장 분석을 위한 포괄적인 도구 집합을 제공합니다. 주요 기능은 다음과 같습니다. 9의 제곱 분석:   이 지표는 9의 제곱에 대한 수평 선, 스타 패턴, 그리드 및 간 팬을 그릴 수 있습니다. 간
이 인디케이터는 "회귀 채널 도구" 개념을 기반으로 한 강력한 시장 분석 방법을 제공합니다. 이 도구를 활용하여 트레이더는 차트의 회귀 채널을 탁월하게 제어하고 보다 근거 있는 거래 결정을 할 수 있습니다. 회귀 채널 도구는 트레이더 도구 상자 내에서 강력한 도구입니다. 가격 트렌드와 잠재적인 지지 및 저항 수준에 대한 유용한 통찰력을 제공하는 것을 목표로합니다. 이 도구는 특히 트렌드 내의 수정 웨이브를 시각화하는 데 효과적이며 가격 역학의 포괄적인 전망을 제공합니다. 이제 이 인디케이터의 주요 기능과 이점에 대해 더 자세히 살펴보겠습니다: 채널 수준 및 지지/저항:   이 인디케이터의 주요 장점 중 하나는 동적인 지지 및 저항 영역으로 작동하는 채널 수준을 생성할 수 있는 능력입니다. 이러한 수준은 잠재적인 진입 및 이탈 포인트를 식별하는 데 중요하며 거래 전략의 정밀도를 향상시킵니다. 수정 웨이브 수준:   수정 웨이브 수준을 활성화하여 트레이더는 큰 트렌드 내에서 잠재적인
물론입니다. 아래는 제공해주신 텍스트의 한국어 번역입니다: MT4용 천문학 지표 소개: 귀하의 최상급 하늘 트레이딩 동반자 트레이딩 경험을 천체의 높이로 끌어올리기 준비가 되셨나요? MT4용 천문학 지표를 소개합니다. 이 혁신적인 도구는 복잡한 알고리즘의 힘을 활용하여 탁월한 천문학적 통찰과 정밀한 계산을 제공합니다. 정보의 우주를 손에 담다:   천문학적 데이터의 보물함을 드러내는 포괄적인 패널을 살펴보세요. 행성의 지오/헬리오센트릭 좌표, 태양/지구 거리, 크기, 길이, 별자리, 황도 좌표 및 적도 좌표, 심지어 수평 좌표 등 각각이 정밀하게 계산되고 아름답게 제시됩니다. 지표에 의해 생성된 수직선은 시간 값에 해당하여 트레이딩 여정에 우주적인 시각을 부여합니다. 행성 라인과 관계:   수정 가능한 스케일과 각도로 차트를 장식하는 행성 라인의 마법을 경험해보세요. 직관적인 컨트롤 패널을 통해 각 행성의 라인의 가시성을 손쉽게 전환할 수 있습니다. 쥰션이나 섹스타일, 사분각, 삼분
필터:
09122017109
86
09122017109 2024.02.22 16:34 
 

Класс

yalewang
1120
yalewang 2023.05.04 16:38 
 

good

raoufalr
74
raoufalr 2023.04.25 11:35 
 

사용자가 평가에 대한 코멘트를 남기지 않았습니다

GD Phillip
20
GD Phillip 2023.04.24 17:47 
 

Update: I initially had an issue with installation however Abdullah the software specialist offered to solve the issue which I found very commendable of him.

davevicens
321
davevicens 2022.12.23 17:44 
 

Good indicator and very accurate

Abdullah Alrai
41061
개발자의 답변 Abdullah Alrai 2022.12.23 17:48
Thank you .. enjoy
Kelli Bardley
217
Kelli Bardley 2021.11.26 02:03 
 

Very good indicator. It's accurate and easy to use. The seller also gives good customer service.

nicepls
30
nicepls 2021.10.03 20:39 
 

very useful thank you

Corrado Bruni
378
Corrado Bruni 2021.09.29 08:51 
 

I have been using Harmonic for 3 years and continue to use it. It helps me a lot in harmonic patterns and divergences. Great tool.

Abdullah Alrai
41061
개발자의 답변 Abdullah Alrai 2021.10.01 13:20
thanx sir
Florin Dumitru
92
Florin Dumitru 2021.04.10 21:19 
 

Cool tool ! Very useful ...for a free indicator. Good job !

Abdullah Alrai
41061
개발자의 답변 Abdullah Alrai 2021.04.10 21:25
Thank you florin i appreciate that from u
adnanadnan
824
adnanadnan 2021.04.10 15:06 
 

will rate later

Borst18
198
Borst18 2021.03.30 15:17 
 

Thank you!!!

Abdullah Alrai
41061
개발자의 답변 Abdullah Alrai 2021.04.10 15:07
Welcome mr can u add stars please
Ali Khalil Abdulhassan Janabi
121
Ali Khalil Abdulhassan Janabi 2021.03.27 09:52 
 

مالذي يقدمه الموشر المدفوع عن المجاني ما هي المميزات الاضافية في المدفوع شكرا؟

Abdullah Alrai
41061
개발자의 답변 Abdullah Alrai 2021.03.27 10:05
Thanks for review mr..
The paid version just have availability to detect all patterns
Corneliu Raileanu
222
Corneliu Raileanu 2021.03.24 13:12 
 

My problem with the indicator is that it repaints the whole screen; that is the background and candles. Also, the email alert seems not to function; the pattern popped up but no email was sent. Otherwise, I give it 5 stars from 5, there are additional benefits attached to it. :)

Abdullah Alrai
41061
개발자의 답변 Abdullah Alrai 2021.03.24 13:16
Thanks for review first mr harmonic at its main theory is repainting ... Cause price should move inside ranges and that make the repaint and also note that this predectied reversing zones (ranges) is static and dont repaint and we depend on it ...
For the candles color you can select as you like from settings by disabling use system visuals function...
And for email alert for sure it works but you should run it from mt4 settings first before you use it in work just test it ...
8601567
779
8601567 2020.12.10 00:09 
 

This has much work put into it and you cannot complain about the price since it is free w/ limitations. It appears to draw patterns. My only criticism is it sucks the life out of my computer. Always puts it into a "freeze" zone and I have to wait for it to get its life back or alt-ctl-del and try again. The reason for 3 stars is because I am not sure how the paid indicator will not freeze my computer like the free one.

Abdullah Alrai
41061
개발자의 답변 Abdullah Alrai 2020.12.10 01:57
Thanksr for your review ... This product depend on so complicated algorithm that work to find the patterns like humen do.. because of that you can run it on 4 charts as normal work .. Paid version doing same what free do but without limitations on detected patterns.. We are so glad with your review ... Thank you verry much
pdg Steven
37
pdg Steven 2020.10.05 00:19 
 

I LIKE THE HARMONIC SIGNALS AND THE PRICE ACTIONS SIGNALS IN THE VERSION DEMO I MADE PROFIT

Valentin Butorin
4124
Valentin Butorin 2020.10.02 06:44 
 

Good job. Thanks for sharing

Yvonne
1049
Yvonne 2020.06.25 10:27 
 

I have been using the free version of this product in conjunction with the Stochastics indicator by the same author and it produces big profits - just watch your RR ratio.

Mikhail Ryzhachenko
969
Mikhail Ryzhachenko 2020.05.28 12:04 
 

Хорошая работа!

Amir shabani
107
Amir shabani 2020.05.07 21:41 
 

Nice

Aravind Kolanupaka
8925
Aravind Kolanupaka 2019.11.12 10:00 
 

사용자가 평가에 대한 코멘트를 남기지 않았습니다

12
리뷰 답변
버전 9.7 2023.04.12
- Bug Fix
버전 9.6 2022.12.18
- Bug Fix
버전 9.5 2022.04.03
- Many improvements on panel and buffers
버전 9.3 2020.05.29
- Improve Code.
- Improved Saved Data .
- Add TP3 Buffer .