RSI Scanner
- 유틸리티
- Tetyana Shcherba
- 버전: 1.3
- 업데이트됨: 25 7월 2018
- 활성화: 5
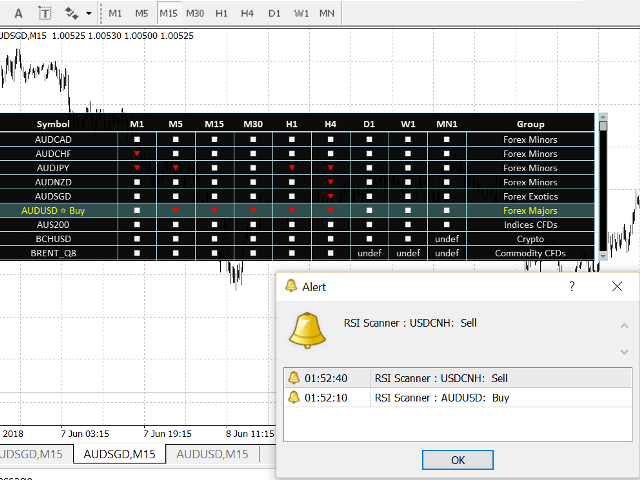
Utility is designed to monitor and analyze the market conditions for all symbols of the MetaTrader 4 terminal using real-time data from the RSI indicator.
- Automatically detects all the pairs in your terminal, and also can filter them into groups.
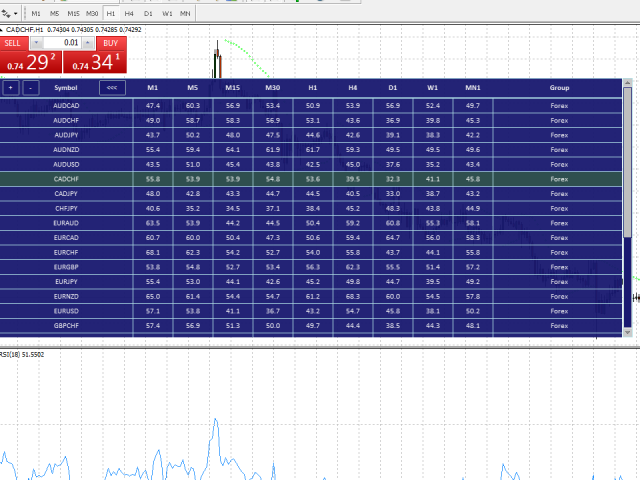
- Gets the RSI indicator data for all timeframes and all selected pairs.
- Tracks up to 4 programmable signal patterns and notifies when they appear.
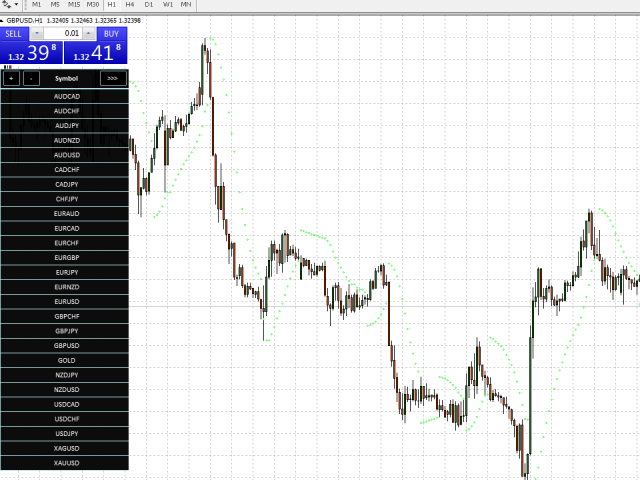
- Automatically opens a new chart for a given template when you click the desired pair in the table.
Input parameters
- Pairs to be scanned - select the scan mode (scan symbols from the list or search all available in your terminal).
- Currency Pairs list - list of scanned pairs for the scan mode "From 'Currency Pairs list' below".
- Do not scan groups from this blacklist - names of symbol groups to not be scanned, separated by commas (blacklist), if empty then the filter is disabled.
- Scan groups only from this whitelist - names of symbol groups to be scanned, separated by commas (whitelist), if empty then the filter is disabled.
- Refresh rate - data refresh rate (in seconds).
- Display the RSI-values - show indicator values or only icons.
- Table area color - color of the table.
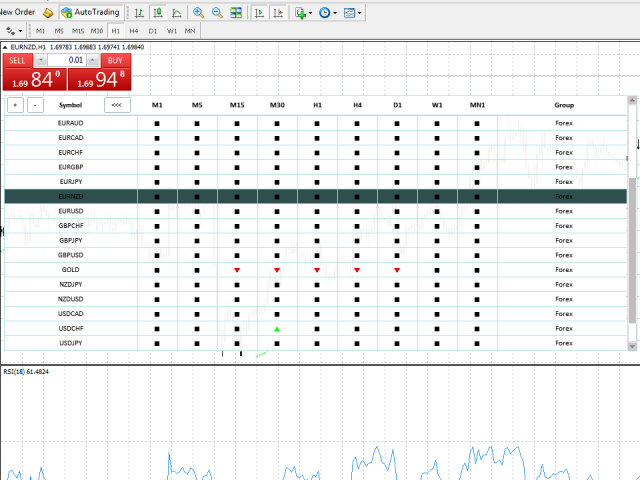
- Overbought color - color of the overbought icon.
- Oversold color - color of the oversold icon.
- Normal color - color of normal state of the symbol.
- Alerts, Email Notification, MetaQuotes ID Push Notification - various method of notification about new signals. Do not forget to set up email and MetaQuotes ID in your terminal.
- Minimum time between identical signals - the minimum time delay between repetitions of identical signals.
- RSI Max. Level, RSI Min. Level, RSI period, RSI price calculation, RSI shift - standard input parameters of the RSI indicator.
- Use signal pattern_ (1,2,3.4) - search for patterns of the signal (1,2.3.4).
- Name - name for each of the 4 signals.
- M1, M5, M15, etc. - adjustable signal patterns based on the RSI values for each timeframe. A signal is considered valid when all patterns match the actual status of RSI for each timeframe. If any of the timeframes is not used, then the actual status of RSI on this timeframe can be any.
Addendum
RSI is an excellent indicator that determines the strength of the trend and the probability of its change. It allows you to easily determine the overbought or oversold state in the market.
I hope my utility will save you time, help you quickly and conveniently analyze the market and always be aware of what is happening.

