Future Waves
- 지표
- Shailesh Mishra
- 버전: 1.10
- 업데이트됨: 11 7월 2018
- 활성화: 5
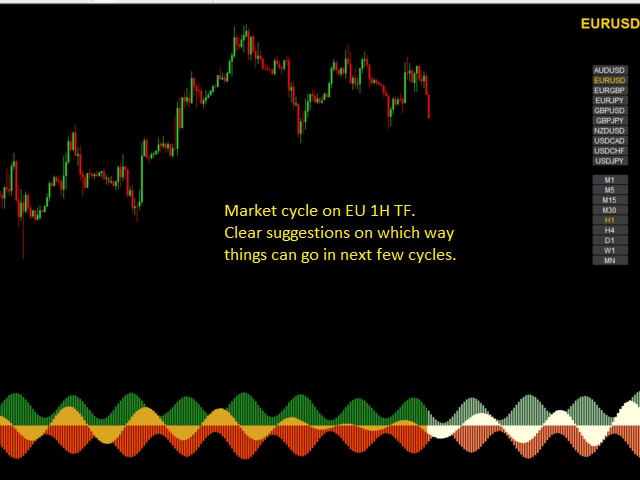
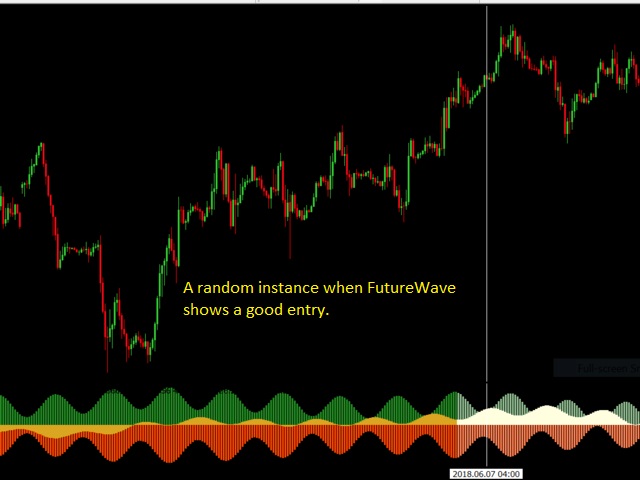
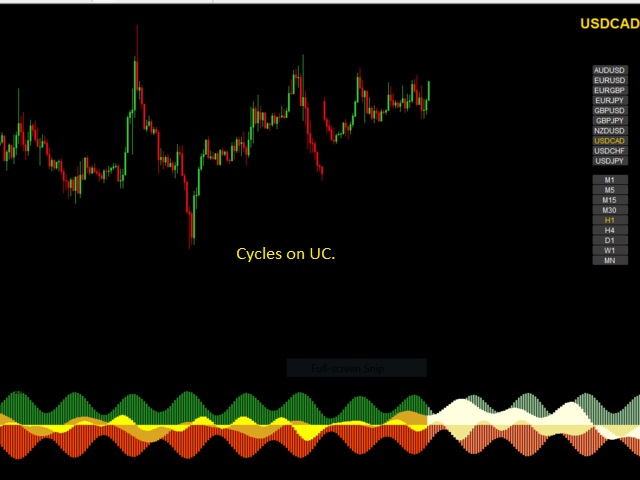
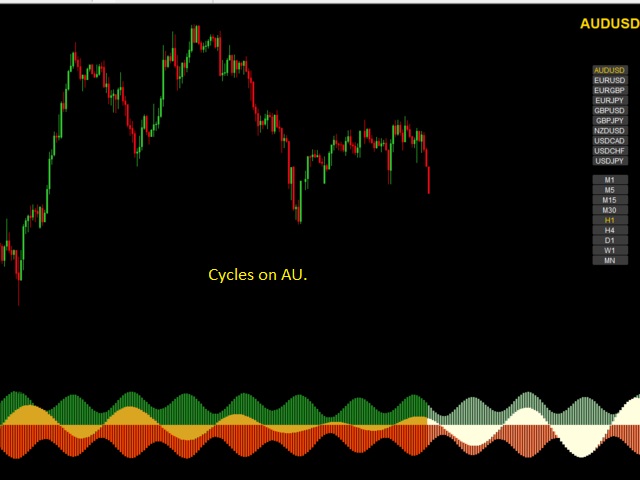
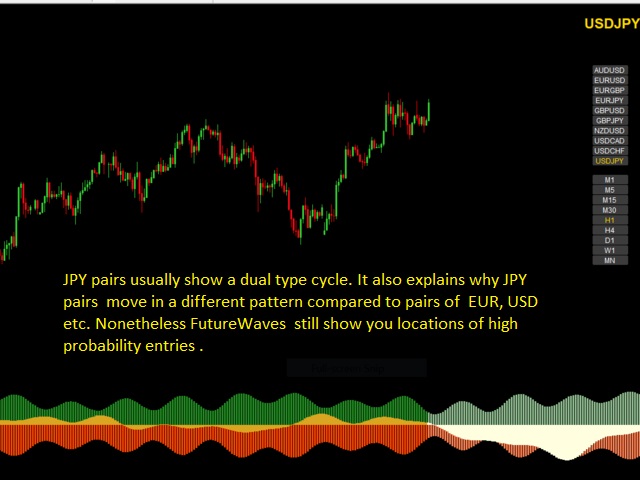
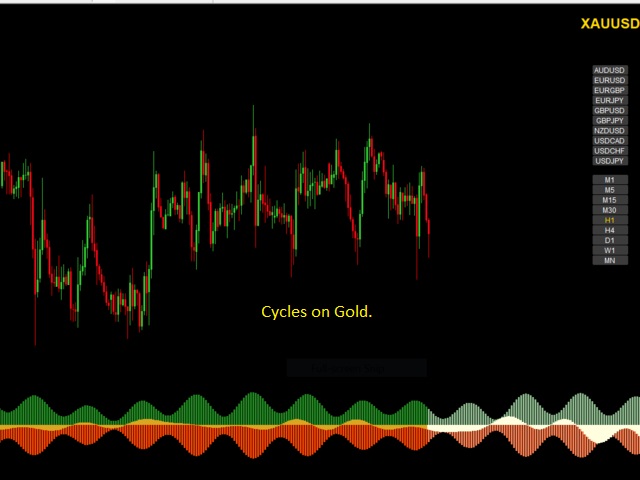
It is well known that market moves as waves and in cycles. The FutureWaves indicator looks at various such cycles present in the market and projects those cycles into future to give a indication as to what may happen and what can be the biases present in each coming cycle. The indicator can be used for Binary options and fx trading.
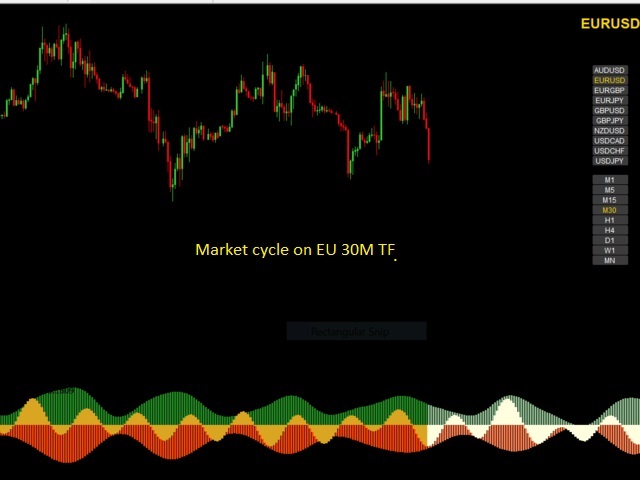
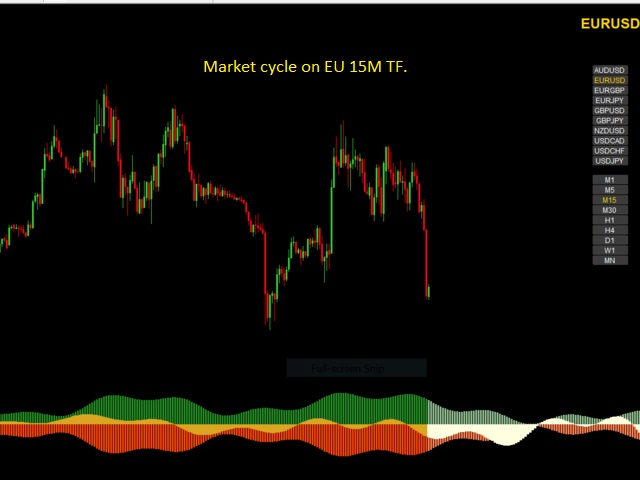
Green histogram should be seen as the strength of buyers and red histogram that of sellers. Both the bias and the sync waves should be seen as the imbalances between the two. If its above zero, the buyers are more than sellers and naturally one should expect the prices to rise and vice versa.
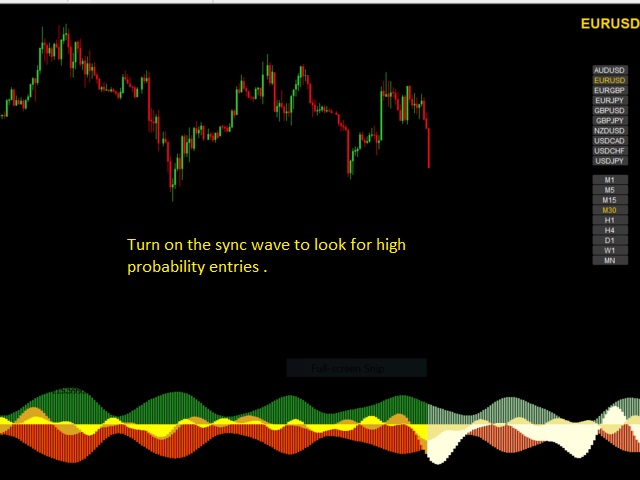
Normally it is advised to do a MTF analysis starting from H4 TF and go down to lower timeframes. Although other approaches are also possible. It is possible to turn on the sync wave and decide on entries when sync wave goes together with bias waves. It is also advisable to trade with trend.
Input Parameters
- Last bar in past data: Setting it to a integer value 'n' means indicators uses all data till n candles ago for calculation. By default n=0, but this can be changed for easy back testing or in using strategies which might involve loading multiple instances of indicator with different values
- Number of past bars: Number of past candles used for calculation. Ideally this should cover a market cycle. For example using a value of 240 on M1 TF will cover the 4 hour cycle.
- Number of bars to predict: Number candles in future till the cycle be extrapolated. This number is user dependent. Usually closer cycle are more accurate than the ones further ahead in time.
- Number of frequencies: Number of cycles to be computed. By default this is 8. Using a very high number will also increase the noise.
- Tick by tick calculation: Choose true for calculations to be updated every tick. This will occupy more computing resources.
- Turn on additional synchronization: Choose true to see the additional sync wave.
- Delta amplification factor: Use this for easier visibility of bias and sync waves. on M1 TF a value of 2 or 3 should suffice. This number should be increased for higher TFs.
- Turn on price line: The behavior or price line is expected to be same as sync wave. But it involves a very different calculation. Expect it to behave a bit differently during hyperextended moves, high volatility, etc.
- Price scaling factor: Change this number so that price line forms a nice envelope over sync wave. This will help for easy visualization. For non-JPY pairs this number should be close to the delta amplification factor. For JPY pairs it can recommended to start with a value 100 times less than the delta amplification factor, that is, if delta amplification factor = 2.0, try starting with price scaling of 0.02, etc.

