AirShip
- 지표
- Xiaoming Qian
- 버전: 1.0
- 활성화: 9
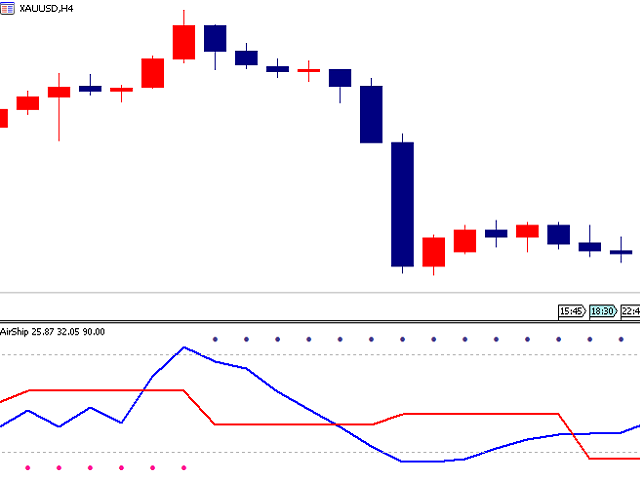
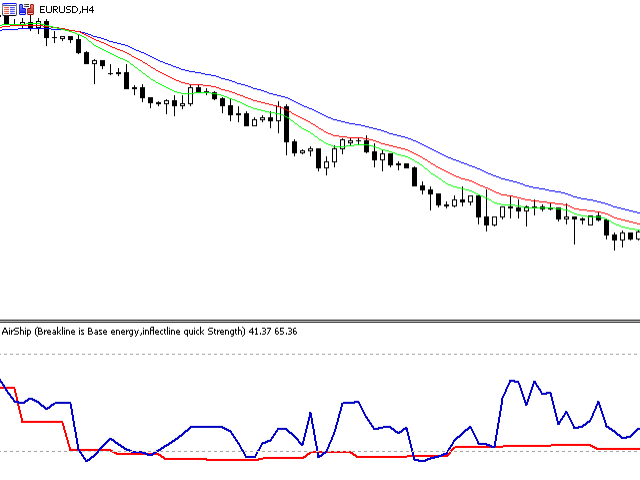
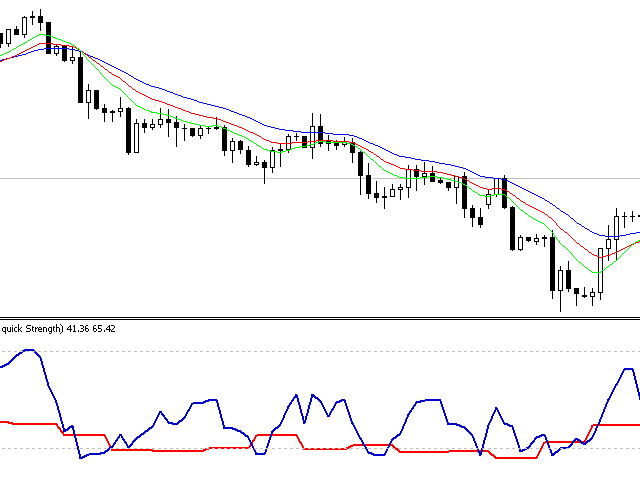
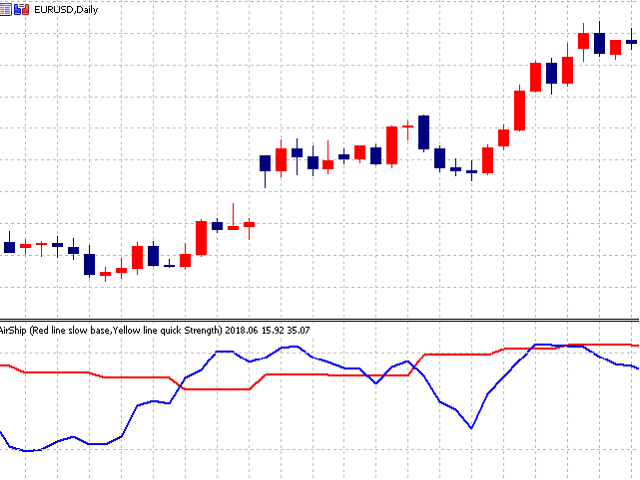
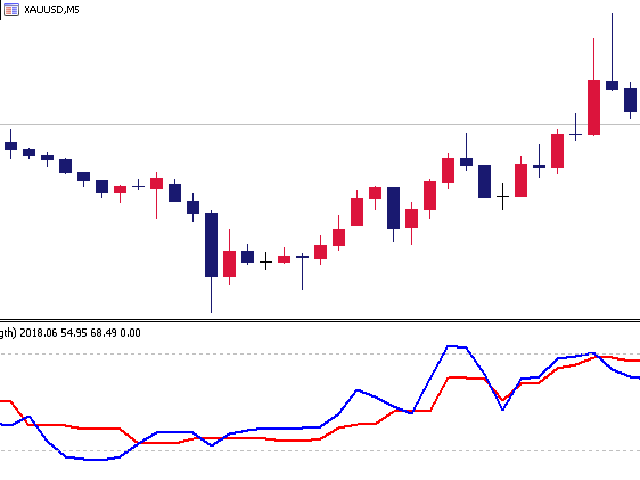
The AirShip indicator can help you to confirm the trend. The red dots mean uptrend, and the green dots mean downtrend. The AirShip indicator provides open and close positions signals when reaching overbought or oversold levels. It has a smart algorithm that detects the trend changes. If the trend reached the end of phase, the yellow dots will send you the notification. The AirShip indicator not only draw the red trend lines and the yellow trend lines using a multicriteria strength engine, but also combines it with multitimeframe trend analysis.
The AirShip indicator is very easy to use. It does not redraw its signals.
How to Trade
You can trade in following modes:
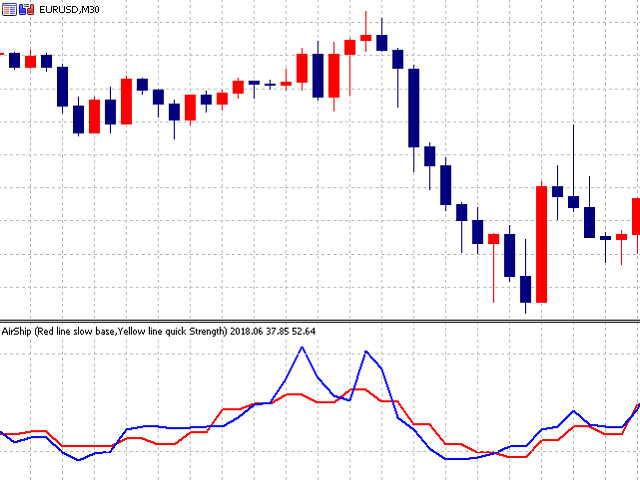
- The distance between the red line and the yellow line is too large. The greater the difference between the two lines, the stronger the trend changes of yellow line.
- Looking for the divergences in overbought and oversold levels.
- If red line is under 25 and then crosses this level upwards, and the price is already above its simple moving average, this is a sign for the beginning of a new ascending trend.
- If red line is above 75 and then crosses this level downwards, and the price is already below its simple moving average, this is a sign for the beginning of a new descending trend.
- You can trade any timeframe you want.
Indicator Parameters
- Trendcolordots - the best dots filter. The higher the value, the more "noise" in signals of trendcolordots. The dots will different.
- Trendcolor dots 1 - the trend of long period.
- Trendcolor dots 2 - the trend of Middle period.
- Trendcolor dots 3 - the trend of Short period.
- no color dots - hide the dots.
