Reversal zones x2
- 지표
- Andrii Malakhov
- 버전: 1.1
- 업데이트됨: 14 9월 2019
- 활성화: 5
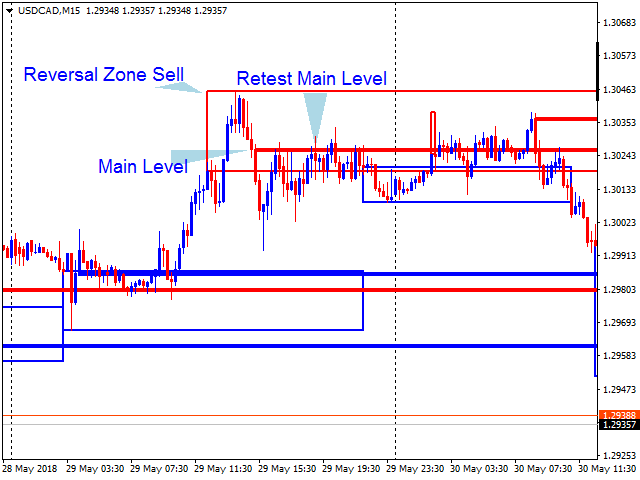
The indicator looks for buying and selling zones, where a deal can be opened with a minimal stop loss and a better Risk Reward Ratio. The indicator is based on qualitative search of the Double top/Double bottom pattern.
Indicator operation principle
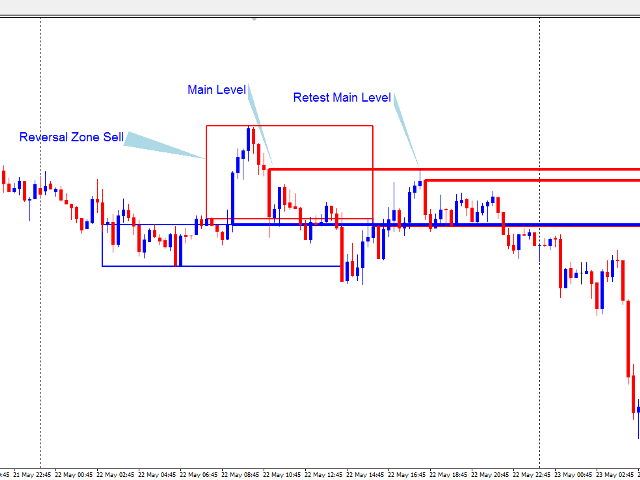
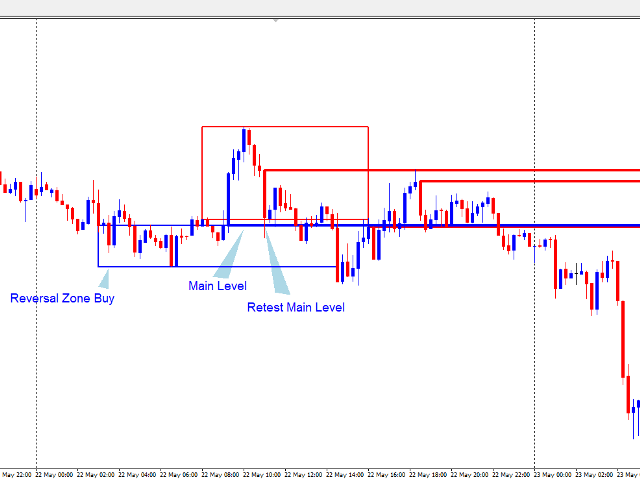
- Looks for local tops/bottoms which can potentially become a Reversal zone
- It waits for an impulse movement that would exceed the Reversal zone and draws a red/blue wide rectangle
- Within the Reversal zone, it looks for the strongest area of the zone - Main level.
Further actions of the trader:
- Wait for the price to return to the Reversal zone (retest) and touches the Main level.
- Find any reversal candlestick pattern near the Main level. This can be done with the help of the Pivot Point Reversal x2 indicator
- Open a deal. Set the stop loss to a zone. Set the take profit based on the TakeProfit Levels x2 or MACD_stopper x2 indicator
- Manage the deal manually or wait to receive TP/SL
Setting up the indicator
- Days painting - the number of days in a row to look for Reversal zones and Main levels.
- Min zone width, pip - the minimum width of a zone. 100 pips are optimal for most instruments. For indices and oil - 30 pips.
- Min impulse width, pip - the minimum distance the price should pass after leaving a Reversal zone for this zone to be formed. 100 pips are optimal for most instruments. For indices and oil - 30 pips.
- Fill square - fill the Reversal zones. Recommended value is "false".
- Find Main Level in reversal zones - search for the Main level in reversal zones. Recommended value is "true", since the Main level is the most important point in a reversal zone.
- Cut far zones - trim distant Reversal zones. Default is "true".
- Buy reversal zone color - color of a Reversal zone for buying.
- Buy Main Level color - color of the Main level for buying.
- Sell reversal zone color - color of a Reversal zone for selling.
- Sell Main Level color - color of the Main level for selling.
There is also a free version of the indicator working on USDCAD only - https://www.mql5.com/en/market/product/29819
P.S. If you have any questions about the operation of the indicator, feel free to ask them in the Comments or in private messages.