Double divergence scanner
- 지표
- Jan Flodin
- 버전: 3.0
- 업데이트됨: 28 8월 2023
- 활성화: 10
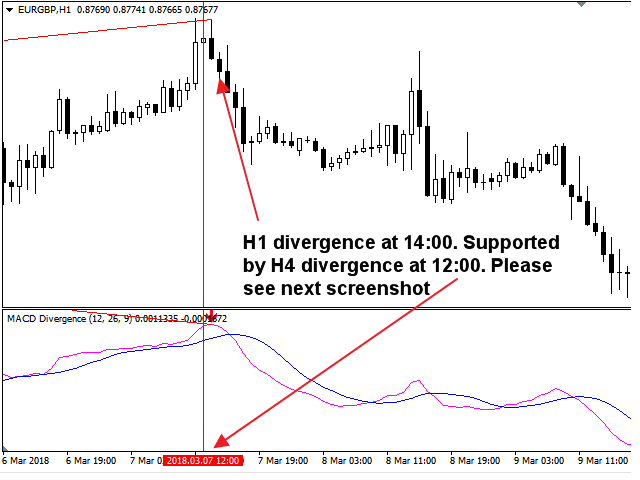
This multi indicator/oscillator (hereafter indicator), multi time frame and multi symbol indicator identifies when a divergence occurs between price and one, two or three indicators. It identifies both regular/classical (trend reversal) and hidden (trend continuation) divergences. It has RSI and MA trend filter options which makes it possible to filter out only the strongest setups. Combined with your own rules and techniques, this indicator will allow you to create (or enhance) your own powerful system.
It can be used in 3 ways:
- Set both main and second/third indicator and leave the default value 'current' as Second time frame. By doing this you will get alerts only when there is a double divergence on each time frame which you have selected.
- Set both main and second/third indicator and set the time frame for second/third divergence to for instance H4, or set 'One time frame higher' to True. By doing this you will only get alerts when there is a second/third divergence also on the H4 time frame or on one time frame higher than the main divergence.
- Set only main indicator. By doing this you will get alerts when there is a divergence on the selected indicator.
Features
- Can detect divergences for the following indicators: MACD, Stochastics, OsMA, RSI, CCI, Awesome (AO), ADX, ATR, OBV, MFI, Momentum and Composite Index.
- Can monitor all symbols visible in your Market Watch window at the same time. Apply the indicator to just one chart and instantly monitor the entire market.
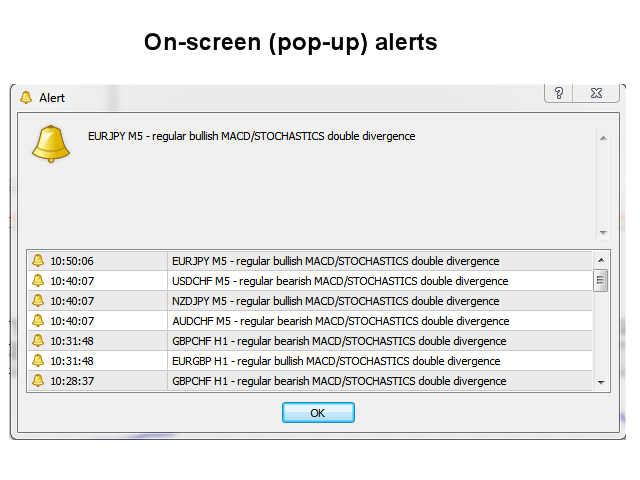
- Can monitor every time frame, from M1 to MN, and sends you a real-time alert when a divergence has been identified. All Metatrader native alert types are supported.
- Can also be used in single chart mode (scanning only current chart).
- The indicator includes an interactive panel. Please see separate screenshot for explanation.
- The indicator can write the signals to global variables or a file which can be used by an Expert Advisor for auto trading.
Input parameters
Please find the description and explanation of the input parameters here.
Important
Please note that due to the multi time frame functionality, this indicator will not draw lines and arrows or sell and buy advice on the chart where the indicator has been installed. For this purpose you need to create a chart template with my free divergence indicator. It is highly advisable to put the indicator on a clean (empty) chart without any other indicators or Expert Advisors on it which could interfere with the scanner.


I'm testing for a while, but it looks very interesting, I'm a beginner, I must first understand. The support from Mr. Jan is excellent