Panel of signals MT5
- 유틸리티
- Mikhail Mitin
- 버전: 1.0
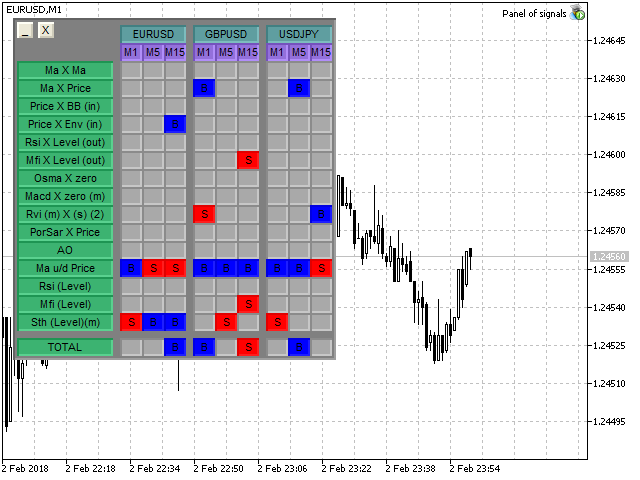
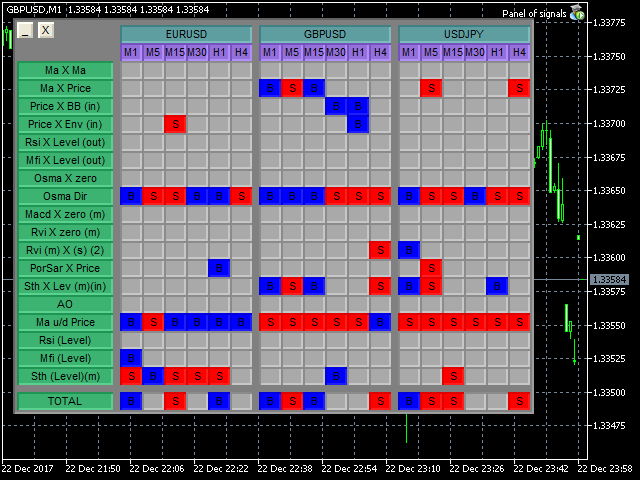
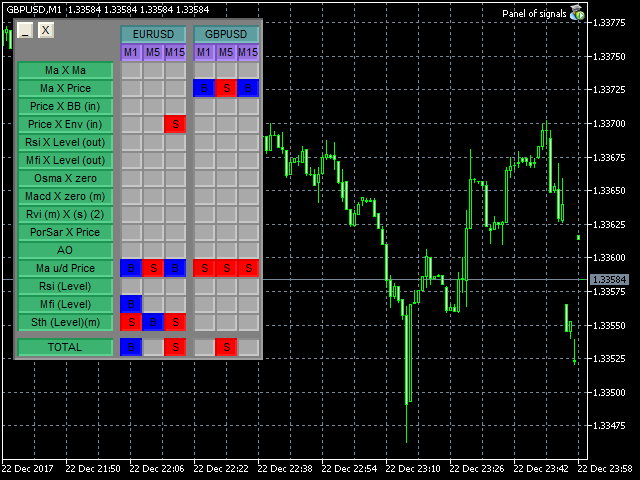
"All in One" panel.
You can simultaneously control:
- up to 3 symbols;
- up to 6 periods;
- up to 31 popular signals.
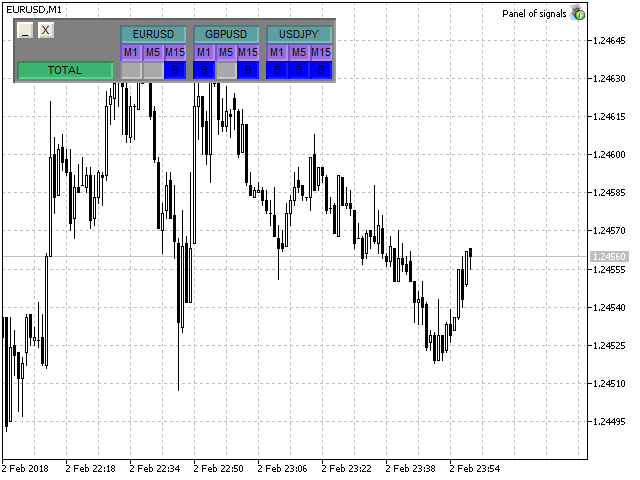
You can see the sum for all signals taking into account the weight of the signal
Version for MetaTrader 4: https://www.mql5.com/ru/market/product/27880
Version for MetaTrader 5: https://www.mql5.com/ru/market/product/27830
Parameters
- NUM_BAR - number of the bar to analyze (set a value greater than 0 to work on closed bars).
- timeframe_1....timeframe_6 - working timeframes (if set to "current", the timeframe will not be used).
- symbol_1....symbol_3 - names of used symbols (if the field is left blank, the symbol will not be used).
- separate parameters for each signal
- a separate weight for each signal (if weight = 0, then the signal is not used).
- weight_MIN_for_total - the "TOTAL" field shows the sum of the signals for each timeframe, for each symbol, with the signal weight taken into account. This parameter sets the minimum value for outputting the result to "TOTAL".
Description of the signals
- "Ma X Ma" - intersection of 2 MA.
- "Ma X Price" - intersection of MA and the price.
- "Price X BB (out)" - price exceeds the bounds of the Bollinger Bands.
- "Price X BB (in)" - price returns within the bounds of the Bollinger Bands.
- "Price X Env (out)" - price exceeds the bounds of the Envelope.
- "Price X Env (in)" - price returns within the bounds of the Envelope.
- "Rsi X Level (out)" - Rsi exceeds the bounds of buy out/sell out.
- "Rsi X Level (in)" - Rsi returns to bounds of buy out/sell out.
- "Mfi X Level (out)" - Mfi exceeds the bounds of buy out/sell out.
- "Mfi X Level (in)" - Mfi returns to the bounds of buy out/sell out.
- "Osma X zero" - OsMA crosses the "0" line.
- "Osma Dir" - OsMA direction (inclination of the histogram from the NUM_BAR bar to the NUM_BAR+1 bar).
- "Macd X zero (m)" - Macd histogram crosses the "0" line.
- "Macd X zero (s)" - Macd signal line crosses the "0" line.
- "Macd (m) X (s)" - Macd signal line crosses the histogram.
- "Rvi X zero (m)" - Rvi main line crosses the "0" line.
- "Rvi X zero (s)" - Rvi signal line crosses the "0" line.
- "Rvi (m) X (s) (1)" - Rvi main line crosses the signal line in any zone.
- "Rvi (m) X (s) (2)" - Rvi main line crosses the signal line, for the BUY signal in the negative zone, for the SELL signal in the positive zone.
- "PorSar X Price" - change in the direction of the PorSAR indicator.
- "Sth X Lev (m)(in)" - stochastic returns to the bounds of buy out/sell out (main line).
- "Sth X Lev (m)(out)" - stochastic exceeds the bounds of buy out/sell out (main line).
- "Sth X Lev (s)(in)" - stochastic returns to the bounds of buy out/sell out (signal line).
- "Sth X Lev (s)(out)" - stochastic exceeds the bounds of buy out/sell out (signal line).
- "Sth (m) X (s)" - stochastic mail line crosses the signal line.
- "AO" - Awesome Oscillator: 2 green bars in the "+" zone followed by 2 red bars - buy; 2 green bars in the "-" zone followed by 2 red bars - sell.
- "Ma u/d Price" - Ma above of below the price.
- "Rsi (Level)" - Rsi is beyond the bounds of buy out/sell out.
- "Mfi (Level)" - Mfi is beyond the bounds of buy out/sell out.
- "Sth (Level)(m)" - stochastic is beyond the bounds of buy out/sell out (main line).
- "Sth (Level)(s)" - stochastic is beyond the bounds of buy out/sell out (signal line).
The number of signals will increase. You can leave requests for adding signals in the comments.






















GOOD