• 미리보기
  • 리뷰
  • 코멘트
  • 새 소식

TickDelta

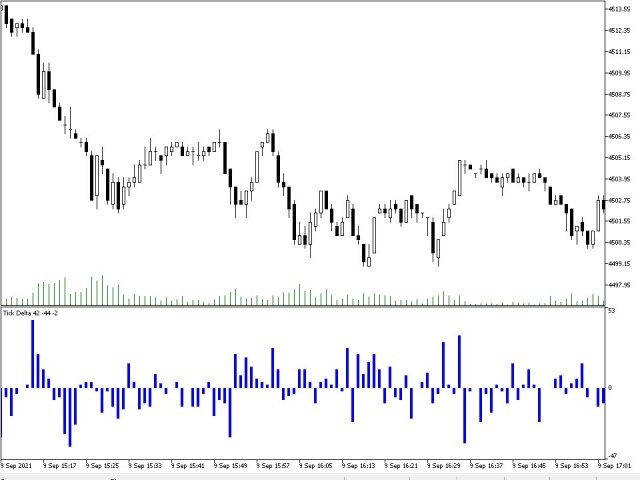
The TickDelta indicator shows the difference in the number of oscillations of the best prices per unit of time. In this case, the unit of time is the specified timeframe (M1, M2, M5, M15, etc.). This value indirectly shows the market "sentiment". Due to the "tick-wise" nature, the indicator is more appropriate for use in scalping strategies. When applied in conjunction with real volumes and monitoring of various instrument charts, it is possible to identify certain reversal setups. In some cases, the indicator will point at trend continuation. The indicator can be applied for autotrading or for automated search for market regularities at the initial stage, using it in a custom program for analysis.

The tick delta can also be applied in conjunction with other indicators for filtering the market entry signals. It all depends on the way the indicator application is considered and how a trader uses it.

The indicator settings are simple and consist of selecting the histogram color and column width selection. The first version has a limitation. It does not save the tick history. Therefore, when switching timeframes or modifying the indicator settings, the countdown will start anew. This shortcoming will be fixed in the next version.

Do not confuse the indicator values with the real delta, which is related to the performed buy and sell deals.

추천 제품
Pivots Lines
Abakou Nazaire Ayelenou
모든 시간대에 Traditionnal, Fibonacci, Woodie, Classic, Demark, Camarilla의 피벗 포인트 그리기 모든 유형의 피벗 Traditionnal, Fibonacci, Woodie, Classic, Demark, Camarilla 지원 모든 기간 지원(M1...H1...D1...MN1...매년) 서버 일광 절약 시간제 지원 시드니에서 미국으로 열리는 외환 일일 섹션 지원 닫기 암호화 거래 지원 피벗과 추세 사이의 간격을 채우면 매우 유용합니다. 피벗 포인트는 추세의 방향을 보여주고 수요와 공급을 모니터링하기 위한 결정적인 영역을 제공합니다. 추세 지표로서 피벗 포인트는 주로 감상적 분석에 도움이 됩니다. PP보다 높은 가격은 강세를 나타내고, PP보다 낮은 가격은 시장에서 약세를 나타냅니다.
VWAP Bands
Rafael Caetano Pinto
This indicator uses VWAP and projects this VWAP into up to 3 levels, shifted by a percentage of the chart's symbol. How to configure: Choose the symbol and desired graphic time Set the start time of the symbol (in bovespa, WIN and WDO start at 9 o'clock). This time is used as the cutoff reference for VWAP. Check which VWAP period fits the chart better: Ideally, a period when VWAP is not too distant from the chart Set percentage levels: Ideally, you should set levels based on history, so that l
BTFX Pivot Points
Bradley Thomas Farrington
The BTFX Pivot Points is an indicator which calculates the Support and Resistance levels for each day. By using this indicator the pivot levels point out clear targets to aim for. The resistance levels are shown in purple above the silver pivot line. The support levels are shown in Orange and can be found below the silver pivot line. This indicators works very well when used with The BTFX Daybreak Indicator. For a more in depth explanation of these indicators please watch the Youtube video attac
FibExtender
Syed Oarasul Islam
This Indicator draws Fibonacci Extension levels in two different ways. You can select whether to draw Fibonacci Extension levels based on your favourite ZigZag settings or you can let the indicator to draw Fibonacci Extension  level based on given number of Bars or Candles.  You can also set Mobile and Email notification for your favourite Extension  levels individually. With this indicator you will not have to feel lonely as the it can generate Voice alerts, which will keep you focused on your
This indicator watch the Fibonacci retracement for levels and timeframes selected by the trader. In the workload of day trading, having your eyes on all the timeframes to validate some information, for Fibonacci traders, is really time consuming and requires constant focus.  With this in mind, this tool allows you to have your attention on other trading details while this one monitors the retracements of each timeframe in real time. In the charts, this indicator data (retracement %, age of the r
Ultimate Fibonacci Trader
Philip Effiong Philip
Whether you're an analyst looking for a Fibonacci charting platform for Fibonacci Ratio analysis, or a trader looking for an advanced Fibonacci trading tool, Ultimate Fibonacci  has what you need. Ultimate Fibonacci   has the most advanced and full-featured Fibonacci charting and trading software on the market. GIVE ME A GOOD RATING! Ultimate Fibonacci  measures and calculates Fibonacci projections and Retracement levels for you, as well as Price projections (like Wave 2 vs. 1 or Wave 4 vs. 2
FREE
>>> BIG SALE PROMOTION: 50% OFF + GIFT EA!  - Promo price: $64 / Regular price $129 <<< - The promotion will end soon! The Forex Trend Tracker is an advanced tool designed to enhance the trading capabilities of forex traders. This sophisticated indicator uses complex mathematical formulas alongside the Average True Range (ATR) to detect the beginnings of new upward and downward trends in the forex market. It offers visual cues and real-time alerts to give traders a competitive advantage in th
CCI Profesional
Ignacio Agustin Mene Franco
CCI Professional, has the simple fact of being able to do a scalping or intraday without using any other indicator to take some operation taking advantage of the rebounds in the lines of -200 for long and +200 for short, it is very easy to use and very practical for each market, it can be used for crash and boom since it works very well to hunt spikes, for volatiles and jumps, also for forex. It is used in any temporality.
KTrend for GOLD
Zhenyuan Liang
What is KTrend indicator ? KTrend is a powerful indicator for trading medium-term binary options that identify the trend of price by candlesticks. Sell signal is formed when the value is below the zero line. Similarly, buy signal is formed when the value is above the zero line. It is separated from KTrend trading system and you can get the backtest result from the pictures below.
VVWAP Bandas
Edipaulo Zanella
Daily VWAP, continues for a period of hours (eg, 10 hours of history), with color to indicate change of direction and bands to map good entry and exit points. The indicator was created to map the center of the market, and find good buying moments, trend analysis or market correction points are easily detected, allowing you to understand moments of exhaustion and buying and selling points Copyright (c) <year> <copyright holders> Permission is hereby granted, free of charge, to any person obtain
Divergence Sync MT5
Pavel Verveyko
5 (1)
Divergence and Convergence are important harbingers of reversals in stock markets. The Divergence Sync indicator is designed to automatically search for divergences on a large number of indicators with different parameters. The search for divergences is carried out on these indicators: (CCI, CHO, DeMarker, MACD, MFI, Momentum, OBV, OsMA, RSI, Stochastic, WPR,   Awesome Oscillator ). To search for divergences, you can use one technical indicator or search simultaneously on any number of ind
Vwap Freeze
Ricardo Almeida Branco
5 (1)
The previous day's vwap is used by some traders as a support and resistance point, after all it is one of the ways to consider the fair price of that asset or that pair the day before. Possible defenses can occur in this region indicating a reversal, or triggering stops starting a new, more directional movement. It is a matter of analyzing how it will add to your operational. To avoid manually drawing the previous day's vwaps and saving time for your analysis, use the Vwap Freeze indicator,
VWAP with more settings
Maria Cristina Sabatini
I developed this vwap with more settings in order to be customized as much as possible.  VWAP is a really strong indicator for your trading. It can be used to check if the market is in balance or ranged, and also you can use the levels as support/resistence/target.  In the pictures you can see the main settings, and you can select the use of real volume from the broker. Hope you will find it useful. Many thanks in advance.  
GridBotIND
Walle Trader
O  GRIDBOT WIM  robô de investimento para Mini Índice. Parametrizado com grade linear ou zona de expansão (FIMATHE). CONFIGURAÇÕES: Ponto de entrada Pivot dia anterior    double r1 = pivot + distance;    double r2 = r1 + distance;    double r3 = r2 + distance;    double r4 = r3 + distance;    double r5 = r4 + distance;    double r6 = r5 + distance;    double r7 = r6 + distance;    double r8 = r7 + distance;    double r9 = r8 + distance;    double r10 = r9 + distance;        double s1 = pivot
ADR 경보 대시보드는 가격이 일반적인 일일 평균 범위와 관련하여 현재 거래되고 있는 위치를 한 눈에 보여줍니다. 가격이 평균 범위를 초과하고 선택한 수준보다 높을 때 팝업, 이메일 또는 푸시를 통해 즉각적인 알림을 받을 수 있으므로 신속하게 철회 및 반전에 뛰어들 수 있습니다. 대시는 빈 차트에 배치되도록 설계되었으며 배경에 앉아서 레벨에 도달하면 경고하므로 앉아서 보거나 전혀 볼 필요가 없습니다! MT4 버전은 여기에서 사용 가능: https://www.mql5.com/en/market/product/62756 새로운 기능: 이제 평균 WEEKLY 및 MONTHLY 범위와 경고도 표시됩니다! 여기에서 차트의 수준을 나타내는 ADR 반전 표시기를 얻으십시오. https://www.mql5.com/en/market/product/64477 시간의 약 60%는 가격이 정상적인 일일 평균 범위(ADR) 내에서 거래되고 이 수준 이상으로 상승하면 일반적으로 급격한 가격 변
WT Vwap Bands
Ricardo Almeida Branco
The WT Vwap Bands indicator is an indicator that combines price and volume, helping to show whether the price is within the "fair price", overbought or oversold. The indicator code was designed for performance and has already been tested in a real trading account. In addition to the visual inputs (color, thickness and line style), the user can define a% value that depends on the price. The default values work with the most distant band at 1% of the price and then dividing this distan
HIGH and LOW OTT
Mohammad Taher Halimi Tabrizi
This product is converted form Trading View of Kivanc Ozbilgic to be used on MT5 and below are descriptions of developer on Trading View: Anıl Özekşi's latest development on his precious OTT - Optimized Trend Tracker: In this version, there are two lines of OTT which are derived from HIGHEST price values (HOTT) and LOVEST price values (LOTT) which were originally sourced to CLOSE values on default OTT. Another significant difference is there is no Support Line (Moving Average) in this ver
Keltner Channels (ou   Canais de Keltner ) é mais um indicador de   volatilidade   utilizado pela   análise técnica. Também chamado de   envelope , esse canal foi criado por Chester Keltner para monitorar os seus investimentos no mercado futuro de café na década de 1960. Porém, com o passar do tempo, passou também a ser utilizado para outros ativos e, atualmente, é uma das ferramentas mais utilizadas pelos traders. Nesta versão customizada foram adicionados novas opções de método de média movel
TrendlineBreak Alert
Yasir Zaidi
4 (1)
Get ALERTS for break of your TRENDLINES, SUPPORT LINES, RESISTANCE LINE, ANY LINE!! 1. Draw a line on the chart (Trend, support, resistance, whatever you like) and give it a name (e.g. MY EURUSD line) 2. Load the Indicator and input the Line Name the same name in Indicator INPUT so system knows the name of your line (= MY EURUSD line) 3. Get Alerts when Price breaks the line and closes Works on All Time frames and charts LEAVE A COMMENT AND IF THERE IS ENOUGH INTEREST I WILL WRITE AN EA WHICH
FREE
This indicator scans the 1-3 Trendline pattern . The indicator is a 100 % non repaint low risk breakout system . The patterns are formed around swing high and swing lows which make them a low risk pattern with high reward. PATTERN BACKGROUND The 1-3 Trendline Breakout pattern is formed by four(4) points which are composed of three (3) primary points and the pattern neck. A trendline is always formed by the point 1 and the neck of the pattern . When price breaks out of the trendline formed ,
DYNAMIC SR TREND CHANNEL Dynamic SR Trend Channel is a simple indicator for trend detection as well as resistance/support levels on the current timeframe. It shows you areas where to expect possible change in trend direction and trend continuation. It works with any trading system (both price action and other trading system that use indicators) and is also very good for renko charting system as well. In an uptrend, the red line (main line) serves as the support and the blue line serves as the
ArcTracer
Syed Oarasul Islam
This Indicator draws Fibonacci Arc levels in two different ways. You can select whether to draw Fibonacci Arc levels based on your favourite ZigZag settings or you can let the indicator to draw Arc levels based on given number of bars or candles.  You can also set Mobile and Email notification for your favourite Arc levels individually. With this indicator you will not have to feel lonely as the it can generate Voice alerts, which will keep you focused on your trading and remove boredom.  Produc
This script automatically calculates and updates ICT's daily IPDA look back time intervals and their respective discount / equilibrium / premium, so you don't have to :) IPDA stands for Interbank Price Delivery Algorithm. Said algorithm appears to be referencing the past 20, 40, and 60 days intervals as points of reference to define ranges and related PD arrays. Intraday traders can find most value in the 20 Day Look Back box, by observing imbalances and points of interest. Longer term traders c
The indicator plots flexible support and resistance levels (dots). A special phase of movement is used for construction. Levels are formed dynamically, that is, each new candle can continue the level or complete it. The level can provide resistance or support to the price even where it is no longer there. Also, support and resistance levels can change roles. The importance of levels is affected by: the amount of time the level is formed and the number of touches. The significance of these l
Pivot Reversal
Fyodor Korotkov
Hi there! Since I am starting commercial and non-commercial product publishing I would highly appreciate: If you like this product, please rate it. That will help to promote not only this product, but indirectly another ones. So, such promotion will help to make some money from commercial products. Thus, I will have opportunity to fund my another directions of trading researches like bot development using mql4 and mql5 programming languages as well as python written products like crypto bots. If
The indicator is the advanced form of the MetaTrader 4 standard Fibonacci tool. It is unique and very reasonable for serious Fibonacci traders. Key Features Drawing of Fibonacci retracement and expansion levels in a few seconds by using hotkeys. Auto adjusting of retracement levels once the market makes new highs/lows. Ability to edit/remove any retracement & expansion levels on chart. Auto snap to exact high and low of bars while plotting on chart. Getting very clear charts even though many ret
Pivot Point Supertrend (corresponds to Pivot Point Super Trend indicator from Trading View) Pivot Point Period:    Pivot point defined as highest high and highest low... input 2 = defining highest high and highest low with 2 bars on each side which are lower (for highest high) and are higher (for lowest low calculation) ATR Length  : the  ATR  calculation is based on 10 periods ATR Factor: ATR multiplied by 3
FREE
The indicator determines the state of the market: trend or flat. The state of the market is determined by taking into account volatility. The flat (trading corridor)is displayed in yellow. The green color shows the upward trend. The red color shows the downward trend. The height of the label corresponds to the volatility in the market. The indicator does not redraw . Settings History_Size   - the amount of history for calculation. Period_Candles  - the number of candles to calculate the
A useful scanner/dashboard that shows the RSI values for multiple symbols and Time-frames. It can be easily hidden/displayed with a simple click on the scanner man top left of the dashboard. You can input upper and lower RSI values and the colours can be set to show when above/below these values. The default values are 70 and 30. There are also input colours for when the RSI is above or below 50 (but not exceeding the upper/lower levels Symbols and time-frames are input separated by commas.
RSChannel5
Tian Yu Li
----< High Accuracy Trend Channel and Entry Signals >---- RSChannel could tell you the trend direction, resistance and support, when to open orders and where to set stoploss & takeprofit. this is a multifunctional indicator, can work well on all symbols and timeframes. Features: real-time analysis of trend direction filter out all the minor waves show resistance and support along as price goes give highly accurate entry signals frequently send alert in popup, email, notification way at e
이 제품의 구매자들이 또한 구매함
Atomic Analyst MT5
Issam Kassas
5 (14)
우선적으로 언급할 점은이 거래 지표가 다시 그리지 않고 지연되지 않으며 이를 통해 수동 및 로봇 거래 모두에 이상적이라는 점입니다. 사용자 매뉴얼: 설정, 입력 및 전략. Atomic Analyst는 가격의 강도와 모멘텀을 활용하여 시장에서 더 나은 이점을 찾는 PA Price Action Indicator입니다. 고급 필터를 장착하여 잡음과 거짓 신호를 제거하고 거래 잠재력을 높이는 데 도움이 됩니다. 복잡한 지표의 다중 레이어를 사용하여 Atomic Analyst는 차트를 스캔하고 복잡한 수학적 계산을 간단한 신호와 색상으로 변환하여 초보 트레이더가 이해하고 일관된 거래 결정을 내릴 수 있도록합니다. "Atomic Analyst"는 새로운 및 경험이 풍부한 트레이더를위한 종합적인 거래 솔루션입니다. 프리미엄 지표와 최고 수준의 기능을 하나의 거래 전략에 결합하여 모든 종류의 트레이더에 대한 다재다능한 선택지가되었습니다. 인트라데이 거래 및 스캘핑 전략 : 빠르고 정확한
우선 이 거래 시스템이 리페인팅, 리드로잉 및 레이그 인디케이터가 아니라는 점을 강조하는 것이 중요합니다. 이는 수동 및 로봇 거래 모두에 이상적인 것으로 만듭니다. 온라인 강좌, 설명서 및 프리셋 다운로드. "스마트 트렌드 트레이딩 시스템 MT5"은 새로운 및 경험이 풍부한 트레이더를 위해 맞춤형으로 제작된 종합적인 거래 솔루션입니다. 10개 이상의 프리미엄 인디케이터를 결합하고 7개 이상의 견고한 거래 전략을 특징으로 하여 다양한 시장 조건에 대한 다목적 선택이 가능합니다. 트렌드 추종 전략: 효과적인 트렌드 추이를 타기 위한 정확한 진입 및 손절 관리를 제공합니다. 반전 전략: 잠재적인 트렌드 반전을 식별하여 트레이더가 범위 시장을 활용할 수 있게 합니다. 스캘핑 전략: 빠르고 정확한 데이 트레이딩 및 단기 거래를 위해 설계되었습니다. 안정성: 모든 인디케이터가 리페인팅, 리드로잉 및 레이그가 아니므로 신뢰할 수 있는 신호를 보장합니다. 맞춤화: 개별 거래 선호도를 고려한 맞춤
FX Power MT5 NG
Daniel Stein
5 (5)
모닝 브리핑 여기 mql5 와 텔레그램에서 FX Power MT5 NG 는 오랫동안 인기 있는 통화 강도 측정기인 FX Power의 차세대 버전입니다. 이 차세대 강도 측정기는 무엇을 제공합니까? 기존 FX Power에서 좋아했던 모든 것 PLUS GOLD/XAU 강도 분석 더욱 정밀한 계산 결과 개별 구성 가능한 분석 기간 더 나은 성능을 위한 사용자 정의 가능한 계산 한도 특별 멀티더 많은 것을보고 싶은 사람들을위한 특별한 다중 인스턴스 설정 모든 차트에서 좋아하는 색상을위한 끝없는 그래픽 설정 수많은 알림 옵션, 중요한 것을 다시는 놓치지 않도록 Windows 11 및 macOS 스타일의 둥근 모서리가 있는 새로운 디자인 마법처럼 움직이는 인디케이터 패널 FX 파워 키 특징 모든 주요 통화의 완전한 강세 이력 모든 시간대에 걸친 통화 강세 이력 모든 브로커 및 차트에서 고유 계산 결과 100% 신뢰할 수있는 실시간100 % 신뢰할 수있는 실시간 계산-> 다시 칠하지 않음
Quantum Trend Sniper
Bogdan Ion Puscasu
4.91 (43)
소개       Quantum Trend Sniper Indicator는   추세 반전을 식별하고 거래하는 방식을 변화시키는 획기적인 MQL5 지표입니다! 13년 이상의 거래 경험을 가진 숙련된 트레이더 팀이 개발한       Quantum Trend Sniper 표시기       매우 높은 정확도로 추세 반전을 식별하는 혁신적인 방법으로 거래 여정을 새로운 차원으로 끌어올리도록 설계되었습니다. ***Quantum Trend Sniper Indicator를 구입하면 Quantum Breakout Indicator를 무료로 받을 수 있습니다!*** Quantum Trend Sniper Indicator는 추세 반전을 식별하고 세 가지 이익실현 수준을 제안할 때 경고, 신호 화살표를 제공합니다. 초보자 거래자와 전문 거래자 모두에게 적합합니다. Quantum EA 채널:       여기를 클릭하세요 MT4 버전:       여기를 클릭하세요
TPSpro RFI Levels MT5
Roman Podpora
5 (8)
Reversal First Impulse levels (RFI)      INSTRUCTIONS        RUS       -       ENG              R ecommended to use with an indicator   -   TREND PRO -  Version MT4                 A key element in trading is zones or levels from which decisions to buy or sell a trading instrument are made. Despite attempts by major players to conceal their presence in the market, they inevitably leave traces. Our task was to learn how to identify these traces and interpret them correctly. Main functions:: Di
Trend Screener Pro MT5
STE S.S.COMPANY
4.88 (64)
트렌드 표시기, 트렌드 트레이딩 및 필터링을 위한 획기적인 고유 솔루션, 하나의 도구 안에 내장된 모든 중요한 트렌드 기능! Forex, 상품, 암호 화폐, 지수 및 주식과 같은 모든 기호/도구에 사용할 수 있는 100% 다시 칠하지 않는 다중 시간 프레임 및 다중 통화 표시기입니다. Trend Screener는 차트에 점이 있는 화살표 추세 신호를 제공하는 효율적인 지표 추세 추종 지표입니다. 추세 분석기 표시기에서 사용할 수 있는 기능: 1. 트렌드 스캐너. 2. 최대 이익 분석이 있는 추세선. 3. 추세 통화 강도 측정기. 4. 경고가 있는 추세 반전 점. 5. 경고가 있는 강력한 추세 점. 6. 추세 화살표 Trend Screener Indicator가 있는 일일 분석 예, 일일 신호 성능...등은 여기에서 찾을 수 있습니다. 여기를 클릭하십시오. LIMITED TIME OFFER : Trend Screener Indicator는 50$ 및 평생 동안만 사용할 수 있습니다
우선적으로, 이 거래 도구는 전문적인 거래에 이상적인 비-다시 그리기 및 지연되지 않는 지표입니다.  온라인 강좌, 사용자 매뉴얼 및 데모. 스마트 가격 액션 컨셉트 인디케이터는 신규 및 경험 많은 트레이더 모두에게 매우 강력한 도구입니다. Inner Circle Trader Analysis 및 Smart Money Concepts Trading Strategies와 같은 고급 거래 아이디어를 결합하여 20가지 이상의 유용한 지표를 하나로 결합합니다. 이 인디케이터는 스마트 머니 컨셉트에 중점을 두어 대형 기관의 거래 방식을 제공하고 이동을 예측하는 데 도움을 줍니다.  특히 유동성 분석에 뛰어나 기관이 어떻게 거래하는지 이해하는 데 도움을 줍니다. 시장 트렌드를 예측하고 가격 변동을 신중하게 분석하는 데 탁월합니다. 귀하의 거래를 기관 전략에 맞추어 시장의 동향에 대해 더 정확한 예측을 할 수 있습니다. 이 인디케이터는 시장 구조를 분석하고 중요한 주문 블록을 식별하
Gold Stuff mt5
Vasiliy Strukov
4.89 (178)
Gold Stuff mt5는 금을 위해 특별히 설계된 추세 지표이며 모든 금융 상품에서도 사용할 수 있습니다. 표시기가 다시 그려지지 않고 지연되지 않습니다. 권장 기간 H1. 설정 및 개인 보너스를 받으려면 구매 후 즉시 저에게 연락하십시오!     강력한 지원 및 트렌드 스캐너 표시기의 무료 사본을 받으실 수 있습니다. 메시지를 보내주세요. 나!   설정 화살표 그리기 - 켜기 끄기. 차트에 화살표 그리기. 경고 - 가청 경고를 끕니다. 이메일 알림 - 켜기 끄기. 이메일 알림. Puch-notification - 켜기 끄기. 푸시 알림. 다음으로 색 영역을 조정합니다. Gold Stuff mt5는 금을 위해 특별히 설계된 추세 지표이며 모든 금융 상품에서도 사용할 수 있습니다. 표시기가 다시 그려지지 않고 지연되지 않습니다. 권장 기간 H1. 설정 및 개인 보너스를 받으려면 구매 후 즉시 저에게 연락하십시오!   설정 화살표 그리기 - 켜기 끄기. 차트에
FX Volume MT5
Daniel Stein
4.94 (17)
모닝 브리핑을 통해 세부 정보와 스크린샷으로 매일 시장 업데이트를 받으세요 여기 mql5 및 텔레그램에서 FX 거래량은 브로커의 관점에서 시장 심리에 대한 실제 통찰력을 제공하는 최초이자 유일한 거래량 지표입니다. 브로커와 같은 기관 시장 참여자가 외환 시장에서 어떤 포지션을 취하고 있는지에 대한 훌륭한 통찰력을 COT 보고서보다 훨씬 빠르게 제공합니다. 차트에서 이 정보를 직접 확인하는 것은 트레이딩의 진정한 판도를 바꾸고 획기적인 솔루션입니다. 다음과 같은 고유한 시장 데이터 인사이트의 이점 비율 는 통화의 매수/매도 포지션 비율을 백분율로 표시 비율 변화 는 선택한 기간 내 매수 비율과 비율 변화를 표시 총 거래량 는 해당 통화의 총 거래량(롱 및 숏)을 로트 단위로 보여줍니다 Volumes Long 는 해당 통화의 모든 롱 포지션의 거래량을 보여줍니다 Volumes Short 는 해당 통화의 모든 숏 포지션의 거래량을 보여줍니다 Net Long 는 순 롱 포지션의 거래량
TPSproTREND PrO MT5
Roman Podpora
4.88 (8)
TPSpro TRENDPRO  - is a trend indicator that automatically analyzes the market and provides information about the trend and each of its changes, as well as giving signals for entering trades without redrawing! The indicator uses each candle, analyzing them separately. referring to different impulses - up or down impulse. Exact entry points into transactions for currencies, crypto, metals, stocks, indices!  -  Version MT4               DETAILED DESCRIPTION               R ecommended to use with
FxaccurateLS
Shiv Raj Kumawat
WHY IS OUR FXACCCURATE LS MT5 THE PROFITABLE ? PROTECT YOUR CAPITAL WITH RISK MANAGEMENT Gives entry, stop and target levels from time to time. It finds Trading opportunities by analyzing what the price is doing during established trends. POWERFUL INDICATOR FOR A RELIABLE STRATEGIES We have made these indicators with a lot of years of hard work. It is made at a very advanced level. Established trends provide dozens of trading opportunities, but most trend indicators completely ignore them!
Volume by Price MT5
Brian Collard
5 (4)
The Volume by Price Indicator for MetaTrader 5 features Volume Profile and Market Profile TPO (Time Price Opportunity). Volume and TPO histogram bar and line charts. Volume Footprint charts. TPO letter and block marker collapsed and split structure charts. Session filtering and grouping. Static, dynamic and flexible range segmentation and compositing methods with relative and absolute visualizations. Graphical layering, positioning and styling options to suit the user's analytic and aesthetic n
AW Trend Predictor MT5
AW Trading Software Limited
4.78 (58)
하나의 시스템에서 추세와 고장 수준의 조합입니다. 고급 지표 알고리즘은 시장 노이즈를 필터링하고 추세, 진입점 및 가능한 출구 수준을 결정합니다. 표시기 신호는 통계 모듈에 기록되어 가장 적합한 도구를 선택하여 신호 기록의 효율성을 보여줍니다. 이 표시기는 이익 실현 및 손절매 표시를 계산합니다. 매뉴얼 및 지침 ->   HERE   / MT4 버전 ->   HERE 지표로 거래하는 방법: Trend Predictor로 거래하는 것은 3단계로 간단합니다. 1단계 - 포지션 열기 70% 이상의 성공률로 매수 신호를 받았습니다. 2단계 - StopLoss 결정 반대 신호로 트렁크 선택 3단계 - 이익 실현 전략 정의 전략 1: TP1 도달 시 전체 포지션 청산 전략 2: TP1 도달 시 포지션의 50% 청산 및 TP2 도달 시 나머지 50% 청산 전략 3: 추세 반전 시 전체 포지션 청산 이익: 결과를 다시 그리지 않음, 신호는 엄격하게 양초가 닫힐 때 어드바이저에서 사용할 수 있습니
ICT, SMC, SMART MONEY CONCEPTS, SMART MONEY, Smart Money Concept, Support and Resistance, Trend Analysis, Price Action, Market Structure, Order Blocks, BOS/CHoCH,   Breaker Blocks ,  Momentum Shift,   Supply&Demand Zone/Order Blocks , Strong Imbalance,   HH/LL/HL/LH,    Fair Value Gap, FVG,  Premium  &   Discount   Zones, Fibonacci Retracement, OTE, Buy Side Liquidity, Sell Side Liquidity, BSL/SSL Taken, Equal Highs & Lows, MTF Dashboard, Multiple Time Frame, BigBar, HTF OB, HTF Market Structure
Quantum Heiken Ashi PRO MT5
Bogdan Ion Puscasu
4.5 (8)
시장 동향에 대한 명확한 통찰력을 제공하도록 설계된 Heiken Ashi 양초는 노이즈를 필터링하고 잘못된 신호를 제거하는 기능으로 유명합니다. 혼란스러운 가격 변동에 작별을 고하고 더 매끄럽고 신뢰할 수 있는 차트 표현을 만나보세요. Quantum Heiken Ashi PRO를 정말 독특하게 만드는 것은 전통적인 촛대 데이터를 읽기 쉬운 색상 막대로 변환하는 혁신적인 공식입니다. 빨간색과 녹색 막대는 각각 약세와 강세 추세를 우아하게 강조하여 잠재적 진입점과 퇴장점을 매우 정확하게 파악할 수 있습니다. Quantum EA 채널:       여기를 클릭하세요 MT4 버전:       여기를 클릭하세요 이 놀라운 지표는 다음과 같은 몇 가지 주요 이점을 제공합니다. 선명도 향상: Heiken Ashi 바는 가격 변동을 완화하여 시장 추세를 보다 명확하게 나타내므로 유리한 거래 기회를 쉽게 식별할 수 있습니다. 소음 감소: 종종 잘못된 신호로 이어지는 불규칙한 가격 변동
Easy Buy Sell Signal Alert
Franck Martin
4.86 (7)
Easy By Sell is a market indicator for opening and closing positions. It becomes easy to track market entries with alerts. It indicates trend reversal points when a price reaches extreme values ​​and the most favorable time to enter the market. it is as effective as a Fibonacci to find a level but it uses different tools such as an algorithm based on ATR indicators and Stochastic Oscillator. You can modify these two parameters as you wish to adapt the settings to the desired period. My othe
Legacy of Gann for MT5
Pavel Zamoshnikov
5 (6)
The indicator very accurately determines the levels of the possible end of the trend and profit fixing. The method of determining levels is based on the ideas of W.D.Gann, using an algorithm developed by his follower Kirill Borovsky. Extremely high reliability of reaching levels (according to K. Borovsky  - 80-90%) Indispensable for any trading strategy – every trader needs to determine the exit point from the market! Precisely determines targets on any timeframes and any instruments (forex, met
"Piranha" - an autonomous trading system that determines overbought and oversold levels on the chart. Red and blue zones represent overbought and oversold levels respectively. Entry points are marked with arrows: a downward arrow in the red zone for "sell" and an upward arrow in the blue zone for "buy". The Take profit level is indicated by the green moving average. Key features: Adjusting the Take profit level as the green moving average changes position. Averaging ability when a new market e
가격이 역전되고 후퇴함에 따라 시장 구조가 변경됩니다. 시장 구조 반전 경고 표시기는 추세 또는 가격 움직임이 고갈에 가까워지고 반전할 준비가 되었음을 식별합니다. 일반적으로 반전이나 큰 하락이 일어나려고 할 때 발생하는 시장 구조의 변화를 알려줍니다. 지표는 가능한 고갈 지점 근처에서 새로운 고점 또는 저점이 형성될 때마다 초기에 돌파와 가격 모멘텀을 식별합니다. 표시기는 반대쪽에 있는 마지막 촛불에 직사각형을 그립니다. 그런 다음 현재의 단기 추세에서 계속 움직이기 때문에 가격과 함께 직사각형을 따라갈 것입니다. 가격이 사각형 위나 아래로 다시 닫힐 정도로 약해지면 시장 구조에 잠재적인 변화가 일어나고 있음을 나타냅니다. 그런 다음 표시기는 방향의 잠재적인 이동과 추세 또는 주요 하락의 가능한 반전 시작에 대해 경고합니다. 작동 방식을 보려면 아래의 작동 표시기를 참조하십시오! 모든 쌍 및 주요 기간을 모니터링하는 대시보드: https://www.mql5.com/
Entry Points Pro for MT5
Yury Orlov
4.55 (159)
다시 색을 칠하지 않고 거래에 진입할 수 있는 정확한 신호를 제공하는 MT5용 지표입니다. 외환, 암호화폐, 금속, 주식, 지수 등 모든 금융 자산에 적용할 수 있습니다. 매우 정확한 추정값을 제공하고 매수와 매도의 가장 좋은 시점을 알려줍니다. 하나의 시그널로 수익을 내는 지표의 예와 함께 비디오 (6:22)시청하십시오! 대부분의 거래자는 Entry Points Pro 지표의 도움으로 첫 거래 주 동안 트레이딩 결과를 개선합니다. 저희의   Telegram Group 을 구독하세요! Entry Points Pro 지표의 좋은점. 재도색이 없는 진입 신호 신호가 나타나고 확인되면(시그널 캔들이 완성된 경우) 신호는 더 이상 사라지지 않습니다. 여타 보조지표의 경우 신호를 표시한 다음 제거되기 때문에 큰 재정적 손실로 이어집니다. 오류 없는 거래 게시 알고리즘을 통해 트레이드(진입 또는 청산)를 할 이상적인 순간을 찾을 수 있으며, 이를 통해 이를 사용하는 모든 거래자의
IX Power MT5
Daniel Stein
5 (3)
IX Power는   마침내 FX Power의 탁월한 정밀도를 외환이 아닌 기호에도 적용했습니다. 좋아하는 지수, 주식, 원자재, ETF, 심지어 암호화폐까지 단기, 중기, 장기 추세의 강도를 정확하게 파악할 수 있습니다. 단말기가 제공하는   모든 것을 분석할   수 있습니다. 사용해 보고 트레이딩   타이밍이 크게 향상되는   것을 경험해 보세요. IX Power 주요 특징 단말기에서 사용 가능한 모든 거래 심볼에 대해 100% 정확한 비재도장 계산 결과 제공 사전 구성 및 추가적으로 개별 구성 가능한 강도 분석 기간의 드롭다운 선택 가능 이메일, 메시지, 모바일 알림을 통한 다양한 알림 옵션 제공 EA 요청을 위한 액세스 가능한 버퍼 더 나은 성능을 위한 사용자 지정 가능한 계산 한도 더 많은 것을 보고 싶은 사용자를 위한 특별 다중 인스턴스 설정 모든 차트에서 좋아하는 색상을 위한 무한한 그래픽 설정 가능 Windows 11 및 macOS 스타일의 둥
Bill Williams Advanced
Siarhei Vashchylka
5 (5)
Bill Williams Advanced is designed for automatic chart analysis using Bill Williams' "Profitunity" system. The indicator analyzes four timeframes at once. Manual (Be sure to read before purchasing) Advantages 1. Automatically analyzes the chart using the "Profitunity" system of Bill Williams. The found signals are placed in a table in the corner of the screen. 2. Equipped with a trend filter based on the Alligator indicator. Most of the system signals are recommended to be used only accordi
TPA True Price Action indicator reveals the true price action of the market makers through 100% non-repainting signals strictly at the close of a candle! TPA shows entries and re-entries, every time the bulls are definitely stronger than the bears and vice versa. Not to confuse with red/green candles. The shift of power gets confirmed at the earliest stage and is ONE exit strategy of several. There are available now two free parts of the TPA User Guide for our customers. The first "The Basics"
The 1 2 3 Pattern Scanner MT5
Reza Aghajanpour
5 (14)
** All Symbols x All Timeframes scan just by pressing scanner button ** ***Contact me after purchase to send you instructions and add you in "123 scanner group" for sharing or seeing experiences with other users. After 17 years of experience in the markets and programming, Winner indicator is ready. I would like to share with you! Introduction The 123 Pattern Scanner indicator with a special enhanced algorithm is a very repetitive common pattern finder with a high success rate . Interestingly,
Advanced Currency Strength28 MT5
Bernhard Schweigert
5 (1)
초보자 또는 전문가 트레이더를 위한 최고의 솔루션! 이 지표는 우리가 독점 기능과 새로운 공식을 통합했기 때문에 독특하고 고품질이며 저렴한 거래 도구입니다. 단 하나의 차트로 28 Forex 쌍의 통화 강도를 읽을 수 있습니다! 새로운 추세 또는 스캘핑 기회의 정확한 트리거 포인트를 정확히 찾아낼 수 있기 때문에 거래가 어떻게 개선될지 상상해 보십시오. 사용 설명서: 여기를 클릭  https://www.mql5.com/en/blogs/post/697384 그것이 첫 번째, 원본입니다! 쓸모없는 지망생 클론을 사지 마십시오. 더 스페셜  강력한 통화 모멘텀을 보여주는 하위 창의 화살표 GAP가 거래를 안내합니다! 기본 또는 호가 통화가 과매도/과매도 영역(외부 시장 피보나치 수준)에 있을 때 개별 차트의 기본 창에 경고 표시가 나타납니다. 통화 강도가 외부 범위에서 떨어질 때 풀백/반전 경고. 교차 패턴의 특별 경고 추세를 빠르게 볼 수 있는 다중 시간 프레임 선택
이 대시보드는 선택한 심볼에 대해 사용 가능한 최신 고조파 패턴을 표시하므로 시간을 절약하고 더 효율적으로 사용할 수 있습니다 /   MT4 버전 . 무료 인디케이터:   Basic Harmonic Pattern 인디케이터 열 Symbol :   선택한 심볼이 나타납니다 Trend :   강세 또는 약세 Pattern :   패턴 유형(가틀리, 나비, 박쥐, 게, 상어, 사이퍼 또는 ABCD) Entry :   진입 가격 SL:   스톱로스 가격 TP1:   1차 테이크프로핏 가격 TP2:   2차 테이크프로핏 가격 TP3:   3차 테이크프로핏 가격 Current price:   현재 가격 Age (in bars):   마지막으로 그려진 패턴의 나이 주요 입력 Symbols :   "28개 주요 통화쌍" 또는 "선택한 심볼" 중에서 선택합니다. Selected Symbols :   쉼표로 구분하여 모니터링하려는 원하는 심볼("EURUSD,GBPUSD,XAUUSD")
MTF Supply Demand Zones MT5
Georgios Kalomoiropoulos
자동화된 수요 및 공급 구역의 차세대. 모든 차트에서 작동하는 새롭고 혁신적인 알고리즘. 모든 구역은 시장의 가격 움직임에 따라 동적으로 생성됩니다. 두 가지 유형의 경고 --> 1)가격이 영역에 도달할 때 2)새로운 영역이 형성될 때 당신은 더 이상 쓸모없는 지표를 얻을 수 없습니다. 입증된 결과로 완벽한 거래 전략을 얻을 수 있습니다.     새로운 기능:     가격이 공급/수요 영역에 도달하면 경고     새로운 공급/수요 구역이 생성되면 알림     푸시 알림 알림     핍의 영역 너비 레이블     기동특무부대에 한 번 더 시간이 주어집니다. 따라서 현재보다 위의 2개의 시간 프레임 대신 현재보다 높은 3개의 시간 프레임을 볼 수 있습니다.     Alerts/Zones/MTF 기능을 활성화/비활성화하는 버튼 당신이 얻는 이점:     거래에서 감정을 제거하십시오.     거래 항목을 객
AW Prime Oscillator MT5
AW Trading Software Limited
두 개의 오실레이터의 조합. 첫 번째 항목은 진입점을 표시하고 두 번째 항목은 현재 추세를 표시합니다. 표시기는 두 가지 모드의 화살표로 오실레이터 신호를 표시할 수 있습니다. 모든 빠른 오실레이터 신호 또는 현재 추세 방향의 신호만 표시할 수 있습니다. 다중 시간대 패널과 세 가지 유형의 신호 알림이 있습니다. 이익: 일일 및 스캘핑 거래에 적합 추세 필터링 간단하고 민감한 설정 다중 시간대 패널 Advisor에 통합하는 데 적합합니다. 모든 기호 및 기간에서 작동합니다. 세 가지 유형의 알림 MT4 버전 ->   여기   / 문제해결 ->   여기 지표 전략 표시기는 두 개의 서로 다른 오실레이터로 구성됩니다. 느린 추세선(두꺼움) - 지표의 고수준이 위에서 아래로 교차하면 하락세 지표이고, 낮은 수평 수준(지표의 낮은 수준)이 아래에서 위로 교차하면 하락 추세 지표입니다. 상승 경향. 또한, 하단 영역에서 느린 선을 발견하면 현재 추세가 하락세임을 나타내고, 반대로 상단 영역
Owl Smart Levels MT5
Sergey Ermolov
4.38 (37)
MT4 버전  |  FAQ Owl Smart Levels Indicator 는 Bill Williams 의 고급 프랙탈, 시장의 올바른 파동 구조를 구축하는 Valable ZigZag, 정확한 진입 수준을 표시하는 피보나치 수준과 같은 인기 있는 시장 분석 도구를 포함하는 하나의 지표 내에서 완전한 거래 시스템입니다. 시장과 이익을 취하는 장소로. 전략에 대한 자세한 설명 표시기 작업에 대한 지침 고문-거래 올빼미 도우미의 조수 개인 사용자 채팅 ->구입 후 나에게 쓰기,나는 개인 채팅에 당신을 추가하고 거기에 모든 보너스를 다운로드 할 수 있습니다 힘은 단순함에 있습니다! Owl Smart Levels 거래 시스템은 사용하기 매우 쉽기 때문에 전문가와 이제 막 시장을 연구하고 스스로 거래 전략을 선택하기 시작한 사람들 모두에게 적합합니다. 전략 및 지표에는 눈에 보이지 않는 비밀 공식 및 계산 방법이 없으며 모든 전략 지표는 공개되어 있습니다. Owl Smart Levels를
ADR 반전 표시기는 가격이 정상적인 일일 평균 범위와 관련하여 현재 거래되고 있는 위치를 한 눈에 보여줍니다. 가격이 평균 범위를 초과하고 선택한 수준보다 높을 때 팝업, 이메일 또는 푸시를 통해 즉각적인 알림을 받을 수 있으므로 신속하게 철회 및 반전에 뛰어들 수 있습니다. 지표는 평균 일일 범위 극단에서 차트에 수평선을 그리고 가격이 초과하는 수학적 확률이 첨부된 수준 위의 확장을 그립니다. 자세한 내용은 아래에서... 표시기를 보완하고 모든 쌍을 모니터링하기 위한 ADR 경고 대시보드: https://www.mql5.com/en/market/product/66316 MT4 버전도 여기에서 사용 가능: https://www.mql5.com/en/market/product/62757 시간의 약 60%는 가격이 정상적인 일일 평균 범위(ADR) 내에서 거래되고 이 수준 이상으로 상승하면 일반적으로 급격한 가격 변동의 지표이며 일반적으로 이에 따라 후퇴(이익 차감) 움직임이
제작자의 제품 더 보기
The indicator displays the moment the price reaches an extreme level, including an invisible one (due to screen size limitations). Even small peaks and bottoms are considered extreme points. The level is shown as a trend line extending for a distance from the current candle (bar) to the left. The level has two values: distance (in bars) for the extreme point in a straight line to the left and distance (in bars) from the current candle (bar) to the extreme point (see the screenshots). The indicat
Индикатор виртуального эквити, представляемый здесь, может работать по нескольким символам одновременно. Для каждого символа задается направление ( Buy/Sell ) и размер позиции. В настройках также указывается размер предполагаемого депозита, дата открытия и закрытия позиции.   На графике при этом устанавливаются вертикальные линии, обозначающие указываемые в настройках даты.  После установки индикатора на график, можно изменять время открытия и закрытия позиции, передвигая эти линии.   Да
Индикатор показывает расстояние от ближайшего свободного High/Low  текущей (здесь и далее, текущей - в рамках расчетов индикатора) до исследуемой    (опять же - в рамках расчетов индикатора) свечи слева на графике на том же ценовом уровне.        Свободным в данном случае будет являться расстояние больше, чем одна свеча (бар) от текущей          свечи до исследуемой на том же ценовом уровне. Расстояние будет отмечаться пунктирной линией            от High/Low текущей свечи до исследуемой
The indicator displays the inside bar pattern on the chart. Its distinguishing feature is the triple filtration. First, not all candles meeting usual conditions can be used as first candles here. It should be a "free" candle, meaning that its High or Low (depending on conditions) should have a free space to the left. The VSA method has a similar condition called 'new fresh ground' . In case of an uptrend, the candle's High should be free, in case of a downtrend, it is the candle's Low. Second, t
Индикатор работает только с реальными биржевыми тиковыми данными. Для вычислений используются тики BID ASK и данные с ленты сделок . Индикатор проверялся на бирже CME на инструментах с узким и стабильным спредом ( S&P500, NASDAQ, CLE и др.), пояснения на скринах.   Исполнение индикатора в виде кластера в правой части графика. Каждому ценовому уровню графика выбранного участка между линиями (или отдельной свечи) соответствует полоска кластера, окрашенная в удобный для пользователя цвет (по умол
Индикатор показывает настроение слабой стороны и может использоваться как для внутридневной торговли, так и для скальпинга. Всё будет зависеть от контекста графика.   Этот индикатор строит ценовой график в виде блоков (вертикальных прямоугольников, занимающих три ценовых уровня каждый), чем-то напоминающих ренко бары. Принцип построения основан на определённом изменении уровней BID и ASK (пояснения на скрине). При установке индикатора основной график становится невидимым и на белом поле происх
Fast trade detector
Andrey Gladyshev
Fast Trade Detector (FTD) -  Самый правдивый индикатор, который показывает истинное настроение Большого Игрока.  На бирже есть Игрок, у которого есть всё для того, чтобы быть в первых рядах в книге торговых  приказов (биржевом стакане). Эти сделки как индикатор рыночного настроения сильного игрока. Вы поймёте, что всё не совсем так, как представляли раньше. Вам откроются алгоритмы и стратегии  крупного участника рынка.  Исполнение индикатора в виде гистограммы в подвале графика. Гистогра
필터:
리뷰 없음
리뷰 답변
버전 1.3 2021.09.19
Для облегчения восприятия включено отображение только дельты.
버전 1.1 2018.02.14
In the new version, the results are represented as a histogram. This is a more convenient and intuitive way to display the data.