ATR stoping range MTF
- 지표
- Viktor Glovluk
- 버전: 2.2
- 업데이트됨: 18 11월 2021
- 활성화: 5
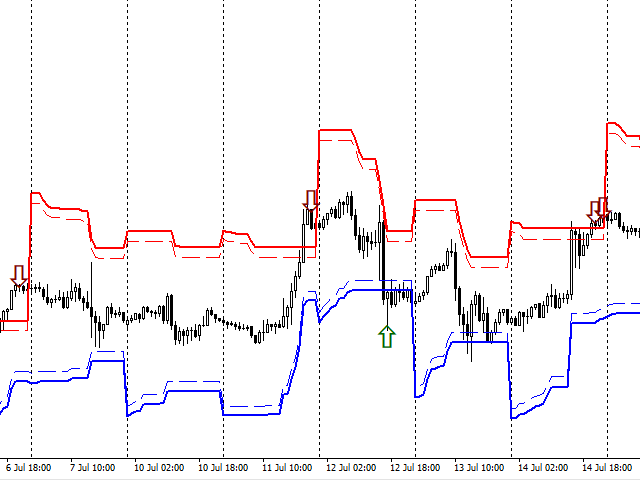
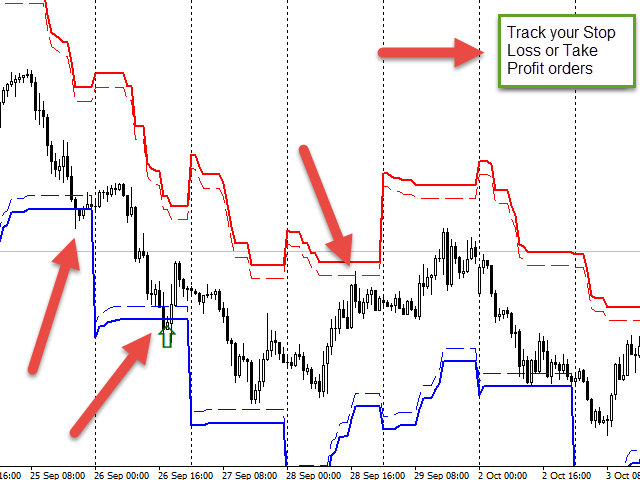
The indicator builds the ranges of the probable price movement according to the specified timeframe. The range is built starting from the Open level of the specified timeframe and extended to the timeframe's Close, shifting relative to the extremes. The upper boundary is laid from the minimum and moves only downward when the Low is updated. The lower border is laid from the maximum and rises only when the High is updated. When the price approaches the range boundaries, the probability of movement stopping, retracing or even reversing increases, as the zones are based on the ATR indicator values. When the price reaches the range boundaries, the price "fades", exhausting its driving force. And if the boundary is broken and the candle closes outside the range boundaries, the probability of returning to the broken boundary tends to 90%.
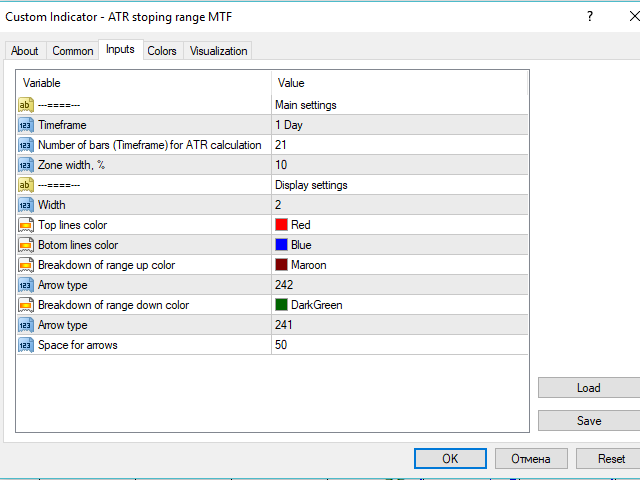
Indicator parameters
- Main settings - block of the main settings
- Timeframe - ATR timeframe
- Period - ATR period
- Zone width, % - range span in percent
- Display settings - block of the indicator visualization settings
- Width - line thickness
- Top lines color - color of the upper lines
- Bottom lines color - color of the lower lines
- Breakdown of range up color - arrow color for the upper border breakdown
- Arrow type - color of the upper arrows
- Breakdown of range down color - arrow color for the lower border breakout
- Arrow type - color of the lower arrows
- Space for arrows - offset for arrows

