Trend Direction MTF
- 지표
- Farzin Sadeghi Bonjar
- 버전: 710.181
- 업데이트됨: 27 10월 2017
- 활성화: 5
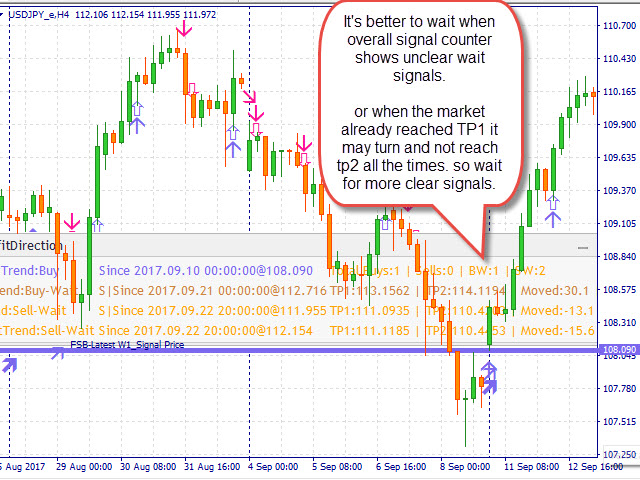
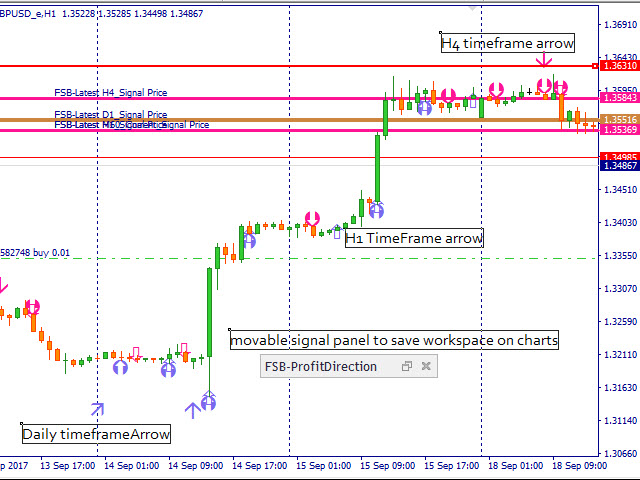
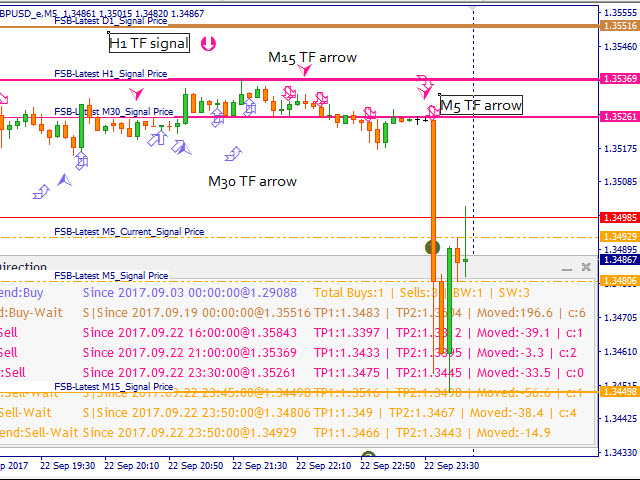
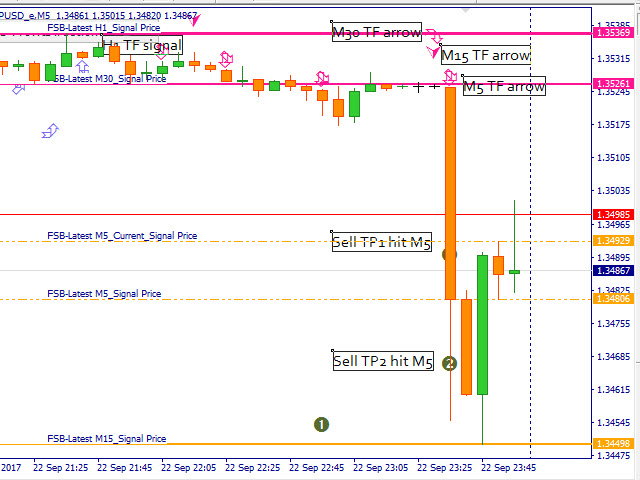
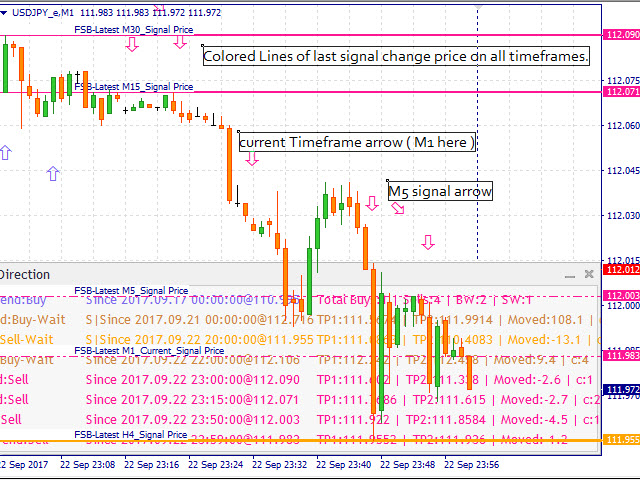
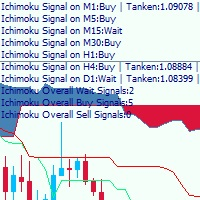
This is a multi timeframe indicator to show the direction of the trend in multiple timeframes. The calculations are based on some original indicators but with special settings that is working for years and in combination with some newer indicator formulas. The indicator has multiple arrows based on various timeframe signals so that user can clearly see which signal is for which timeframe. Also draws horizontal lines with different thickness settings and colors from various latest signals so that user can clearly see the movement of the price from latest signals specially higher timeframes.
Also the indicator has wait signals for when the signal condition is no longer available and signals are going to change to opposite signs.
Signals are described by text in a movable panel that can be minimized to save chart workspace.
The signal arrows does not repaint even the wrong arrows remain where they are generated. But price horizontal lines change and only show last signal price and color.
Also TP1 and TP2 prices are calculated based on a formula and you can close half of your trades at TP1 and make it risk free by moving stop loss to open price.
How to use
The method I use this indicator is to load it on a 5 minute or 1 minute chart. Then take a look at market direction on Weekly and Daily charts. Then according to H4 as my main signal, when most of timeframes show the same signals enter the market.
It is advisable not to take a position when there is a Wait signal showing in lower timeframes (M1 to M30) as the market may change its direction (corrective waves).
Anyway, it is an indicator that gets its calculation from the history of the market, so it belongs to the group of lagging indicators. Always take your equity risk management rules into consideration and trade with small lot sizes to prevent stress and margin problems.
For backtesting select a timeframe like M30, see how much movement is being done with higher timeframe signals. So, if you select higher timeframe direction, and whenever the lower timeframe signals match that higher timeframe, you enter the market in that direction, it will increase your rate of success in trading.
For example:
- When the Weekly shows Buy, and Daily shows Sell-Wait, it means that sells on lower timeframes are finished and market is going to reverse to buy direction as the Weekly suggests. So only take buy positions whenever lower timeframe signals show Buy signal.
- When Weekly shows Buy, but Daily and other timeframes show Sell, you can take small sell positions of that price recovery waves. Then maybe the Weekly changes to Buy-Wait and then Sell too.
There is a signal counter added to first line, 3rd column, with its color changing based on the direction of most signals. For example, if that text color is blue it means that the most of the signals are Buy, and when its orange/brown it means Wait status is detected, and when it is red it means that Sell signals are more than others.
Indicator setting
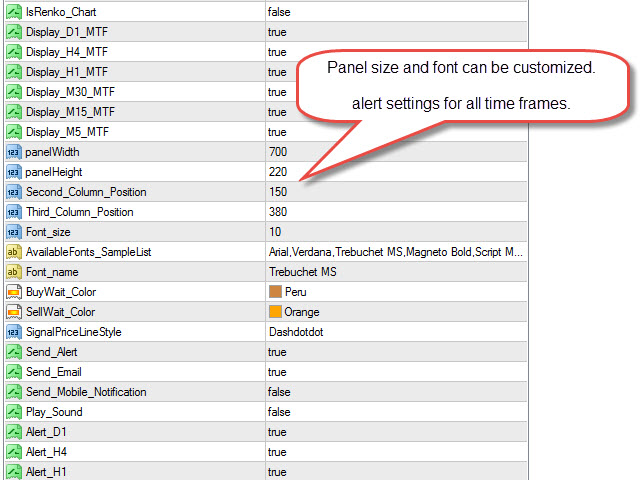
- Is_Offline_or_Renko_Chart - The indicator calculates its formula for various TF then places arrows for each TF at relevant candle in current chart. As the Renko charts does not have correct time related to candles and those charts are created mainly by price movement the other TF arrows may be placed incorrectly. So I added an option for these charts to only show current chart TF arrows.
- Panel Width - Width of the panel background.
- Panel Height - Height of panel.
- Second Column Position - location of signals price and time texts.
- Third Column Position - location of TP1 and TP2 texts.
- Also notification / email / push message can be enabled for each timeframe.
How to check if you have enough history on all timeframes
Before loading this indicator on your charts please have adequate history on all timeframes of your required pair (from 1 minute to Weekly)
For checking the signals you can go to Weekly chart and load the indicator, then check the logs:
USDJPY_e,Weekly: 762-Weekly j_W1:8 | Weekly Changed to Sell:2017.07.16 00:00:00@112.869
Then go to lower timeframe like M5, go down to reach the logs of Weekly calculations, there if you have enough history you should see the same dates. Otherwise, hold "page up" so that MetaTrader downloads more history.
USDJPY_e,M5: 762-Weekly j_W1:8 | Weekly Changed to Sell:2017.07.16 00:00:00@112.869
