Currency Strength Index Oscillator
- 지표
- Andrey Nestrogaev
- 버전: 1.0
- 활성화: 5
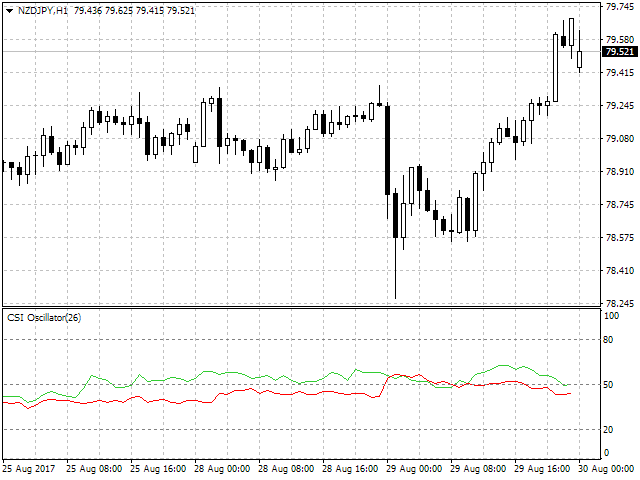
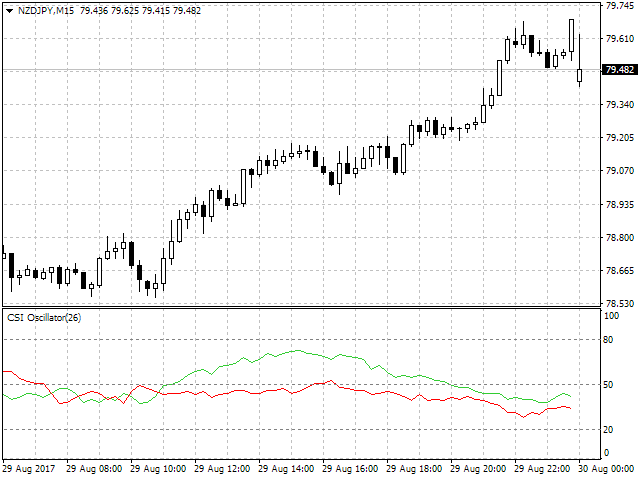
The Currency Strength Index Oscillator multicurrency trend oscillator shows the interaction of the indices of the current symbol's currencies calculated on the basis of the cross-rates of Majors.
Features
- Calculations are based on complete bars, therefore, it does not redraw.
- It works on any symbols that include the Majors (AUDJPY, AUDUSD, CHFJPY, EURAUD, EURCAD, EURCHF, EURGBP, EURJPY, EURUSD, GBPAUD, GBPCAD, GBPJPY, GBPCHF, GBPUSD, NZDJPY, NZDUSD, NZDCAD, USDCAD, USDCHF, USDJPY).
- It works on any timeframes.
- It loads only the cross-rates required for the current symbol.
- To work correctly, it requires the history of the cross-rates to be available (in case the history is less than 100 bars, an alert will be generated). The current amount of history on the pairs used will be output to the log.
Description
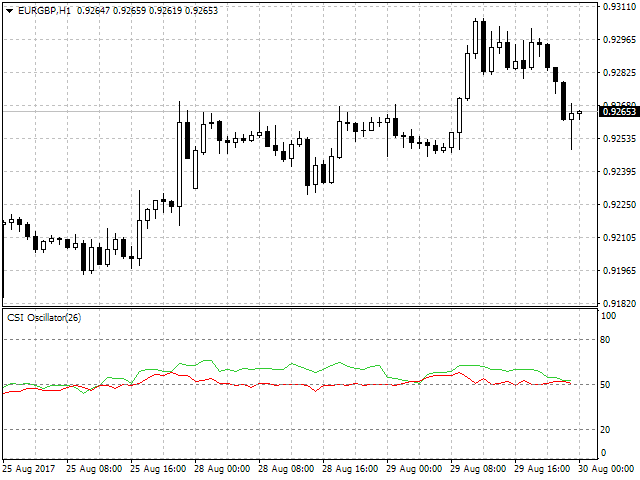
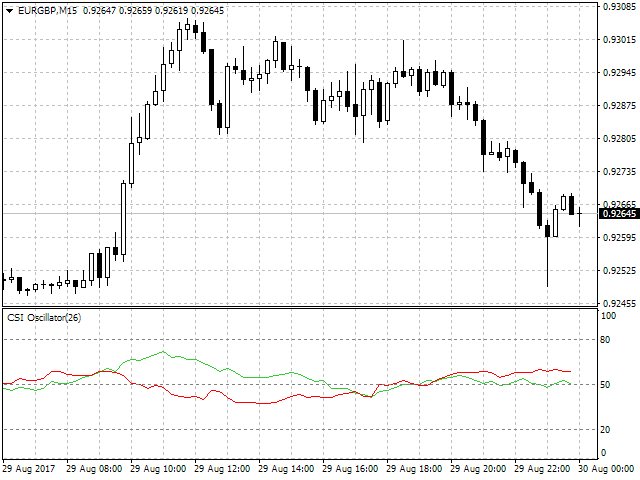
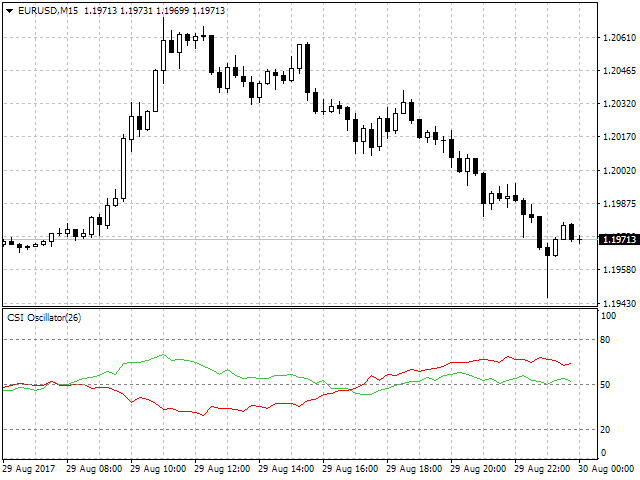
The indicator represents two curves moving between levels 0 and 100.
- The green line (0-line) reflects the index of the symbol's base currency (the first currency in the symbol's name, for example: GBP for the GBPJPY pair).
- The red line (1-line) reflects the index of the quote currency (the second currency in the symbol name, for example: JPY for the GBPJPY pair).
There is one input parameter: period - the number of bars to calculate the values of the indices. It is recommended to select this parameter based on the volatility of the current symbol on the current timeframe.
Signals
It is possible to find specific signals for each symbol, which the indicator shows. The main signals peculiar to all pairs are the interaction of the currencies' index lines with each other and the levels 50, 20, 80.
- If the 0-line is above the 1-line, then an uptrend on the current symbol is present, and vice versa;
- During a stable trend, the lines are located at a distance from each other and usually, but not necessarily, on the opposite sides of level 50.
- Intersection of the index lines means a possible beginning of a trend. This can be confirmed by a further distancing of the lines from each other during 3-5 bars (ideally, the lines moving away to either sides of the level 50).
- One of the lines crossing the level 50 indicates a possible end of the trend.
- If both lines move together near the level 50, then the current pair is in a flat.
Warning
As with any other indicator, this indicator's signals should be used in conjunction with other indicators in order to increase the signal quality.
