RSI converter percent to price
- 지표
- Aleksey Vyazmikin
- 버전: 1.0
- 활성화: 5
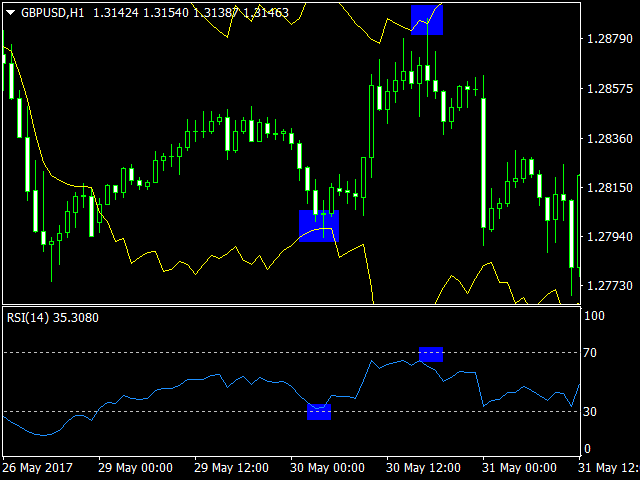
The indicator calculates the price of the trading instrument based on the RSI percentage level. The calculation is performed by Close prices, so that we can quickly find out the price, at which RSI shows the specified percentage level. This allows you to preliminarily place stop levels (Stop Loss and Take Profit) and pending orders according to significant RSI points with greater accuracy.
The indicator clearly shows that RSI levels constantly change, and the difference between them is not fixed. This means the standard RSI oscillator cannot help you define the number of points the price is to pass before reaching the next RSI level. For more visibility, I recommend building the levels of 30 and 70 that are the most popular for defining potential local trend reversal points.
The indicator eliminates the significant disadvantage of the RSI oscillator, namely the inability to analyze level crossings and returns to the channel (roll-backs) on history. The indicator allows you to visually assess roll-backs from levels.
Advantages:
- Accurate calculation of the specified RSI percentage level price;
- Ability to visually receive information from any timeframe;
- Ability to use in the algorithmic trading;
- In most cases, the use of this indicator will speed up the optimization process by abandoning the "Every tick" bar plotting mode;
- Buffer 0 provides info on the current price level according to the RSI standard oscillator. This allows applying one indicator for the market analysis in the algorithmic trading.
Parameters
- RSI - indicator period. Recommended values 2-100. However, greater values are possible as well - the limitation has to do with the number of bars on the chart;
- Percent Levl - RSI percentage value to be converted into price (1-99);
- TF - RSI calculation timeframe. It cannot be lower than the timeframe of the chart the indicator is running on.
