• 미리보기
  • 리뷰 (144)
  • 코멘트 (139)
  • 새 소식

Bermaui Deviation Percent

4.94
또는 ( BD% )는 변동성을 포인트가 아닌 백분율로 측정하는 변동성 지수입니다. BD%의 개념은 0에서 100% 사이에서 움직이는 고전 표준 편차(CSD)에 따라 인덱스를 만드는 것입니다.

BD%를 사용하여 다른 기간 또는 다른 기간의 동일한 증권에 대한 변동성을 비교할 수 있습니다. 또한 BD%를 사용하여 포인트가 아닌 백분율로 서로 다른 시장의 서로 다른 증권 간의 변동성을 비교할 수 있습니다.

"BD%" 사용 방법

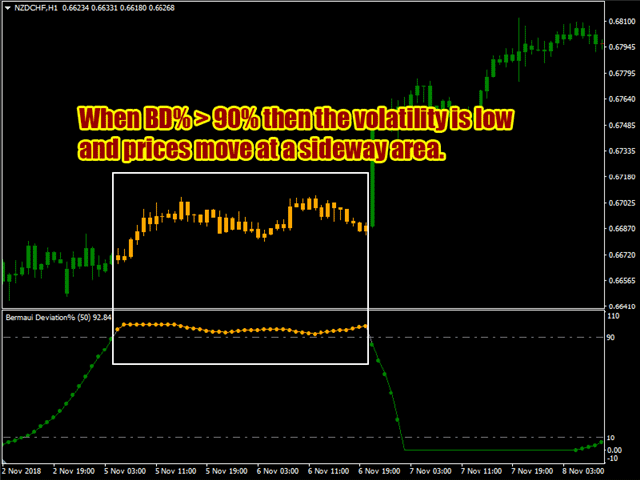
  • BD%가 90% 미만에서 이 수준을 상향 돌파하면 가격이 범위 내에서 움직일 수 있다는 신호입니다.
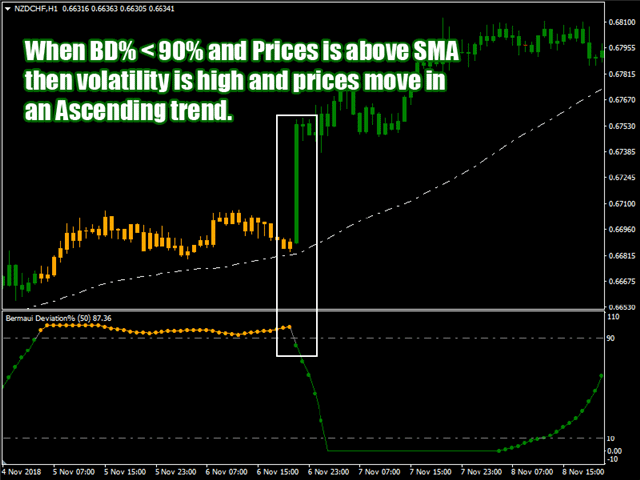
  • BD%가 90%를 넘어 이 수준을 하향 돌파하고 가격이 이미 단순 이동 평균 위에 있다면 이는 새로운 상승 추세의 시작을 알리는 신호입니다. BD%가 하락세로 갈수록 변동성과 추세 강도가 증가하고 있습니다. BD%가 0%이면 변동성이 가장 높은 값에 있음을 의미합니다.
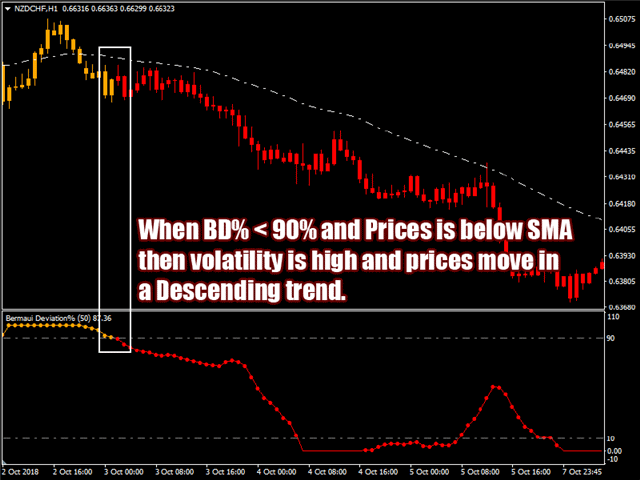
  • BD%가 90%를 넘어 이 수준을 하향 돌파하고 가격이 이미 단순 이동 평균 아래에 있다면 이는 새로운 하락 추세가 시작되었다는 신호입니다. BD%가 하락세로 갈수록 변동성과 추세 강도가 증가하고 있습니다. BD%가 0%이면 변동성이 가장 높은 값에 있음을 의미합니다.


BD%에 대해 더 알고 싶다면 여기에서 사용자 매뉴얼을 읽으십시오: https://www.mql5.com/en/blogs/post/718182

질문이 있으시면 비밀 메시지를 통해 저에게 연락하거나 의견 섹션에 작성하십시오.
무하마드 알 버마우이, CMT
리뷰 20
8463792
287
8463792 2024.09.25 02:48 
 

Excelente indicador, eu primeiro aluguei e depois de alguns testes, eu acabei comprando por saber que é um excelente indicador.

Yusuf Hamzah
557
Yusuf Hamzah 2024.09.11 13:16 
 

I have the Bermaui Band and I kinda like the concept behind it. So I am just getting this to complement the product. I would not give any misleading marketing gimmick apart of saying user should try one and assess whether it is worth value-of-money or not. It is subjective for each individual. Cheers.

Lasse Michael Holm
1389
Lasse Michael Holm 2024.08.08 16:24 
 

It works really great. Now I can find the trade which is really trending! The sellers produckt is really good quality. Try also his TDO you will not regret it!

추천 제품
VR Cub
Vladimir Pastushak
VR Cub 은 고품질 진입점을 얻는 지표입니다. 이 지표는 수학적 계산을 용이하게 하고 포지션 진입점 검색을 단순화하기 위해 개발되었습니다. 지표가 작성된 거래 전략은 수년 동안 그 효율성을 입증해 왔습니다. 거래 전략의 단순성은 초보 거래자라도 성공적으로 거래할 수 있다는 큰 장점입니다. VR Cub은 포지션 개시 지점과 이익 실현 및 손절매 목표 수준을 계산하여 효율성과 사용 편의성을 크게 높입니다. 간단한 거래 규칙을 이해하려면 아래 전략을 사용한 거래 스크린샷을 살펴보세요. 설정, 세트 파일, 데모 버전, 지침, 문제 해결 등은 다음에서 얻을 수 있습니다. [블로그] 다음에서 리뷰를 읽거나 작성할 수 있습니다. [링크] 버전 [MetaTrader 5] 진입점 계산 규칙 포지션 개설 진입점을 계산하려면 VR Cub 도구를 마지막 최고점에서 마지막 최저점까지 늘려야 합니다. 첫 번째 지점이 두 번째 지점보다 빠른 경우, 거래자는 막대가 중간선 위에서 마감될 때까지 기다립
Infinity Trend Pro
Yaroslav Varankin
1 (1)
This is a trend indicator without redrawing Developed instead of the binary options strategy (by the color of the Martingale candlestick) Also works well in forex trading When to open trades (binary options) A signal will appear in the place with a candle signaling the current candle It is recommended to open a deal for one candle of the current timeframe M1 and M5 When a blue dot appears, open a deal up When a red dot appears, open a trade down. How to open trades on Forex. When a signal is rec
The Th3Eng PipFinite indicator is based on a very excellent analysis of the right trend direction with perfect custom algorithms. It show the true direction and the best point to start trading. With StopLoss point and Three Take Profit points. Also it show the right pivot of the price and small points to order to replace the dynamic support and resistance channel, Which surrounds the price. And Finally it draws a very helpful Box on the left side on the chart includes (take profits and Stop loss
Master scalping M1
Nataliia Marchuk
Master Scalping M1 is an innovative indicator that uses an algorithm to quickly and accurately determine the trend.The indicator calculates the time of opening and closing positions, the indicator's algorithms allow you to find the ideal moments to enter a deal (buy or sell an asset), which increase the success of transactions for most traders. Benefits of the indicator: Easy to assemble, does not overload the chart with unnecessary information. Can be used as a filter for any strategy. Works on
The Sextet Scalper Pro  is an MT4 indicator that gives signals when new waves are starting in a trend. The trends are calculated using the original " The Sextet " indicator method. You get a free EA to trade with The Sextet Scalper Pro: Free EA . Default settings were optimized on GBPUSD H1 from 2017. EA could be tested on free demo version of The Sextet Scalper Pro, before purchase. Key Features: Uses The Sextet Trend Detection Method which is already a good strategy in itself for detecting l
Super Reversal Pattern
Parfait Mujinga Ndalika
Super Reversal Pattern Indicator Unlock the power of advanced pattern recognition with our Super Reversal Pattern Indicator. Designed for traders seeking precision and reliability, this indicator identifies one of the most effective reversal patterns in technical analysis, offering a significant edge in your trading strategy. Key Features: Non-Repainting Accuracy: Enjoy the confidence of non-repainting technology. Once a Super Reversal Pattern is detected, it remains static, providing consis
PipFinite Trend PRO
Karlo Wilson Vendiola
4.89 (2359)
Breakthrough Solution For Trend Trading And Filtering With All Important Features Built Inside One Tool! Trend PRO's smart algorithm detects the trend, filters out market noise and gives entry signals with exit levels. The new features with enhanced rules for statistical calculation improved the overall performance of this indicator. Important Information Revealed Maximize the potential of Trend Pro, please visit www.mql5.com/en/blogs/post/713938 The Powerful Expert Advisor Version Automa
Kangaroo Tailz
Brenden Caleb Luebeck
Looking for an indicator that identifies high-probability price action patterns? Love counter-trend trading? The Kangaroo Tailz indicator might be just for you. This indicator is meant to be used as a reversal detector. I personally would rather enter a position at the beginning of a trend rather than catch the last couple of moves. This indicator does a good job of alerting when price may reverse by identifying price action patterns that occur frequently in markets. Even though this indicator i
Fibonacci retracement and extension line drawing tool Fibonacci retracement and extended line drawing tool for MT4 platform is suitable for traders who use  golden section trading Advantages: There is no extra line, no too long line, and it is easy to observe and find trading opportunities Trial version: https://www.mql5.com/zh/market/product/35884 Main functions: 1. Multiple groups of Fibonacci turns can be drawn directly, and the relationship between important turning points
ZhiBiCCI MT4
Qiuyang Zheng
[ZhiBiCCI] indicators are suitable for all cycle use, and are also suitable for all market varieties. [ZhiBiCCI] Green solid line is a reversal of bullish divergence. The green dotted line is a classic bullish divergence. [ZhiBiCCI] The solid line to the red is a reverse bearish divergence. The red dotted line is a classical bearish divergence. [ZhiBiCCI] can be set in the parameters (Alert, Send mail, Send notification), set to (true) to send instant signals to the alarm window, email, in
캔들의 종가를 예측하는 지표입니다. 지표는 주로 D1 차트에서 사용하기 위한 것이. 이 지표는 전통적인 외환 거래와 바이너리 옵션 거래 모두에 적합합니다. 지표는 독립형 거래 시스템으로 사용하거나 기존 거래 시스템에 추가로 사용할 수 있습니다. 이 표시기는 현재 양초를 분석하여 양초 본체 내부의 특정 강도 요인과 이전 양초의 매개변수를 계산합니다. 따라서 지표는 시장 움직임의 추가 방향과 현재 양초의 종가를 예측합니다. 이 방법 덕분에 지표는 단기 및 중장기 거래 모두에 적합합니다. 지표를 사용하면 시장 상황을 분석하는 동안 지표가 생성할 잠재적 신호의 수를 설정할 수 있습니다. 표시기 설정에는 이를 위한 특별한 매개변수가 있습니다. 또한 인디케이터는 새로운 신호에 대해 차트의 메시지 형태, 이메일 및 PUSH 알림 형태로 알릴 수 있습니다. 구매 후 저에게 꼭 써주세요! 나는 당신에게 지표와 거래에 대한 나의 추천을 줄 것입니다! 또한 보너스를 받으세요!
Support and Resistance is a very important reference for trading.  This indicator provides customized support and resistance levels, automatic draw line and play music functions.  In addition to the custom RS, the default RS includes Pivot Point, Fibonacci, integer Price, MA, Bollinger Bands. Pivot Point is a resistance and support system. It has been widely used at froex,stocks, futures, treasury bonds and indexes. It is an effective support resistance analysis system. Fibonacci also known as t
Fourteen plus nine TD Sequential
MOHAMMED IMAD HUSSEIN BASSEE
Fourteen plus nine What is it for? Applying Tom DeMark’s TD Sequential serves the purpose of identifying a price point where an uptrend or a downtrend exhausts itself and reverses. . What are the main components of TD Sequential? TD Sequential has two parts – TD Setup and TD Countdown. The first phase of TD Sequential starts with a TD Setup and is completed with a 9 count. When the 9 count is completed, it is at that point, a price pause, price pullback, or reversal is likely. It is also at tha
Gann Square of 144
Taras Slobodyanik
5 (5)
The Gann Box (or Gann Square) is a market analysis method based on the "Mathematical formula for market predictions" article by W.D. Gann. This indicator can plot three models of Squares: 90, 52(104), 144. There are six variants of grids and two variants of arcs. You can plot multiple squares on one chart simultaneously. Parameters Square — selection of a square model: 90 — square of 90 (or square of nine); 52 (104) — square of 52 (or 104); 144 — universal square of 144; 144 (full) — "full"
Laser Trend
Nicolas Zouein
The trend is your friend! This is what this indicator is all about. Follow this famous saying and be safe. Characteristics: Buy/Sell signals fixed on the close of a bar. Works on all symbols and all timeframes. Clear visual market trend laser line, Buy/Sell signal arrows, market strength meter, TP1 & TP2 boxes. Visual signals when to enter, when to exit the market. No repainting. Compatible with Flexible EA for trading automation. (Ask for a free set file optimized to perform 2010-2018) Para
Advanced Trend Regime
Shellard Securities (Pty) Ltd
The indicator has been designed to function on any time-frame and any pair.   This regime filter will help the trader better evaluate whether the current market is trending, and in which direction. It quickly reacts to changes in market dynamics using a series of advanced calculations. The user is able to select whether the calculation remains standard, or if a further filter constraint is added to the calculation.   A Yellow moving average of the signal has been included for the trader to smoot
Lyne
Maksim Kalachev
About the Lyne indicator Lyne is a Metatrader 4 (MT4) indicator, the essence of which is to transform the accumulated historical data. The Lyne indicator makes it possible to detect various features and patterns in price dynamics that are invisible to the naked eye. Based on this information, traders can anticipate further price movement and adjust their strategy accordingly. This indicator has proven itself in the scalping strategy. The indicator works without repainting.
Predictor PRO MT4
Evgenii Aksenov
5 (1)
A new generation PROgressive indicator from INFINITY. Predictor PRO uses its own entry and exit calculation strategy. Indicator without redrawing signals! This is very important for real trading. The indicator can be used for any currency pairs, metals, cryptocurrencies or indices. The best time of the H1 chart. Unlike other indicators, Predictor PRO shows shows the Buy/Sell entry point and the Close exit point. Calculating the profit of all signals in points on the panel helps to choose th
메타트레이더 4(MT4)의 "두 이동평균 크로스오버" 인디케이터는 두 이동평균을 표시하고 이동평균이 서로 교차할 때 알려주는 차트 분석 도구입니다. 이 인디케이터는 두 개의 이동평균을 계산하여 표시하는데, 하나는 더 빠르고 다른 하나는 느립니다. 더 빠른 이동 평균이 더 느린 이동 평균 위로 교차하면 강세 신호로 간주되어 잠재적 인 추세 반전 또는 새로운 상승 추세의 시작을 나타냅니다. 반대로 빠른 이동평균이 느린 이동평균 아래로 교차하면 하락 신호로, 추세 반전 또는 새로운 하락 추세의 시작을 나타냅니다. 이 인디케이터는 단순이동평균(SMA), 지수이동평균(EMA), 평활이동평균(SMMA) 또는 선형가중이동평균(LWMA) 등 다양한 유형의 이동평균을 사용하도록 사용자 지정할 수 있습니다. 트레이더는 자신의 트레이딩 스타일과 선호도에 맞게 각 이동평균의 주기를 조정할 수도 있습니다. 이동 평균을 표시하는 것 외에도 인디케이터는 크로스오버가 발생하면 알림을 생성합니다. 트레이더는 크
Chart Patterns Detect 15 patterns (Ascending Triangle, Descending Triangle, Rising Wedge, Falling Wedge, Bullish Flag, Bearish Flag, Bullish Rectangle, Bearish Rectangle Symmetrical triangle, Head and Shoulders, Inverted Head and Shoulders, Triple top, Triple Bottom, Double Top, Double Bottom) Use historical data to calculate the probability of each pattern to succeed (possibility to filter notification according to the chance of success) gives graphic indication about the invalidation level and
This is the FXTraderariel-TakeProfit - Stop Loss Indicator . It provides you 3 potential Take Profits and 1 Stop Loss. These potential targets are computed based on several methods . The indicator can be used on every time frame, but we advise to use it on H1, H4 and D1. Especially if you are a novice trader. Pro Traders can also you use it for scalping in smaller time frames (M1, M5 and M15). This indicator is not a complete trading system. It doesn't provide you a Signal nor can predict the m
This indicator triggers an alert for one of the most popular methods used in Stochastic Oscillator. This is as follow: a buying alert when the Oscillator (either MAIN [%K] or SIGNAL [%D]) falls below a specific level (e.g., 20) and then rises above that level. a selling alert when the Oscillator rises above a specific level (e.g., 80) and then falls below that level. Note: this tool was developed based on the code of Stochastic Oscillator indicator included by default in MetaTrader 4 terminal
Trendiness Index
Libertas LLC
5 (3)
"The trend is your friend" is one of the best known sayings in investing, because capturing large trendy price movements can be extremely profitable. However, trading with the trend is often easier said than done, because many indicators are based on price reversals not trends. These aren't very effective at identifying trendy periods, or predicting whether trends will continue. We developed the Trendiness Index to help address this problem by indicating the strength and direction of price trend
Heiken Ashi candle chart is an improved version of The Japanese candle chart, which can effectively filter the market "noise" of the Japanese candle chart. It is favored by many traders for its simplicity and intuition. For trend traders, the HA candle chart is a magic tool. Unlike the traditional Japanese candle chart, Heikenashi does not reflect the opening price, high price, low price and closing price of the market. Instead, Heikenashi calculates the value of a single K line in the dominant
Signal From Level
Yaroslav Varankin
Binary Options Support Resistance Indicator This indicator is designed for binary options trading and effectively shows retracements from support and resistance levels. Signals appear on the current candle. A red arrow pointing downwards indicates a potential selling opportunity, while a blue arrow pointing upwards suggests buying opportunities. All that needs adjustment is the color of the signal arrows. It is recommended to use it on the M1-M5 timeframes as signals are frequent on these timef
Trend Divergence Finder – индикатор, позволяющий выявлять дивергенции цены и графика выбранного индикатора. С помощью Trend Divergence Finder вы сможете подобрать тот индикатор, который наиболее эффективен для Вас, и использовать его с наглядным отображением на графике. В индикатор включены 9 базовых индикаторов : 1.        RSI 2.        MACD 3.        MOMENTUM 4.        RVI 5.        STOCHASTIC 6.        CCI 7.        Standard Deviation 8.        Derivative 9.        William Blau Присутст
Trade with Gann on your side!! MASTER CIRCLE 360 CIRCLE CHART, originally created by Gann admitted that this is “The Mother of all charts”. It is one of the last studies that this great trader left for us. The numeric tab le is apparently quite simple like all the tables and is based on square numbers, the SQUARE OF 12 and is by evolution, one of the most important square numbers. Here we can find CYCLE, PRICE AND TIME thanks to angles and grades, to show past and future support and resistance.
What are Heiken Ashi Candles? Heiken Ashi, derived from the Japanese term 'Heikin Ashi,' translates to average price bars. It's an indicator depicting price bars on a chart. Formula for Heiken Ashi candles: - Heiken Ashi opening price: (previous candle's opening + closing price) / 2 - Closing price Heiken Ashi: (opening + high + low + closing) / 4 - Heiken Ashi peak: Max of high, opening, or closing price - Heiken Ashi bottom price: Min of low, opening, or closing price How to Read Heik
RTrends
Nikolay Likhovid
The RTrends indicator does two things: first, it automatically draws the layout of the price chart by plotting trend lines and, secondly, it produces bearish and bullish signals. The layout reflects the fractal nature of the market. Trends from different time horizons are applied simultaneously on the chart. Thus, from a single chart a trader can see trend lines of higher timeframes. The lines, depending on the horizon, differ in color and width: the older the horizon, the thicker the line is. T
Owl smart levels
Sergey Ermolov
4.34 (35)
MT5 버전  |   FAQ Owl Smart Levels Indicator 는   Bill Williams 의 고급 프랙탈, 시장의 올바른 파동 구조를 구축하는 Valable ZigZag, 정확한 진입 수준을 표시하는 피보나치 수준과 같은 인기 있는 시장 분석 도구를 포함하는 하나의 지표 내에서 완전한 거래 시스템입니다. 시장과 이익을 취하는 장소로. 전략에 대한 자세한 설명 표시기 작업에 대한 지침 고문-거래 올빼미 도우미의 조수 개인 사용자 채팅 ->구입 후 나에게 쓰기,나는 개인 채팅에 당신을 추가하고 거기에 모든 보너스를 다운로드 할 수 있습니다 힘은 단순함에 있습니다! Owl Smart Levels   거래 시스템은 사용하기 매우 쉽기 때문에 전문가와 이제 막 시장을 연구하고 스스로 거래 전략을 선택하기 시작한 사람들 모두에게 적합합니다. 전략 및 지표에는 눈에 보이지 않는 비밀 공식 및 계산 방법이 없으며 모든 전략 지표는 공개되어 있습니다. Owl Smart Lev
이 제품의 구매자들이 또한 구매함
Gann Made Easy
Oleg Rodin
4.85 (82)
Gann Made Easy 는 mr.의 이론을 사용하여 최고의 거래 원칙을 기반으로 하는 전문적이고 사용하기 쉬운 Forex 거래 시스템입니다. W.D. 간. 이 표시기는 Stop Loss 및 Take Profit Levels를 포함하여 정확한 BUY 및 SELL 신호를 제공합니다. PUSH 알림을 사용하여 이동 중에도 거래할 수 있습니다. 구매 후 연락주세요! 내 거래 팁과 훌륭한 보너스 지표를 무료로 공유하겠습니다! 아마도 Gann 거래 방법에 대해 이미 여러 번 들었을 것입니다. 일반적으로 Gann의 이론은 초보자 거래자뿐만 아니라 이미 거래 경험이 있는 사람들에게도 매우 복잡한 것입니다. Gann의 거래 방식은 이론적으로 적용하기 쉽지 않기 때문입니다. 나는 그 지식을 연마하고 Forex 지표에 최고의 원칙을 적용하기 위해 몇 년을 보냈습니다. 표시기는 적용하기가 매우 쉽습니다. 차트에 첨부하고 간단한 거래 권장 사항을 따르기만 하면 됩니다. 지표는 지속적으로 시장 분석 작업
Enigmera
Ivan Stefanov
5 (3)
에니메라: 시장의 핵심 https://www.enigmera.com 소개 이 지표 및 트레이딩 시스템은 금융 시장에 대한 놀라운 접근 방식입니다. 에니메라는 프랙탈 주기를 사용하여 지지선과 저항선을 정확하게 계산합니다. 진정한 축적 단계를 보여주고 방향과 목표를 제시합니다.  추세에 있든 조정에 있든 작동하는 시스템입니다.  어떻게 작동하나요? 에니메라는 지지선/저항선, 목표선, 편차선의 세 가지 라인으로 구성됩니다. 이 시스템은 과거 데이터를 현재와 미래로 추정하는 일반적인 시장 지표와 달리 현재에 대한 완전한 그림을 제공합니다. 지지선 위에 있으면 실제 지지를 의미하고 저항선 위에 있으면 실제 저항을 의미합니다. 레벨이 깨지면 추세의 변화를 나타냅니다. 다시 그리지 않습니다. 시장이 지속적으로 진화함에 따라 에니메라는 평가 도구를 조정하여 전략을 정기적으로 수정합니다.   이를 통해 모든 시나리오를 철저히 평가할 수 있습니다. 이 시장 지표의 고유성은 분명하며 그 기
Trend Punch
Mohamed Hassan
4.95 (19)
This indicator is unstoppable when combined with our other indicator called  Support & Resistance . After purchase, send us a message and you will get it   for  FREE as a BONUS! Introducing Trend Punch , the revolutionary forex trend indicator that will transform the way you trade! Trend Punch is uniquely designed to provide precise buy and sell arrows during strong market trends, making your trading decisions clearer and more confident. Whether you're trading major currency pairs or exotic sym
TPSproTREND PrO
Roman Podpora
4.79 (19)
TPSpro TREND PRO는   시장을 자동으로 분석하여 추세와 각 변화에 대한 정보를 제공할 뿐만 아니라 다시 그리지 않고도 거래에 진입할 수 있는 신호를 제공하는 추세 지표입니다! 지표는 각 양초를 사용하여 개별적으로 분석합니다. 다른 임펄스를 언급합니다 - 업 또는 다운 임펄스. 통화, 암호화폐, 금속, 주식, 지수 거래의 정확한 진입점! 버전 MT5                   표시기에 대한 전체 설명       표시기   와 함께 사용하는 것이 좋습니다   -   RFI LEVELS 주요 기능: 렌더링 없이 정확한 입력 신호! 신호가 나타나면 관련성은 유지됩니다! 이는 신호를 제공한 후 변경하여 예금 자금 손실을 초래할 수 있는 다시 그리기 지표와의 중요한 차이점입니다. 이제 더 큰 확률과 정확도로 시장에 진입할 수 있습니다. 화살표가 나타난 후 목표에 도달(이익실현)하거나 반전 신호가 나타날 때까지 캔들을 색칠하는 기능도 있습니다. STOP LOSS / TAK
TPSpro RFI Levels
Roman Podpora
4.82 (22)
지침         러시아   -        영어       표시기와 함께 사용하는 것이 좋습니다   .       -       TPSpro   트렌드 프로 -   MT4 버전         거래에서 핵심 요소는 거래 상품을 매수 또는 매도하기로 결정하는 구역 또는 수준입니다. 주요 업체가 시장에서 자신의 존재를 숨기려는 시도에도 불구하고, 그들은 필연적으로 흔적을 남깁니다. 우리의 과제는 이러한 흔적을 식별하고 올바르게 해석하는 방법을 배우는 것이었습니다. 주요 기능:: 판매자와 구매자를 위한 활성 영역을 표시합니다! 이 지표는 매수 및 매도를 위한 모든 올바른 초기 임펄스 레벨/존을 보여줍니다. 진입점 검색이 시작되는 이러한 레벨/존이 활성화되면 레벨의 색상이 바뀌고 특정 음영으로 채워집니다. 또한 상황을 보다 직관적으로 이해하기 위해 화살표가 나타납니다. 더 높은 시간대의 레벨/존 표시(MTF 모드) 더 높은 시간 간격을 사용하여 레벨/존을 표시하는 기능을 추가했습니다.
Scalper Inside PRO
Alexey Minkov
4.73 (56)
An exclusive indicator that utilizes an innovative algorithm to swiftly and accurately determine the market trend. The indicator automatically calculates opening, closing, and profit levels, providing detailed trading statistics. With these features, you can choose the most appropriate trading instrument for the current market conditions. Additionally, you can easily integrate your own arrow indicators into Scalper Inside Pro to quickly evaluate their statistics and profitability. Scalper Inside
Dynamic Forex28 Navigator - 차세대 외환 거래 도구. 현재 49% 할인. Dynamic Forex28 Navigator는 오랫동안 인기 있는 지표의 진화형으로, 세 가지의 힘을 하나로 결합했습니다. 고급 통화 Strength28 지표(695개 리뷰) + 고급 통화 IMPULSE with ALERT(520개 리뷰) + CS28 콤보 신호(보너스). 지표에 대한 자세한 정보 https://www.mql5.com/en/blogs/post/758844 차세대 Strength 지표는 무엇을 제공합니까?  원래 지표에서 좋아했던 모든 것이 새로운 기능과 더 높은 정확도로 강화되었습니다. 주요 기능: 독점적인 통화 Strength 공식.  모든 시간대에 걸쳐 부드럽고 정확한 강도선. 추세와 정확한 진입을 식별하는 데 이상적입니다. 역동적인 시장 피보나치 수준(시장 피보나치).  이 지표에만 있는 고유한 기능. 가격 차트가 아닌 통화 강도에 피보나치가 적용
현재 20% 할인 ! 초보자 또는 전문가 트레이더를 위한 최고의 솔루션! 이 대시보드 소프트웨어는 28개의 통화 쌍에서 작동합니다. 2가지 주요 지표(Advanced Currency Strength 28 및 Advanced Currency Impulse)를 기반으로 합니다. 전체 Forex 시장에 대한 훌륭한 개요를 제공합니다. 고급 통화 강도 값, 통화 이동 속도 및 모든(9) 시간대의 28 Forex 쌍에 대한 신호를 보여줍니다. 추세 및/또는 스캘핑 기회를 정확히 파악하기 위해 차트의 단일 지표를 사용하여 전체 시장을 볼 수 있을 때 거래가 어떻게 개선될지 상상해 보십시오! 잠재적인 거래를 식별하고 확인하면서 강력한 통화와 약한 통화를 더욱 쉽게 식별할 수 있도록 이 지표에 기능을 내장했습니다. 이 표시기는 통화의 강세 또는 약세가 증가 또는 감소하는지 여부와 모든 시간대에서 수행되는 방식을 그래픽으로 보여줍니다. 추가된 새로운 기능은 현재 시장 조건 변화에 적
FX Power MT4 NG
Daniel Stein
5 (12)
모닝 브리핑 여기 mql5 와 텔레그램에서 FX Power MT4 NG 는 오랫동안 인기 있는 통화 강도 측정기인 FX Power의 차세대 버전입니다. 이 차세대 강도 측정기는 무엇을 제공합니까? 기존 FX Power에서 좋아했던 모든 것 PLUS GOLD/XAU 강도 분석 더욱 정밀한 계산 결과 개별 구성 가능한 분석 기간 더 나은 성능을 위한 사용자 정의 가능한 계산 한도 특별 멀티더 많은 것을보고 싶은 사람들을위한 특별한 다중 인스턴스 설정 모든 차트에서 좋아하는 색상을위한 끝없는 그래픽 설정 수많은 알림 옵션, 중요한 것을 다시는 놓치지 않도록 Windows 11 및 macOS 스타일의 둥근 모서리가 있는 새로운 디자인 마법처럼 움직이는 인디케이터 패널 FX 파워 키 특징 모든 주요 통화의 완전한 강세 이력 모든 시간대에 걸친 통화 강세 이력 모든 브로커 및 차트에서 고유 계산 결과 100% 신뢰할 수있는 실시간100 % 신뢰할 수있는 실시간 계산-> 다시 칠하지 않음
MetaBands M4
Vahidreza Heidar Gholami
5 (2)
MetaBands uses powerful and unique algorithms to draw channels and detect trends so that it can provide traders with potential points for entering and exiting trades. It’s a channel indicator plus a powerful trend indicator. It includes different types of channels which can be merged to create new channels simply by using the input parameters. MetaBands uses all types of alerts to notify users about market events. Features Supports most of the channel algorithms Powerful trend detection algorith
Atomic Analyst
Issam Kassas
5 (2)
우선적으로 언급할 점은이 거래 지표가 다시 그리지 않고 지연되지 않으며 이를 통해 수동 및 로봇 거래 모두에 이상적이라는 점입니다. 사용자 매뉴얼: 설정, 입력 및 전략. Atomic Analyst는 가격의 강도와 모멘텀을 활용하여 시장에서 더 나은 이점을 찾는 PA Price Action Indicator입니다. 고급 필터를 장착하여 잡음과 거짓 신호를 제거하고 거래 잠재력을 높이는 데 도움이 됩니다. 복잡한 지표의 다중 레이어를 사용하여 Atomic Analyst는 차트를 스캔하고 복잡한 수학적 계산을 간단한 신호와 색상으로 변환하여 초보 트레이더가 이해하고 일관된 거래 결정을 내릴 수 있도록합니다. "Atomic Analyst"는 새로운 및 경험이 풍부한 트레이더를위한 종합적인 거래 솔루션입니다. 프리미엄 지표와 최고 수준의 기능을 하나의 거래 전략에 결합하여 모든 종류의 트레이더에 대한 다재다능한 선택지가되었습니다. 인트라데이 거래 및 스캘핑 전략 : 빠르고 정확한
TrendMaestro
Stefano Frisetti
5 (3)
note: this indicator is for METATRADER4, if you want the version for METATRADER5 this is the link:  https://www.mql5.com/it/market/product/108106 TRENDMAESTRO ver 2.4 TRENDMAESTRO recognizes a new TREND in the bud, he never makes mistakes. The certainty of identifying a new TREND is priceless. DESCRIPTION TRENDMAESTRO identifies a new TREND in the bud, this indicator examines the volatility, volumes and momentum to identify the moment in which there is an explosion of one or more of these data a
Advanced Currency IMPULSE with ALERT
Bernhard Schweigert
4.9 (481)
현재 31% 할인!! 초보자 또는 전문가 트레이더를 위한 최고의 솔루션! 이 지표는 우리가 독점 기능과 비밀 공식을 통합했기 때문에 독특하고 고품질이며 저렴한 거래 도구입니다. 단 하나의 차트로 28개 통화 쌍 모두에 대한 경고를 제공합니다. 새로운 추세 또는 스캘핑 기회의 정확한 트리거 포인트를 정확히 찾아낼 수 있기 때문에 거래가 어떻게 개선될지 상상해 보십시오! 새로운 기본 알고리즘을 기반으로 구축되어 잠재적인 거래를 훨씬 더 쉽게 식별하고 확인할 수 있습니다. 이는 통화의 강세 또는 약세가 가속되는지 여부를 그래픽으로 표시하고 가속 속도를 측정하기 때문입니다. 자동차의 속도계처럼 생각하면 됩니다. 가속화할 때 Forex 시장에서 동일한 일이 분명히 더 빠르게 발생합니다. 즉, 반대 방향으로 가속화되는 통화를 페어링하면 잠재적으로 수익성 있는 거래를 식별한 것입니다. 통화 모멘텀의 수직선과 화살표가 거래를 안내합니다! 역동적인 Market Fibonacci 23
Supply and Demand Dashboard PRO
Bernhard Schweigert
4.8 (20)
현재 20% 할인! 이 대시보드는 여러 기호와 최대 9개의 타임프레임에서 작동하는 매우 강력한 소프트웨어입니다. 주요 지표(최상의 리뷰: 고급 공급 수요)를 기반으로 합니다.   Advanced Supply Demand 대시보드는 훌륭한 개요를 제공합니다. 다음과 같이 표시됩니다.  영역 강도 등급을 포함하여 필터링된 공급 및 수요 값, 영역에 대한/및 영역 내 Pips 거리, 중첩된 영역을 강조 표시하고 모든 (9) 시간 프레임에서 선택한 기호에 대해 4가지 종류의 경고를 제공합니다. 그것은 당신의 개인적인 필요에 맞게 고도로 구성 가능합니다! 당신의 혜택! 모든 트레이더에게 가장 중요한 질문: 시장에 진입하기에 가장 좋은 수준은 무엇입니까? 최고의 성공 기회와 위험/보상을 얻으려면 강력한 공급/수요 영역 내 또는 그 근처에서 거래를 시작하십시오. 손절매를 위한 최적의 장소는 어디입니까? 가장 안전하려면 강력한 수요/공급 구역 아래/위에 정
Ultimate Gold Advisor for MetaTrader 4 – 성공을 보장하는 최첨단 거래 도구! Ultimate Gold Advisor는 단순한 지표 그 이상입니다. MetaTrader 4에서 거래 접근 방식을 혁신적으로 변화시킬 기술의 보석입니다. 가장 까다로운 트레이더의 요구를 충족하도록 설계된 이 최첨단 지표는 외과적 정밀성, 정교한 분석, 강력한 기능을 결합하여 시장에서 무적의 경쟁 우위를 제공합니다. 금 거래에 최적화되어 있지만 다양한 자산에 활용할 수 있는 Ultimate Gold Advisor는 귀하의 진정한 수익 잠재력을 열 수 있는 열쇠입니다. Ultimate Gold Advisor가 모든 트레이더에게 필수적인 이유는 무엇인가요? 탁월한 성능: 최대 89%에 이르는 놀라운 성공률을 자랑하는 이 지표는 단순히 신뢰할 수 있을 뿐만 아니라 매우 효과적입니다. 모든 승리 및 패배 거래가 차트에 명확하게 표시되어 귀하의 전략의 진정한 잠재력을 실시간으로 확인할
우선적으로, 이 거래 도구는 전문적인 거래에 이상적인 비-다시 그리기 및 지연되지 않는 지표입니다.  온라인 강좌, 사용자 매뉴얼 및 데모. 스마트 가격 액션 컨셉트 인디케이터는 신규 및 경험 많은 트레이더 모두에게 매우 강력한 도구입니다. Inner Circle Trader Analysis 및 Smart Money Concepts Trading Strategies와 같은 고급 거래 아이디어를 결합하여 20가지 이상의 유용한 지표를 하나로 결합합니다. 이 인디케이터는 스마트 머니 컨셉트에 중점을 두어 대형 기관의 거래 방식을 제공하고 이동을 예측하는 데 도움을 줍니다.  특히 유동성 분석에 뛰어나 기관이 어떻게 거래하는지 이해하는 데 도움을 줍니다. 시장 트렌드를 예측하고 가격 변동을 신중하게 분석하는 데 탁월합니다. 귀하의 거래를 기관 전략에 맞추어 시장의 동향에 대해 더 정확한 예측을 할 수 있습니다. 이 인디케이터는 시장 구조를 분석하고 중요한 주문 블록을 식별하고 다양한
Advanced Currency Strength28 Indicator
Bernhard Schweigert
4.9 (650)
현재 26% 할인 초보자 또는 전문가 트레이더를 위한 최고의 솔루션! 이 지표는 우리가 독점 기능과 새로운 공식을 통합했기 때문에 독특하고 고품질이며 저렴한 거래 도구입니다. 단 하나의 차트로 28 Forex 쌍의 통화 강도를 읽을 수 있습니다! 새로운 추세 또는 스캘핑 기회의 정확한 트리거 포인트를 정확히 찾아낼 수 있기 때문에 거래가 어떻게 개선될지 상상해 보십시오. 사용 설명서: 여기를 클릭  https://www.mql5.com/en/blogs/post/697384 그것이 첫 번째, 원본입니다! 쓸모없는 지망생 클론을 사지 마십시오. 더 스페셜  강력한 통화 모멘텀을 보여주는 하위 창의 화살표 GAP가 거래를 안내합니다! 기본 또는 호가 통화가 과매도/과매도 영역(외부 시장 피보나치 수준)에 있을 때 개별 차트의 기본 창에 경고 표시가 나타납니다. 통화 강도가 외부 범위에서 떨어질 때 풀백/반전 경고. 교차 패턴의 특별 경고 추세를 빠르게 볼 수 있는
FX Volume
Daniel Stein
4.58 (33)
모닝 브리핑을 통해 세부 정보와 스크린샷으로 매일 시장 업데이트를 받으세요 여기 mql5 및 텔레그램에서 FX 거래량은 브로커의 관점에서 시장 심리에 대한 실제 통찰력을 제공하는 최초이자 유일한 거래량 지표입니다. 브로커와 같은 기관 시장 참여자가 외환 시장에서 어떤 포지션을 취하고 있는지에 대한 훌륭한 통찰력을 COT 보고서보다 훨씬 빠르게 제공합니다. 차트에서 이 정보를 직접 확인하는 것은 트레이딩의 진정한 판도를 바꾸고 획기적인 솔루션입니다. 다음과 같은 고유한 시장 데이터 인사이트의 이점 비율 는 통화의 매수/매도 포지션 비율을 백분율로 표시 비율 변화 는 선택한 기간 내 매수 비율과 비율 변화를 표시 총 거래량 는 해당 통화의 총 거래량(롱 및 숏)을 로트 단위로 보여줍니다 Volumes Long 는 해당 통화의 모든 롱 포지션의 거래량을 보여줍니다 Volumes Short 는 해당 통화의 모든 숏 포지션의 거래량을 보여줍니다 Net Long 는 순 롱 포지션의 거래량
Scalper Vault
Oleg Rodin
5 (27)
Scalper Vault 는 성공적인 스캘핑에 필요한 모든 것을 제공하는 전문 스캘핑 시스템입니다. 이 표시기는 외환 및 바이너리 옵션 거래자가 사용할 수 있는 완전한 거래 시스템입니다. 권장 시간 프레임은 M5입니다. 시스템은 추세 방향으로 정확한 화살표 신호를 제공합니다. 또한 상단 및 하단 신호와 Gann 시장 수준을 제공합니다.  이 시스템은 사용하기가 매우 쉽습니다. 원하는 시장 지역의 화살표만 따라가면 됩니다. 엑시트는 가격이 적정 수준에 도달하거나 시장의 고점 또는 저점 신호가 나타날 때 수행됩니다.  표시기는 PUSH 알림을 포함한 모든 유형의 경고를 제공합니다. 인디케이터 구매 후 연락주세요. 내 개인 거래 권장 사항과 훌륭한 보너스 지표를 무료로 공유합니다! 나는 당신에게 행복하고 유익한 거래를 기원합니다!
Currency Strength Wizard
Oleg Rodin
4.93 (44)
통화 강도 마법사는 성공적인 거래를 위한 올인원 솔루션을 제공하는 매우 강력한 지표입니다. 표시기는 여러 시간 프레임의 모든 통화 데이터를 사용하여 이 또는 해당 외환 쌍의 힘을 계산합니다. 이 데이터는 특정 통화의 힘을 확인하는 데 사용할 수 있는 사용하기 쉬운 통화 지수 및 통화 전력선의 형태로 표시됩니다. 필요한 것은 거래하려는 차트에 표시기를 부착하는 것뿐입니다. 표시기는 거래하는 통화의 실제 강세를 보여줍니다. 지표는 또한 추세와 거래할 때 유리하게 사용할 수 있는 구매 및 판매 거래량 압력의 극한값을 보여줍니다. 지표는 또한 피보나치에 기반한 가능한 대상을 보여줍니다. 표시기는 PUSH 알림을 포함한 모든 유형의 알림을 제공합니다. 구매 후 연락주세요. 나는 당신과 거래 팁을 공유하고 당신에게 무료로 훌륭한 보너스 지표를 줄 것입니다! 나는 당신에게 행복하고 유익한 거래를 기원합니다!
Entry Points Pro
Yury Orlov
4.62 (175)
다시 색을 칠하지 않고 거래에 진입할 수 있는 정확한 신호를 제공하는 MT4용 지표입니다. 외환, 암호화폐, 금속, 주식, 지수 등 모든 금융 자산에 적용할 수 있습니다. 매우 정확한 추정값을 제공하고 매수와 매도의 가장 좋은 시점을 알려줍니다. 하나의 시그널로 수익을 내는 지표의 예와 함께 비디오 (6:22)시청하십시오! 대부분의 거래자는 Entry Points Pro 지표의 도움으로 첫 거래 주 동안 트레이딩 결과를 개선합니다. 저희의   Telegram Group 을 구독하세요! Entry Points Pro 지표의 좋은점. 재도색이 없는 진입 신호 신호가 나타나고 확인되면(시그널 캔들이 완성된 경우) 신호는 더 이상 사라지지 않습니다. 여타 보조지표의 경우 신호를 표시한 다음 제거되기 때문에 큰 재정적 손실로 이어집니다. 오류 없는 거래 게시 알고리즘을 통해 트레이드(진입 또는 청산)를 할 이상적인 순간을 찾을 수 있으며, 이를 통해 이를 사용하는 모든 거래자의
Quantum Breakout Indicator PRO
Bogdan Ion Puscasu
4.96 (25)
소개       Quantum Breakout PRO   , 브레이크아웃 존 거래 방식을 변화시키는 획기적인 MQL5 지표! 13년 이상의 거래 경험을 가진 숙련된 트레이더 팀이 개발한   Quantum Breakout PRO는   혁신적이고 역동적인 브레이크아웃 영역 전략으로 거래 여정을 새로운 차원으로 끌어올리도록 설계되었습니다. Quantum Breakout Indicator는 5개의 이익 목표 영역이 있는 브레이크아웃 영역의 신호 화살표와 브레이크아웃 상자를 기반으로 한 손절 제안을 제공합니다. 초보자 거래자와 전문 거래자 모두에게 적합합니다. Quantum EA 채널:       여기를 클릭하세요 MT5 버전 :   여기를 클릭하세요 중요한! 구매 후 설치 매뉴얼을 받으려면 개인 메시지를 보내주십시오. 추천: 기간: M15 통화쌍: GBPJPY, EURJPY, USDJPY,NZDUSD, XAUUSD 계정 유형: 스프레드가 매우 낮은 ECN, Ra
Order Block Hunter
Noha Mohamed Fathy Younes Badr
5 (6)
Order block hunter indicator is the best indicator for  hunt the order blocks that area where there has been a large concentration of limit orders waiting to be executed Order blocks are identified on a chart by observing previous price action and looking for areas where the price experienced significant movement or sudden changes in direction .This indicator does that for you by using very complicated codes and helps you to take the best areas To buy and sell because it make marks at the best a
PowerBall Signals
Oleg Rodin
5 (4)
PowerBall Signals는 지지/저항 영역을 사용한다는 아이디어를 기반으로 한 매수/매도 신호 표시기입니다. 이 지표는 지지/저항 영역을 기반으로 특별한 반전 패턴을 감지하고 차트에 이러한 신호를 제공합니다. 이 지표의 주요 아이디어는 MTF(다중 시간대) 분석을 사용하고 현재 및 다음 상위 시간대의 수준을 기반으로 신호를 제공하는 것입니다. 이 방법을 사용하면 통화, 금속, 지수 또는 암호화폐 등 모든 시장에서 가능한 가격 반전을 예측할 수 있습니다. 반전 신호 외에도 이 지표는 거래 중에 추세를 유지할 수 있는 추세 지속 신호도 제공합니다. 이 지표는 외환 및 바이너리 옵션 거래자 모두에게 도움이 될 것입니다. NON-MTF 또는 MTF 모드에서 표시기를 사용할지 여부를 선택할 수 있습니다. 신호 생성을 위해 데이터를 가져오려는 소스 시간 프레임을 선택할 수도 있습니다. 거래 팁과 큰 보너스를 얻으려면 구매 후 저에게 연락하십시오! 행복하고 수익성 있는 거래를 기원합니다!
Trend Pulse
Mohamed Hassan
5 (4)
Please contact me after purchase to immediately get your PDF strategy + documentation for Trend Pulse !  Introducing Trend Pulse , a unique and robust indicator capable of detecting bullish, bearish, and even ranging trends! Trend Pulse uses a special algorithm to filter out market noise with real precision. If the current symbol is moving sideways, Trend Pulse will send you a ranging signal, letting you know that it's not a good time to enter a trade. This excellent system makes Trend Pulse
Advanced Supply Demand
Bernhard Schweigert
4.91 (294)
현재 33% 할인! 초보자나 전문 트레이더를 위한 최고의 솔루션! 이 보조지표는 우리가 다수의 독창적 기능과 새로운 공식을 통합한 독특하고 고품질이며 저렴한 거래 도구입니다. 이 업데이트를 통해 이중 시간대를 표시할 수 있습니다. 더 높은 TF를 표시할 수 있을 뿐만 아니라 차트 TF와 더 높은 TF 모두를 표시할 수 있습니다: 중첩 영역 표시. 모든 Supply Demand 트레이더들이 좋아할 것입니다. :) 중요한 정보 공개 Advanced Supply Demand의 잠재력을 극대화하려면 다음을 방문하십시오. https://www.mql5.com/ko/blogs/post/720245   진입 또는 목표의 명확한 트리거 포인트를 정확히 찾아냄으로 해서 거래가 어떻게 개선될지 상상해 보십시오. 새로운 알고리즘을 기반으로 매수자와 매도자 간의 잠재적인 불균형을 훨씬 더 쉽게 분간할 수 있습니다. 왜냐하면 가장 강한 공급영역과 가장 강한 수요 영역과 과거에 어떻게 진행 되었는지를(이
Automated Trendlines
Georgios Kalomoiropoulos
5 (16)
추세선은 외환 거래에서 기술적 분석의 가장 필수적인 도구입니다. 불행히도, 대부분의 거래자는 올바르게 그리지 않습니다. 자동 추세선 표시기는 시장의 추세 움직임을 시각화하는 데 도움이 되는 진지한 거래자를 위한 전문 도구입니다. 추세선 강세 추세선과 약세 추세선에는 두 가지 유형이 있습니다. 상승 추세에서 Forex 추세선은 가격 움직임의 가장 낮은 스윙 포인트를 통해 그려집니다. 최소 두 개의 "최저 저점"을 연결하면 추세선이 생성됩니다. 하락 추세에서 추세선은 가격 움직임의 가장 높은 스윙 포인트를 통해 그려집니다. 최소 두 개의 "최고 최고점"을 연결하면 추세선이 생성됩니다. 추세선이 깨질 때? 강세 추세선은 약세 양초가 강세 추세선 아래에서 닫히고 양초의 고점이 추세선 위에 있을 때 깨집니다. 약세 추세선은 강세 양초가 약세 추세선 위로 마감되고 양초 저점이 추세선 아래에 있을 때 깨집니다. 추세선이 삭제되면? 강세 추
Currency Strength Exotics
Bernhard Schweigert
4.87 (30)
현재 20% 할인! 초보자 또는 전문가 트레이더를 위한 최고의 솔루션! 이 표시기는 Exotic Pairs Commodities, Indexes 또는 Futures와 같은 기호에 대한 통화 강도를 표시하는 데 특화되어 있습니다. 금, 은, 석유, DAX, US30, MXN, TRY, CNH 등의 진정한 통화 강도를 보여주기 위해 9번째 줄에 모든 기호를 추가할 수 있습니다. 이것은 독특하고 고품질이며 저렴한 거래 도구입니다. 우리는 많은 독점 기능과 새로운 공식을 통합했습니다. 새로운 추세 또는 스캘핑 기회의 정확한 트리거 포인트를 정확히 찾아낼 수 있기 때문에 거래가 어떻게 개선될지 상상해 보십시오. 사용 설명서: 여기를 클릭 https://www.mql5.com/en/blogs/post/708876 모든 시간대에 작동합니다. TREND를 빠르게 확인할 수 있습니다! 새로운 기본 알고리즘을 기반으로 설계되어 잠재적인 거래를 더욱 쉽게 식별하고 확인할 수 있습니다.
Quantum Trend Monitor Indicator
QUANTUM TRADING SOFTWARE LIMITED
Currency pairs never go up or down in a straight line. They rise and fall constantly, creating pullbacks and reversals. And with each rise and fall, so your emotions rise and fall. Hope, then fear, then hope. This is when the market will try to frighten you out of a strong position. It is when you are most vulnerable. But not if you have the Quantum Trend Monitor. And here, you even get two indicators for the price of one! The Quantum Trend Monitor has been designed to absorb these temporary pau
Quantum Volume Point of Control Indicator
QUANTUM TRADING SOFTWARE LIMITED
5 (1)
The Quantum VPOC indicator has been developed to expand the two dimensional study of volume and price, to a three dimensional one which embraces time. The volume/price/time relationship then provides real insight to the inner workings of the market and the heartbeat of sentiment and risk which drives the price action accordingly. The Quantum VPOC indicator displays several key pieces of information on the chart as follows: Volume Profile - this appears as a histogram of volume on the vertical pr
제작자의 제품 더 보기
Bermaui Manual EA
Muhammad Elbermawi
5 (9)
그리드 시스템을 거래하는 반자동 전문 고문입니다. 아이디어는 시장에서 점차적으로 다른 포지션을 취한 다음 손익분기점 수준을 계산하는 것입니다. 가격이 미리 결정된 거리만큼 이 손익분기점을 지나면 모든 열린 주문이 마감됩니다. 중요한 정보 다음은 사용자 가이드입니다.   https://www.mql5.com/en/blogs/post/730567 내 다른 제품과 함께 이 EA를 사용해 볼 수 있습니다. https://www.mql5.com/en/users/bermaui314/seller 중요한 기능 EA는 예상치 못한 결과로부터 거래된 자본을 보호하기 위한 손절매 메커니즘을 가지고 있습니다. EURUSD - XAUUSD - 석유 - 비트코인과 같은 모든 MT4 기호를 거래할 수 있습니다. 모든 MT4 기간을 거래할 수 있습니다. VPS에서 EA를 실행하는 것이 좋습니다. 매개변수 및 기본 설정 1) 자금 관리 설정 시작 로트. 레버리지가 1:400 이상인 경
True Direction Oscillator
Muhammad Elbermawi
4.86 (363)
또는 (TDO) "순수 모멘텀 "의 원리를 사용하여 가격 변화율을 측정하는 지수입니다. 유가 증권 가격이 10에서 15로 상승하면 가격 변동률은 150%이지만 15에서 10으로 다시 하락하면 가격 변동률은 33.3%에 불과합니다. 이것이 "가격 변화율"(ROC) 또는 "모멘텀"과 같은 기술적 분석 지표가 내림차순에 제공된 것보다 상승하는 가격 움직임에 대해 더 높은 수치를 제공하는 이유입니다. TDO는 트레이더가 모멘텀을 올바르게 읽을 수 있도록 이 문제를 수정합니다. 중요한 정보 TDO 사용자 매뉴얼: https://www.mql5.com/en/blogs/post/717970 TDO FAQ : https://www.mql5.com/en/blogs/post/722015 TDO 비디오 라이브러리: https://www.mql5.com/en/blogs/post/722018 TDO 전문가 고문 예: https://www.mql5.com/en/blogs/post/731141
Dual Bermaui Deviation Percent
Muhammad Elbermawi
5 (6)
Or DBD%. The indicator consists of colored tape that shows trading signals depending on two Bermaui Deviation Oscillator (BD%) and two moving averages. Bermaui Deviation Percent is a volatility index that measures volatility in percent rather than points. The idea of BD% is to make an index depending on Classic Standard Deviation (CSD) that moves between 0 and 100 percent. Important Information DBD% expert advisor example:  https://www.mql5.com/en/blogs/post/731145 If you want to know mor
MASR Bands
Muhammad Elbermawi
5 (5)
또는 M oving verage S upport를 R의 esistance 밴드. MASR 밴드 표시기는 지지 및 저항 수준으로 함께 작동하는 두 밴드로 둘러싸인 이동 평균입니다. 통계적으로 MASR 밴드는 시간의 93%에 가격 캔들을 포함합니다. 단계별로 계산하는 방법은 다음과 같습니다. 1. 첫 번째 단계는 X 기간 동안 최고 고가(HHV)와 최저 저가(LLV)를 계산하는 것입니다. 2. 두 번째 단계는 HHV를 LLV로 나누어 그들 사이의 거리가 얼마나 넓은지 백분율로 구하는 것입니다. 나는 이 단계의 결과를 MASR Filter라고 부른다. 3. MASR 필터 = 합계((HHV / LLV)-1) / 막대 수 4. 나는 이동 평균 저항의 지름길인 상위 밴드를 MAR이라고 부릅니다. 저는 이동 평균 지원의 지름길인 하단 밴드 MAS라고 부릅니다. 밴드 사이의 이동 평균을 중앙선이라고 합니다. 5. MAR = MASR 센터 + (75% x MASR 필터
Bermaui Bands
Muhammad Elbermawi
4.97 (68)
Bermaui Bands(BB)는 범위 및 추세 가격 움직임 사이를 필터링하는 데 도움이 되는 기술 분석 도구입니다. 이 지표의 이면에 있는 아이디어는 다음 단계에서 설명할 수 있습니다. 표준 편차를 0과 100 사이에서 이동하는 오실레이터로 계산합니다. 나는 그것을 Bermaui Deviation 퍼센트(BD %)라고 명명하겠습니다. "BD %"가 0에 가까우면 변동성이 극심합니다. 또한 "BD %"가 100에 가까우면 변동성이 매우 낮습니다. 높은 변동성은 추세 시장에 대한 큰 가능성을 의미하고 낮은 변동성은 횡보 또는 범위 시장을 의미합니다. 중간선은 표준편차가 SMA에 따라 계산되기 때문에 단순 이동 평균(SMA)입니다. Upper Bermaui Band를 얻으려면 계산에서 동일한 수의 막대를 사용하여 단순 이동 평균에 "BD %"를 추가하십시오. The Lower Bermaui Bands를 얻으려면 계산에서 동일한 수의 막대가 있는 단순 이동 평균에서 "BD %"를 빼십시오
BACD Cloud
Muhammad Elbermawi
5 (6)
또는 백분율의 방송 추세 방향 및 강도를 측정하는 발진기이며 B ermaui verage C D onvergence ivergence 구름. BACD 클라우드 계산은 다음과 같습니다. 1- 두 개의 지수 이동 평균을 계산합니다. 그들 중 하나는 다른 것보다 빠릅니다. 나는 첫 번째(빠르게)와 두 번째(느림)라고 부를게 2- 그들 사이의 중심을 찾으십시오. 여기서 Center MA = (빠른 + 느린) / 2 3- 다음과 같이 BACD 선을 계산합니다. BACD = 100 * (빠른 / 중앙 MA) 4- BACD의 지수 이동 평균인 BACD 신호선을 계산합니다. 공식은 다음과 같습니다. BACD 신호 = EMA(BACD) 5- 차트에서 BACD 신호 라인을 숨깁니다. 6- BACD 라인과 신호 라인 간의 차이인 BACD 히스토그램 라인을 계산합니다. (참고: BACD 히스토그램은 차트에 히스토그램이 아닌 선으로 그려집니다.) 7- (BACD 선 > BA
Bermaui Pin Bars
Muhammad Elbermawi
5 (13)
버마우이 핀 바 또는 (BPB)는 차트에서 핀 바 가격 행동 패턴을 찾는 지표입니다. Pin Bars는 Hammer, Inverted-Hammer, Hanging Man, 슈팅 스타, Dragon Fly Doji 또는 Grave Stone Doji와 같이 높이가 높거나 낮은 그림자와 매우 작은 몸체를 가진 일본 촛대의 대안인 고전적인 바 패턴인 "Pinocchio Bars"의 지름길입니다. . Bermaui Pin Bars 표시기는 다음 단계에서 설명할 수 있는 공식에 따라 이 패턴을 찾습니다. 처음에 BPB는 양초 몸체의 중심을 계산합니다( = [Open + Close] / 2). 그런 다음 BPB는 몸체 중심과 촛불 사이의 거리를 낮게 찾습니다. 마지막 단계는 2단계 결과를 양초 범위로 나누는 것입니다. 양초 본체 중심이 양초의 고점 또는 저점에 너무 가까우면 BPB가 핀 막대 패턴을 감지하고 사용자에게 경고합니다. 버마우이 핀 바 공식 : https://www.mql5.
Bermaui RSI Candles
Muhammad Elbermawi
5 (4)
이 지표의 아이디어는 매수 및 매도 신호를 생성하기 위해 가격 차트와 비교할 수 있는 양초 형태로 RSI를 그리는 것입니다. 지표는 내 발명품이 아닙니다. 나는 몇 년 전에 인터넷에서 그것을 설립했습니다. 코드를 업데이트하고 경고 기능을 추가했으며 Bermaui Utilities 도구 그룹을 추가했습니다. 표시기는 촛대를 그리는 데 사용되는 모든 가격의 RSI(시가, 고가, 저가 및 종가의 RSI)를 계산합니다. RSI 양초 높은 심지를 그리기 위해 가장 높은 값을 사용하고 RSI 양초 낮은 심지를 그리는 데 가장 낮은 값을 사용합니다. RSI 양초의 몸체는 고점과 저점 사이에 있습니다. 시가의 RSI가 종가의 RSI보다 낮으면 RSI 양초가 강세로 간주됩니다. 시가의 RSI가 종가의 RSI보다 높으면 RSI 캔들은 약세로 간주됩니다. 사용 방법 RSI 양초 지표에서 추세선 브레이크아웃을 거래할 수 있으며, 이는 모멘텀이 가격을 앞서기 때문에 가격 차트의 추세를 이끌 것입니다.
Bermaui Channel
Muhammad Elbermawi
5 (19)
This is a price channel that shows five important price levels on the chart. Those levels are: 1. The Highest High (HH) of the previous x bars. 2. The Highest Low (HL) of the previous x bars. 3. The Center Line. 4. The Lowest High (LH) of the previous x bars. 5. The Lowest Low (LL) of the previous x bars. How does Bermaui Channels Captures Overbought  area Think of the distance between HH and HL levels as an overbought area. When the price candles or bars crosses the HL to the upside this
Moving Average Cloud
Muhammad Elbermawi
4.92 (13)
또는 "맥". 이것은 추세를 포착하고 거래하는 데 도움이 되도록 설계된 지표입니다. 이 지표의 이면에 있는 아이디어는 다음 단계에서 설명할 수 있습니다. 빠르게 움직이는 평균 봉투를 그립니다. 느리게 움직이는 평균 봉투를 그립니다. MAC Upper Band는 두 Envelopes의 high 사이의 가장 높은 값입니다. MAC Lower Band는 두 Envelope의 낮은 값 사이의 가장 낮은 값입니다. MAC 히스토그램 클라우드는 방향 변화를 보여주기 위해 두 밴드 사이의 거리를 채웁니다. Blue Cloud는 상승 추세를 나타내고 Red Cloud는 하락 추세를 나타냅니다. MAC 버퍼를 사용하여 자신의 EA 또는 스캐너를 구축하는 방법을 보려면 다음 블로그를 읽으십시오. https://www.mql5.com/en/blogs/post/734293 MAC 사용 방법 MAC 클라우드를 필터로 사용하여 추세 방향을 식별하는 데 도움이 됩니다. 가능한 한 잘못된
Classic Keltner Channel
Muhammad Elbermawi
4.87 (30)
또는 CKC. 이 지표는 Chester W. Keltner(1909–1998)가 설명한 고전적인 10일 이동 평균 규칙에 따라 작동합니다. 모든 매개변수는 기본적으로 Keltner 시스템의 클래식 버전으로 설정되며 사용자가 원하는 경우 변경할 수 있습니다. 중요한 정보 CKC 매뉴얼 읽기: https://www.mql5.com/en/blogs/post/736577 CKC 전문가 고문 예: https://www.mql5.com/en/blogs/post/734150 Keltner 채널 공식 정보 1. 표준가(= (고가 + 저가 + 종가) / 3)에서 단순 이동 평균으로 중심선을 계산합니다. 2. 고가와 저가의 평균 차이인 ADR(Average Daily Range)을 중심선에 대해 동일한 기간 및 계산 방법으로 계산합니다. 3. Keltner 매수 라인 = 센터 라인 + ADR. 4. Keltner 판매 라인 = 센터 라인 – ADR. Keltner 10일 이동 평균
Horus EA
Muhammad Elbermawi
3 (2)
MT4용 호루스 EA 수천 년 전 고대 이집트인들은 토지를 측정하고 상품의 무게를 재는 데 사용하는 계수 시스템을 발명했습니다. 이 시스템은 " 호루스의 눈 "으로 알려졌습니다. 호루스의 눈은 오시리스 신의 신화와 관련이 있으며 파라오의 신성한 상징 중 하나가 되었습니다. 저는 피보나치 수열과 함께 Eye of Horus의 수학 방정식을 사용하여 유명한 "Martingale System"보다 89% 안전한 네거티브 진행 자금 관리 시스템을 구축했습니다. EA의 기술적인 부분은 이동 평균 클라우드(MAC) 및 스토캐스틱 오실레이터에 의존합니다. MAC 확률론적 기술적 분석 시스템은 어떻게 작동합니까? 1- 이동 평균 구름(MAC)이 강세라면 EA는 스토캐스틱 오실레이터가 아래에서 과매도 수준을 넘을 때 매수 주문을 받습니다. 2- 이동 평균 클라우드(MAC)가 약세라면 스토캐스틱 오실레이터가 위에서부터 과매수 수준을 넘어설 때 EA는 매도 주문을 받습니다. EA 중
필터:
8463792
287
8463792 2024.09.25 02:48 
 

Excelente indicador, eu primeiro aluguei e depois de alguns testes, eu acabei comprando por saber que é um excelente indicador.

Yusuf Hamzah
557
Yusuf Hamzah 2024.09.11 13:16 
 

I have the Bermaui Band and I kinda like the concept behind it. So I am just getting this to complement the product. I would not give any misleading marketing gimmick apart of saying user should try one and assess whether it is worth value-of-money or not. It is subjective for each individual. Cheers.

Muhammad Elbermawi
52474
개발자의 답변 Muhammad Elbermawi 2024.09.11 13:18
Thanks a lot, Yusuf ... I appreciate that 🙏
Lasse Michael Holm
1389
Lasse Michael Holm 2024.08.08 16:24 
 

It works really great. Now I can find the trade which is really trending! The sellers produckt is really good quality. Try also his TDO you will not regret it!

ovno27
109
ovno27 2024.04.07 09:09 
 

Fantastic filter/Momentum Indicator.

lilinhui
59
lilinhui 2023.03.12 03:33 
 

非常好的指标。我们可以自信地使用这个指标进行交易。

elite luis
3351
elite luis 2023.03.03 16:00 
 

This is Amazing indicator! Author is very responsive and passionate in his work, Best Buy for 2023! I want to get MT5 version also for Bermaui Deviation Percent, Author please code MT5 ok?

Muhammad Elbermawi
52474
개발자의 답변 Muhammad Elbermawi 2023.03.03 18:43
Thanks a lot for the great review & stars
Ruslan Ostafiichuk
274
Ruslan Ostafiichuk 2023.02.20 08:30 
 

Очень полезный и удобный индикатор. Покупкой доволен.

Cd Vijaya Narayana
684
Cd Vijaya Narayana 2022.12.22 20:20 
 

Very good indicator. we can confidently trade using this indicator.

Muhammad Elbermawi
52474
개발자의 답변 Muhammad Elbermawi 2022.12.22 20:24
Thanks a lot for the great review & stars :)
Najseattle
77
Najseattle 2022.11.27 07:47 
 

The Bermaui Deviation % is definitely one of the top ten indicators I have ever used. Along with a few others also created by Mr. Bermaui. I do recommend you at least test all of his indicators. It may help you to visualize the Markets in a different way that proves beneficial to your trading career! 5 stars

Muhammad Elbermawi
52474
개발자의 답변 Muhammad Elbermawi 2022.11.29 07:49
I really want to thank you for your great words, Nicolas.
powertrader24
85
powertrader24 2022.10.07 08:54 
 

The first indicator I bought from Muhammad was TDO (True Direction Oscillator) about a week ago. I've had great luck using the TDO indicator so, now I purchased his BD% to get even better results from my trading. Keep up the good work Muhammad!

Muhammad Elbermawi
52474
개발자의 답변 Muhammad Elbermawi 2022.10.07 09:18
Thanks a lot for that great review
KEWELL99 Hields
89
KEWELL99 Hields 2022.09.14 21:59 
 

Downloaded the demo and was impressed so just purchased the full version and im in 2 profitable trades already....best thing I can say is though that the developer is happy to share knowledge and has responded to some queries already, this makes a good seller in my opinion. Really like the look of TDO from this developer aswell which I am demoing, his products are visually very helpful - 5 stars, thank you Muhammed

Muhammad Elbermawi
52474
개발자의 답변 Muhammad Elbermawi 2022.09.14 22:10
You are welcome my friend
Jedidiah Benedict
91
Jedidiah Benedict 2022.08.05 18:31 
 

I really like this indicator.

James Sabai-Jai
911
James Sabai-Jai 2022.07.29 11:00 
 

사용자가 평가에 대한 코멘트를 남기지 않았습니다

hisunsun
502
hisunsun 2022.07.22 09:02 
 

This indicator spots out the volatility ; it could increase with winning rate on combine with using other indicators.

Vinicius Favarin
322
Vinicius Favarin 2022.07.21 23:04 
 

It's no use throwing money away.

Nikodem Dobrzynski
216
Nikodem Dobrzynski 2022.07.13 20:14 
 

Very good volatility indicator for trading strategy, is useful as filter to protect you to enter week trades. Bermaui Deviation Percent you have to use as combination with other indicators . It’s no secret that all technical analysis indicators are lagging . Also you have to understand that sometimes doesn’t get you into a good trade, it is normal thing using indicators. Overall my rating is five stars.

rodbizness
84
rodbizness 2022.06.11 01:23 
 

Just Very Very GOOD Indicator . Thank again Muhammad for your nice job.

SurfsideTrader
239
SurfsideTrader 2022.05.26 14:30 
 

So far so good. Not only does this indicator generate high probability signals but, equally importantly, it keeps you out of lower probability trades that you may ordinarily have entered.

ck15220
714
ck15220 2022.04.20 05:38 
 

Good indictor accurate signals

Munch Makuchi
1334
Munch Makuchi 2022.04.17 18:00 
 

Seriously nothing like this indicator. With the Bermaui Bands + Deviation% the likelihood of entering a bad trade is almost nothing for as long as you trade with the trend and not entering into resistance or support. Thank you!

리뷰 답변
버전 6.1 2020.03.28
1. Fixed a small bug in the de-initialization function, that used to cause the "Symbols Switch" tool not to work properly.
2. Organized BD% parameters in a better style.
3. Enhanced alert messages.
.
Note:
I didn't make any changes on TDO basic formula. It is still the same.
I didn't make serious changes in indicator parameters or buffers.
버전 6.0 2019.12.05
Bermaui Deviation Percent version 5.0:
--------------------------------------------------
1. I worked to enhance the built-in function of the indicator and made the code much more organized than before.

2. This version have much less parameters.

3. Enhanced the panel at the right side of the indicator.

4. Added four Color Lists.

5. Enhanced all alerts and messages code.
버전 5.0 2019.07.18
Welcome to Bermaui Deviation Percent version 5.0. In this version:

1. I worked to enhance the built-in function of the indicator and made the code much more organized than before.
2. Made the code more easier to be read with iCustom().
3. Added the option to change font size for buttons.

I hope you like it.
Kind regards
버전 4.0 2019.01.11
1. Enhanced BD% calculation method.
2. Organized BD% parameters in a better style.
3. Enhanced the Round Number Grid calculation method.
4. Added sub levels to the Round Number Grid.
5. Added what I call Zig Zone Levels to easily capture support & resistance.
버전 3.0 2018.08.03
1.1. Added a "Symbol Switch Panel" to make it easy for user to switch between different charts.
1.2. "Symbol Switch Panel" can be from User inputs or from Market Watch window.
1.3. "Symbol Switch Panel" can change chart for current window or open it in a new one.
1.4. User can use "Symbol Switch Panel" to change current chart time frame.
1.5. User control the number of buttons on "Symbol Switch Panel". He can make them appear on main chart or TDO window.
---------------------------------------------------------
2.1 Added a "Price Channel".
2.2 User can choose between "Standard Deviation" or "Linear Regression" channels.
2.3 User can draw channels as a ray or make them as background.
---------------------------------------------------------
3.1 Added a "Price Grid".
3.2 User can choose between "Automatic Grid" and "Customer Grid".
3.3 User can multiply distance between grid levels.