Lines Resistance and Support
- 지표
- Vasiliy Smirnov
- 버전: 1.1
- 업데이트됨: 2 8월 2017
- 활성화: 20
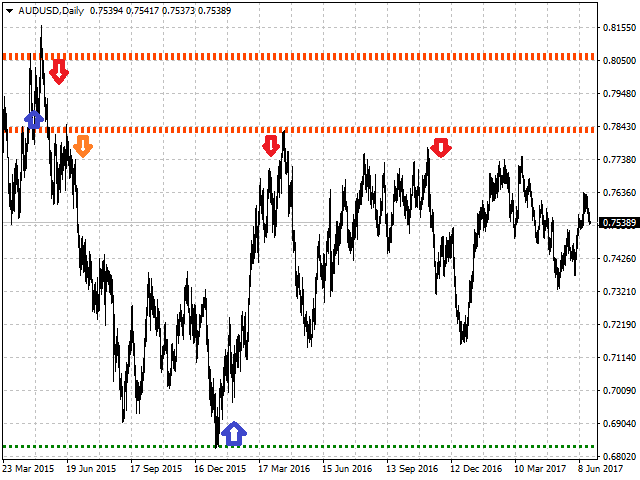
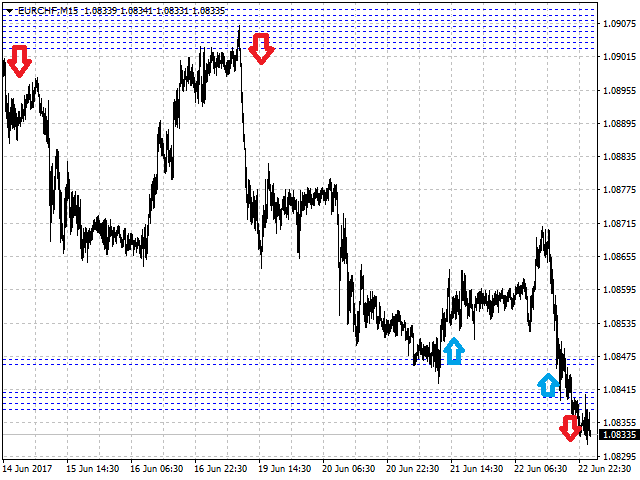
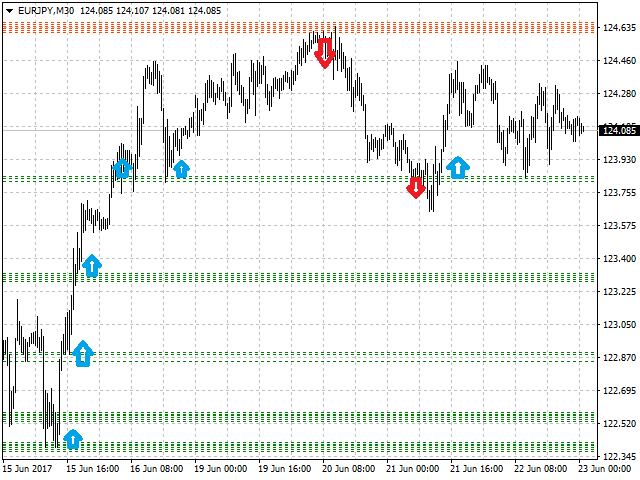
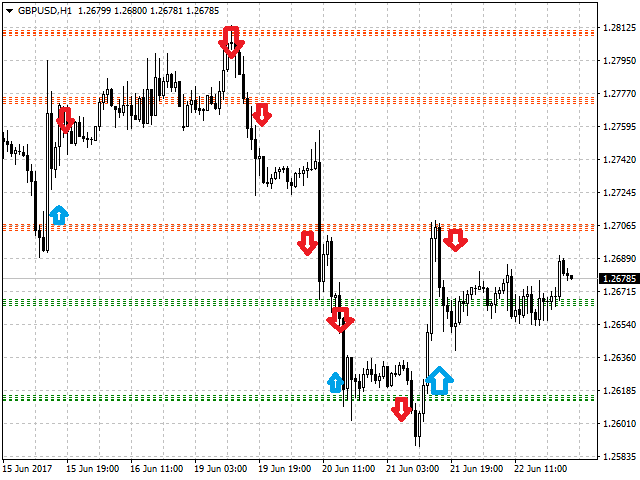
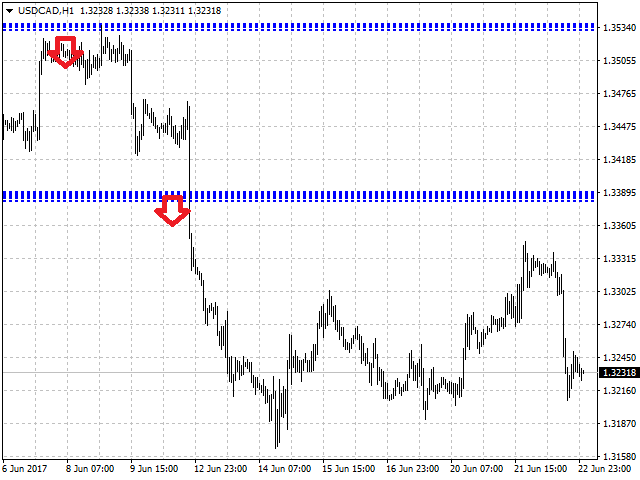
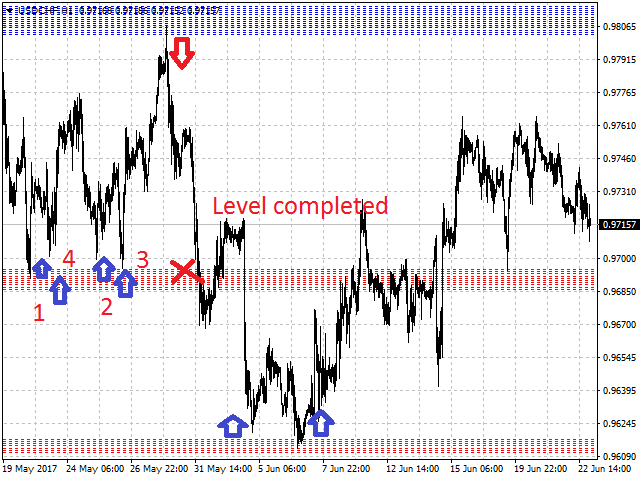
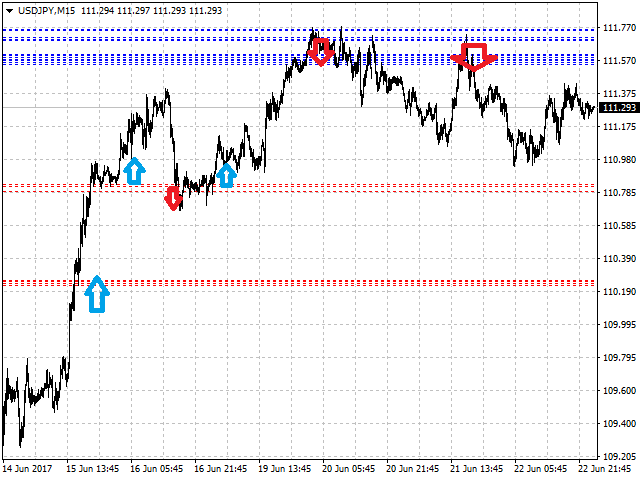
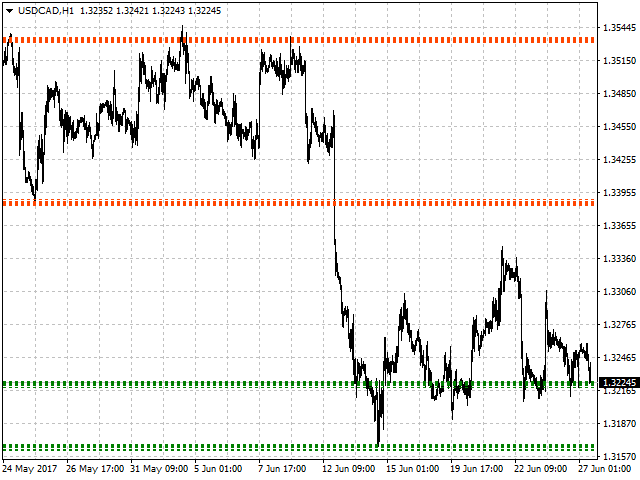
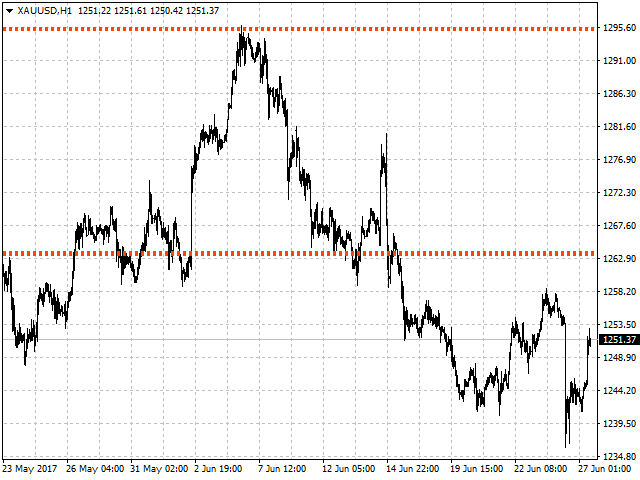
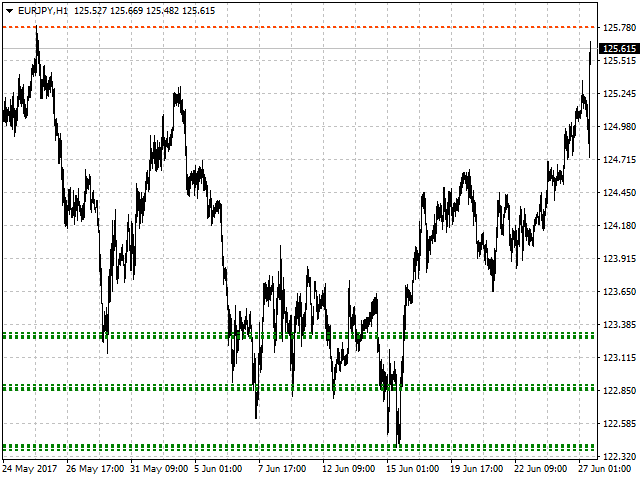
The indicator displays the resistance/support levels based on the history data of price action. It requires a depth of history to calculate the levels.
The tool has been developed using an original proprietary technique.
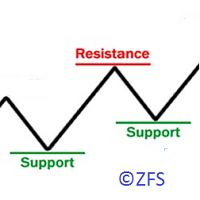
The resistance and support levels indicate the accumulations of orders.
Indicator Parameters
- Start Data/Time - initial date/time of the history data for calculation of levels
- Width of Lines Resistance/Support in Points - thickness (density) of lines in points, it is recommended to set a value commensurate to the spread
- Coefficient of number of lines, 0.5-2.0 - coefficient of the number of lines. Set a lower value if there are too many lines. Increase it, if there are too few lines.
- Color Resistance Line - color of resistance lines
- Color Support Line - color of support lines
